 Fourplex
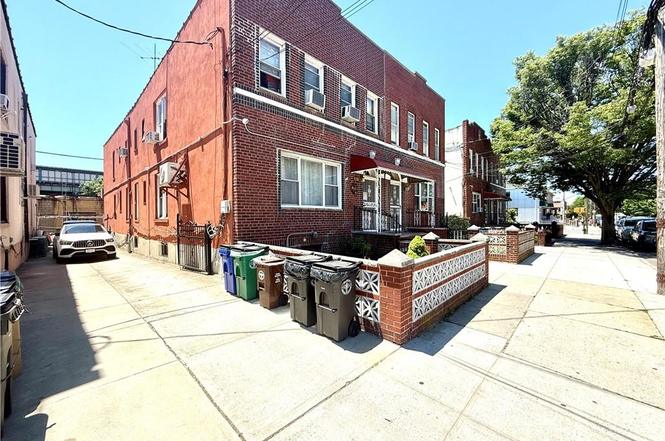
2510 85th St · New York, NY
Flood risk 5/10 · Moderate
- FEMA flood zone
- X (unshaded)
- Chance of flooding over 30 yrs
- 0.24%
- Est. flood insurance / yr
- $507 – $1,088
Fire risk 1/10 · Minimal
- Est. fire insurance / yr
- $691 – $1,283
Heat risk 7/10 · Major
- Hot days now (above 97°F)
- 7 days/yr
- Hot days in 30 yrs
- 16 days/yr
Wind risk 6/10 · Moderate
- Chance of severe wind over 30 yrs
- 68.0%
Air-quality risk 4/10 · Minor
- Unhealthy air days now
- 5 days/yr
- Unhealthy air days in 30 yrs
- 7 days/yr
Risk factors via First Street. Map © Google.
Why this score? — see what drove the D- grade
The composite is a weighted blend of 9 inputs, each scored 0–100. Each bar is that input's sub-score; the figure is the points it added to the 100-point composite (weight × sub-score).
- Cash flow +12.4/30.0
- Schools +5.0/10.0
- Rent growth +4.0/5.0
- Livability +3.8/5.0
- Condition / age +3.8/5.0
- DSCR +3.7/10.0
- ARV discount +3.7/15.0
- 1% rule +3.5/10.0
- Appreciation +0.0/10.0
$1,799,000
🖨 Deal sheet (PDF) 📄 Offer letter ✓ Due diligence
Multi-family units
County records classify this as Multi-Family (2-4 Unit). Listing-text estimate: 4 units. confirmed
Listing remarks
Prime Bensonhurst 4-Family Investment! Well-maintained semi-detached 21x75 brick building situated on a 27x100 lot with approximately 3,075 sq. ft. of interior space. The property features four spacious 2-bedroom, 1-bath apartments, providing flexibility for investors and future plans. Fully finished basement with 2 additional full bathrooms. Separate gas and electric meters. Ideally located just minutes from the vibrant 86th Street business corridor, offering easy access to supermarkets, restaurants, retail shops, banks, and everyday conveniences. Convenient transit options include the D train and multiple bus lines (B1, B3, B4, B64), with local schools and parks nearby. A rare opportunity
Key facts
- Finished basement
- Semi-detached
- 2,700 sq ft lot
Tags
Property features AI
Finance
- Other: Property type: Residential multi-family
- Financial info: Reported annual rent income: $115,200; Financing options considered: cash, bank mortgage, 1031 exchange
Exterior
- Parking: No designated parking
- Utilities: Electric: 110V; Hot water: Gas; Heating fuel: Gas
- Home design: Semi-detached residential building; Flat roof; Building dimensions approximately 75 x 21; Zoned R5
- Construction: Brick exterior and construction; Poured concrete foundation; Building footprint approximately 1,575 sq ft; Built as a multi-unit structure (4 units)
- Exterior features: Back yard; Storage rooms in building
Interior
- Kitchen: Refrigerator; Stove
- Bedrooms: Four 2-bedroom units (two on first floor, two on second floor)
- Flooring: Hardwood floors; Tile floors; Other floor types noted in remarks
- Bathrooms: Six full bathrooms total; Each unit has one full bathroom
- Heating & cooling: Gas-fired hot water heating; No AC units
- Interior features: Refrigerator; Stove; Other appliances noted in remarks; Finished full basement
- Laundry & utility: No central AC units reported; Hot water provided by gas
Neighborhood map
What this means for you Summary
Snapshot
- This is a 4 × 2-bed/1.0-bath units multifamily listed at $1.80M. Condition is rated good.
Deal economics
- At list price, monthly cash flow is $-306 ($-4k/yr) — negative. Per door: $-76/mo.
- To cash-flow at today's rent, offer at most $1.75M (2.5% below list).
- To meet the 1% rule (rent ≥ 1% of price), the offer needs to be $1.53M (14.7% below list).
- Recommended offer: $1.53M (14.7% below list) — sets the bar for 1% rule.
- Cap rate 6.1% vs local median 2.6% in New York — top-decile yield for the area; either an underpriced asset or a hidden risk that comps aren't pricing in. Stress-test before assuming the spread holds.
Location & tenants
- Location reads 75/100 on livability (#268 in NY, #4,188 nationally) — a middle-class / working-renter tenant base. Strengths: amenities A+, commute A+, health & safety A; Watch: crime F, cost of living F.
- Zoned schools: Ps 97 Highlawn (The) (math 67% / reading 67%, grade B+, #525 of 2,108 statewide, top 27%, 849 students, 69% FRL); Is 228 David A Boody (math 56% / reading 67%, grade B+, #147 of 729 statewide, top 20%, 1,551 students, 76% FRL); Midwood High School (math 94% / reading 96%, grade A+, #83 of 1,100 statewide, top 8%, 4,062 students, 73% FRL).
- Market conditions: Rents rising fast (+5.9%/yr); 334 active listings in the ZIP; 10,063 units permitted in Kings County in 2024 (9,789 in 5+ unit buildings).
- At $15,350/mo this rent would consume 280% of the median local household income ($66k/yr) (locally 6028% of renters already pay >50% of income on rent) — very limited rent-growth headroom before tenants either downsize or default.
Forward outlook
- Local home prices are declining (-3.0%/yr); year-one equity from $12k of loan paydown is wiped out by about $54k of value loss. Plan a longer hold.
- Kings County population projected at +13% by 2050 — modest demand growth; plan on rents tracking national, not racing it.
Negotiation context
- Only 3 days on market — expect competitive offers; lowballing is unlikely to land.
Risks & watch-outs
- Watch-outs: built in 1925 — expect roof / HVAC / electrical / plumbing capex.
- Climate carrying-cost: moderate flood risk; major wind risk, 68% chance of damaging wind over 30y; extreme-heat days projected 7→16/yr by 2055 (HVAC capex compounding) — expect insurance premiums to compound above CPI over the hold.
Questions for the listing agent
- What do current leases actually rent for vs. the listed asking? Can we see a recent rent roll and the last 12 months of T-12 income?
- Can we see the unit-by-unit rent roll, current vacancy, and any below-market leases? What's the average tenancy length?
- What capital expenditures (roof, boiler, parking lot, exteriors) have been made in the last 5 years, and what's planned in the next 2?
- Built in 1925 — when were the roof, HVAC, electrical panel, plumbing, and water heater last replaced?
- Is there a deadline driving the sale (1031 exchange, divorce, estate, relocation)? That informs how much negotiation room exists.
- Schools are B-rated — typically a magnet for longer-tenancy family renters. What's the average tenant stay here, and is there a school-zone premium baked into asking?
- Crime grade is F in this area — have there been break-ins, vandalism, or insurance claims at this property in the last 3 years? What carrier currently insures it and at what premium?
- The area grade is low — what's the realistic commute time and amenity access for the typical tenant pool here? Any planned neighborhood developments (good or bad) we should know about?
- What's the average days-on-market for RENTAL listings here right now (not sales)? A rising rental-DOM trend means longer vacancies and softer asking-rent achievability than the comps imply.
- What's the recent tenant-quality profile in this submarket — average credit score on applications, eviction rate, late-payment / NSF rate, and stable-employment percentage? A property-management company in the area should have these aggregated.
- How much new apartment / multifamily construction is in the pipeline within 1–3 miles? Heavy new supply (>2% of stock underway) typically softens rents 12–24 months out; light construction supports rent growth.
Investment metrics
- 1% rule
- 0.85% ✗
- Cap rate
- 6.09%
- Cash-on-cash
- -0.73%
- DSCR
- 0.97
- GRM
- 9.8
CMA / ARV
- ARV (on-the-fly)
- $1,660,500
- Comps found
- 12
Show comp detail 12 sales within ~0.75 mi
| Address | Dist | Beds/Ba | Sqft | Sold | Price | $/sf | Match |
|---|---|---|---|---|---|---|---|
| 125 Bay 40th St | 0.26mi | 7/3.0 (-1) | 3,245 (+6%) | 2mo | $1,250,000 | $385 | 68 |
| 2365 82nd St | 0.28mi | 8/4.0 | 2,800 (-9%) | 7mo | $1,800,000 | $643 | 66 |
| 50 Bay 46th St | 0.45mi | 7/3.5 (-1) | 3,025 (-2%) | 8mo | $1,560,000 | $516 | 63 |
| 1880 W 6th St | 0.46mi | 7/4.0 (-1) | 2,700 (-12%) | 2mo | $1,459,000 | $540 | 52 |
| 2041 85th St | 0.70mi | 7/4.0 (-1) | 3,280 (+7%) | 1mo | $1,580,000 | $482 | 50 |
| 2280 85th St | 0.34mi | 9/4.0 (+1) | 3,520 (+14%) | 7mo | $1,700,000 | $483 | 49 |
| 62 Bay 26th St | 0.70mi | 7/3.0 (-1) | 2,880 (-6%) | 5mo | $1,370,000 | $476 | 44 |
| 8784 24th Ave | 0.41mi | 9/6.5 (+1) | 3,430 (+12%) | 4mo | $1,850,000 | $539 | 43 |
| 2144 82nd St | 0.56mi | 7/6.0 (-1) | 3,395 (+10%) | 1mo | $1,850,000 | $545 | 43 |
| 125 Bay 26th St | 0.71mi | 7/2.5 (-1) | 3,288 (+7%) | 3mo | $1,790,000 | $544 | 42 |
| 1945 W 6th St | 0.47mi | 7/6.0 (-1) | 2,706 (-12%) | 6mo | $1,910,000 | $706 | 40 |
| 1718 W 11th St | 0.48mi | 9/3.0 (+1) | 2,652 (-14%) | 8mo | $1,450,000 | $547 | 38 |
Match score weights: distance 35% · size 25% · config 20% · recency 20%. Top-matched comps best support the ARV.
Projected returns pro-forma
-3.0% appreciation · 5.87% rent growth · sell at horizon
- IRR
- -14.3%
- Equity multiple
- 0.47×
- Total profit
- $-265,175
- Equity at exit
- $268,237
- IRR
- -1.5%
- Equity multiple
- 0.89×
- Total profit
- $-56,596
- Equity at exit
- $155,545
Cash invested: $503,720 (down + closing). Projections, not guarantees.
Landlord ↔ Tenant lean methodology
- Overall (CITY)
- 0 Strongly Tenant-Friendly
- State New York
- 15 Strongly Tenant-Friendly · D+10
- County
- — inherits STATE
- City New York
- 0 Strongly Tenant-Friendly · D+34
ZIP-level market 11214
- Rents YoY
- 5.9%
- Active inventory
- 334
- Price-to-rent
- 39.1×
Monthly cashflow live
- Estimated rent
- $15,350 high interval (Pro) →
- Mortgage (P&I)
- −$9,434
- Tax est. 1.5%
- −$2,249 /mo · $26,985/yr
- Insurance
- −$750
- HOA
- −$0
- Vacancy / Maint / Mgmt
- −$3,224
- Net cashflow
- $-306
Break-even live
Sensitivity live
| Price | -10% $937 | -5% $316 | +0% $-306 | +5% $-928 | +10% $-1,549 |
|---|---|---|---|---|---|
| Rent | -10% $-1,519 | -5% $-912 | +0% $-306 | +5% $300 | +10% $907 |
| Rate | -1.0pp $600 | -0.5pp $152 | base $-306 | +0.5pp $-772 | +1.0pp $-1,246 |
4-unit breakdown (identical units grouped — click to expand)
| Units | Beds | Baths | Est. rent |
|---|---|---|---|
| 4× units | 2 | 1 | $15,352 |
| #1 | 2 | 1 | $3,838 |
| #2 | 2 | 1 | $3,838 |
| #3 | 2 | 1 | $3,838 |
| #4 | 2 | 1 | $3,838 |
| Total (4 units) | $15,350 | ||
UW: 25.0% down · 7.5% · 30yr · 1.5% tax · 5.0% vac · 8.0% maint · 8.0% mgmt
Financing live
Cash to close
- Down payment
- $449,750
- Closing costs
- $53,970
- Reserves months
- —
- Total cash needed
- —
Loan-product check · same deal, 3 products live
Conventional
25% down · 7.5% · 30yr
- Down + closing
- —
- Monthly P&I
- —
- Monthly cashflow
- —
- DSCR
- —
- Eligible?
- —
Personal DTI + credit; lowest rate.
DSCR
20% down · 8.5% · 30yr
- Down + closing
- —
- Monthly P&I
- —
- Monthly cashflow
- —
- DSCR
- —
- Eligible?
- —
No personal income docs; deal must DSCR.
Hard money
10% down · 12.0% · 12mo
- Down + closing
- —
- Monthly P&I
- —
- Monthly cashflow
- —
- DSCR
- —
- Eligible?
- —
Short-term bridge; refi at stabilization.
Listing history 4 events
-
2026-06-21days on market $1,799,000 Active 3 DOM
-
2026-06-18$1,799,000 Active 1 DOM
-
2026-06-17remarks 699-char remark
-
2026-06-17$1,799,000 Active 1 DOM
ⓘ Source: listings_history table (triggers on properties + properties_extension) + one-shot
backfill from property_details.listing_events for pre-trigger history.
Climate risk First Street
- Flood 5/10 Major FEMA zone X (unshaded) · 24% chance over 30 yrs
- Wildfire 1/10 Low
- Heat 7/10 Severe 7 d/yr ≥97°F today · 16 d/yr by 30 yrs out
- Wind 6/10 Major 68% chance of damaging wind over 30 yrs
- Air quality 4/10 Moderate 5 unhealthy d/yr today · 7 by 30 yrs out
Nearby sold comps map
Loading sold comps map…
Walkable amenities ~0.75 mi
Loading nearby amenities…
Taxation est. · year 1
- Rental income
- $184,200
- − Mortgage interest
- −$100,772
- − Property taxes
- −$26,985
- − Insurance
- −$8,995
- − Repairs & maintenance
- −$14,736
- − Management
- −$14,736
- − Depreciation
- −$52,335
- Taxable loss
- −$34,359
- Est. tax savings @ 24.0%
- +$8,246
- After-tax cash flow
- $4,574/yr
For passive investors: Depreciation is non-cash, so a rental often shows a tax loss while cash-flowing — sheltering income. Rental losses are passive: they offset passive income freely, and up to $25,000/yr can offset ordinary (W-2) income if you actively participate and your MAGI is under $100k (phasing out to $0 by $150k); unused losses carry forward. On sale, claimed depreciation is recaptured at up to 25%, and gains may owe capital-gains tax (a 1031 exchange can defer both). Figures are a year-1 estimate at your 24.0% rate — not tax advice; consult a CPA.
Condition & rehab AI · 6 photos
A well-maintained 4-family brick building with good curb appeal and minimal repairs needed. Ideal for investors looking to capitalize on the location.
Value-add opportunities
- Both Paint exterior — Enhances curb appeal and value
- Both Landscaping — Improves curb appeal and rental appeal
Renovation cost estimate screening
Value-add ROI direction
- Both Paint exterior — Enhances curb appeal and value ↑
- Both Landscaping — Improves curb appeal and rental appeal ↑
ⓘ Cost ranges are severity-bucket heuristics (US national rule-of-thumb). Get contractor quotes + a written scope before underwriting a rehab budget.
Schools (NCES district)
No district data.
Livability — New York
- Score
- 75/100
- State rank
- #268
- US rank
- #4188
Category grades
Schools grade is shown separately in the Schools card above.
Census & demographics
- Census place
- New York, NY
- County
- Kings County · 2,614,986 people
- City population
- 7,731,280
- Metro
- New York-Newark-Jersey City, NY-NJ-PA
- Population (ZIP)
- 89,397
- Household income
- $65,895
- Rent vs Own
- Severe rent burden
- 6028.0
Population outlook (Kings County) Hauer SSP2
- Today (2025)
- 2,847,441 people
- By 2030
- 2,937,006 · +3.1%
- By 2040
- 3,095,491 · +8.7%
- By 2050
- 3,228,968 · +13.4%
- By 2075
- 3,321,723 · +16.7%
- By 2100
- 3,111,387 · +9.3%
Race, ethnicity, and origin ACS 2023
- Neighborhood character
- Diverse neighborhood (Simpson 0.67)
- Race & ethnicity
- White 40% Asian 38% Hispanic / Latino 17% Two or more races 6% Black 2%
- Hispanic origin (detail)
- Mexican 5% Puerto Rican 3% Dominican 2%
- Common ancestry
- Scotch-Irish 4% Subsaharan African 3% Romanian 2%
- Foreign-born
- 56% · China, Canada, Vietnam
- Languages at home
- 26% English-only · Chinese 28% Russian/Polish/Slavic 15% Spanish 13%
Political lean MEDSL · Kings
- 2024 margin
- Solid D (+44.0) · D 72.0% · R 28.0%
- 2008→2024 swing
- -15.5pp toward R · 2008: 59.4pp · 2024: 44.0pp
- All cycles
- 2024: D+44.0 2020: D+54.8 2016: D+61.8 2012: D+63.9 2008: D+59.4
Not yet ingested
- Civics
- —
Market trends
- HPI YoY
- ▼ -184.55%
- Current HPI
- 276.0804
- Rent YoY
- ▲ 5.87%
- Metro
- New York-Newark-Jersey City, NY-NJ-PA
- State GDP YoY
- ▲ 2.60%
- F500 in state
- 92
Industry mix (Fortune 500 HQ in NY)
| Industry | F500 HQs | Revenue |
|---|---|---|
| Financial Services | 10 | $950B |
|
||
| Consumer Goods | 9 | $162B |
|
||
| Insurance | 4 | $225B |
|
||
| Telecommunications | 2 | $144B |
|
||
| Pharmaceuticals | 2 | $112B |
|
||
| Media / Entertainment | 2 | $69B |
|
||
Price history
1 event — show timeline
- 2026-06-17 Listed $1,799,000 BNYMLS
Cash-flow waterfall
monthlySold comps — $/sqft
last 12 mo · ≤1 miLoading sold comps…