1400 Pompei Ln #42 · Naples, FL
Flood risk 5/10 · Moderate
- FEMA flood zone
- AH
- Chance of flooding over 30 yrs
- 0.23%
- Est. flood insurance / yr
- $1,142 – $2,507
Fire risk 1/10 · Minimal
- Est. fire insurance / yr
- $947 – $1,759
Heat risk 10/10 · Severe
- Hot days now (above 107°F)
- 7 days/yr
- Hot days in 30 yrs
- 28 days/yr
Wind risk 10/10 · Severe
- Chance of severe wind over 30 yrs
- 99.0%
Air-quality risk 2/10 · Minimal
- Unhealthy air days now
- 2 days/yr
- Unhealthy air days in 30 yrs
- 2 days/yr
Risk factors via First Street. Map © Google.
Why this score? — see what drove the C- grade
The composite is a weighted blend of 9 inputs, each scored 0–100. Each bar is that input's sub-score; the figure is the points it added to the 100-point composite (weight × sub-score).
- Cash flow +16.3/30.0
- 1% rule +8.7/10.0
- ARV discount +7.5/15.0
- DSCR +5.1/10.0
- Rent growth +5.0/5.0
- Schools +5.0/10.0
- Livability +4.0/5.0
- Condition / age +2.5/5.0
- Appreciation +0.0/10.0
$249,995
🖨 Deal sheet 📄 Offer letter ✓ Due diligence
Listing remarks
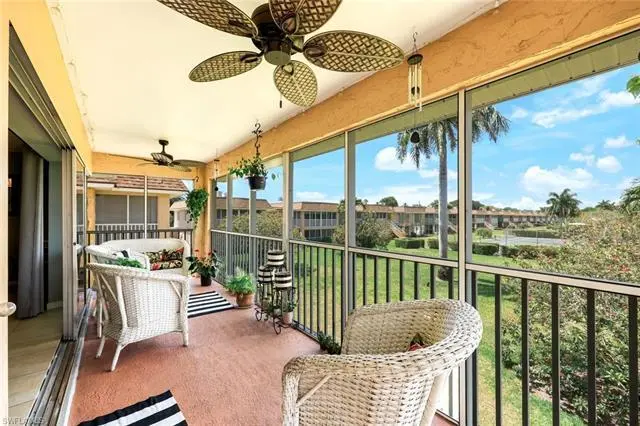
One of the most unique units in Sorrento Villas! This rare offering features one of the community’s most desirable and exclusive long garden views—one of only a few units positioned to overlook the expansive common green space rather than another building. It has been years since a unit with this kind of view has come to market. Step out onto your private balcony and enjoy a peaceful, open setting that feels like your own personal oasis—perfect for morning coffee or unwinding in the evening. This well-maintained condo offers a comfortable great room layout with two oversized bedrooms and two bathrooms. The primary suite features a walk-in closet with built-ins, and the uni
Key facts
- In-residence laundry
- Long garden views
- Private balcony
Tags
Property features AI
Finance
- Other: One-time community fee listed
- HOA & community: Mandatory HOA with professional management; Quarterly HOA fee; HOA covers insurance, lawn/land maintenance, sewer, water, street lights, reserves, management and master association fee; Community amenities include a community pool and tennis court; Non-gated community; Total annual recurring HOA fees listed
Exterior
- Parking: 2 assigned parking spaces
- Security: Smoke detectors
- Utilities: Central water; Central sewer; Cable available
- Home design: Residential property in Sorrento Villas; Low-rise building (1–3 stories); Rear exposure to the north; Built in 1974
- Construction: Concrete block construction; Shingle roof; Unit in building of 4 units
- Exterior features: Stucco exterior; Sliding windows; Windows: see remarks; Zero lot line; Landscaped area view; Central irrigation; Screened lanai/porch
Interior
- Kitchen: Dishwasher; Range; Microwave; Refrigerator
- Bedrooms: 2 bedrooms with a ground-level master bedroom; Split bedroom layout
- Flooring: Carpet; Tile
- Bathrooms: 2 full bathrooms; Master bath with shower only
- Heating & cooling: Central electric heat; Central electric cooling; Ceiling fans
- Interior features: Closet cabinets; Smoke detectors; Walk-in closet; Window coverings; Great room floor plan; Breakfast bar and dining in living area; Screened lanai/porch
- Laundry & utility: Washer and dryer inside the residence; Laundry in residence
Neighborhood map
What this means for you Summary
Snapshot
- This is a 2-bed/2.0-bath condo listed at $250k.
Deal economics
- At list price, monthly cash flow is $-14 ($-167/yr) — negative.
- To cash-flow at today's rent, offer at most $248k (0.8% below list).
- Meets the 1% rule at list price ($3k rent vs $250k).
- Recommended offer: $242k (3.0% below list) — sets the bar for market timing.
Location & tenants
- Location reads 80/100 on livability (#126 in FL, #1,903 nationally) — a professional / high-income tenant draw. Strengths: crime A+, amenities A+, employment A+; Watch: commute D+, cost of living F.
- Collier (suburban): math 60% / reading 56% proficiency, ranked #16 of 73 in FL (top 22%) — acceptable for families but not a draw, mixed tenant base, ~2y average lease.
- Zoned schools: Naples High School (math 47% / reading 52%, grade D, #179 of 667 statewide, top 29%, 1,719 students, 39% FRL) — zoned schools average 39% FRL vs 55% district-wide (16 pts lower); this property's tenant base skews higher-income than the district average.
- Market conditions: Rents rising fast (+14.6%/yr); 479 active listings in the ZIP; 32 comparable units currently listed for rent nearby; rentals leasing fast (median 14d on market — plan ~1-2 weeks tenant-placement turnaround); high-income renter base; 3,520 units permitted in Collier County in 2024 (959 in 5+ unit buildings).
- This rent runs 35% of the median local income ($117k/yr) — at the standard rent-burdened threshold; future hikes will face affordability resistance.
Forward outlook
- Local home prices are declining (-3.0%/yr); year-one equity from $2k of loan paydown is wiped out by about $8k of value loss. Plan a longer hold.
- Collier County population projected at +30% by 2050 — long-run rental-demand tailwind backs the buy-and-hold thesis.
- At projected returns (-3.0% appreciation + 8.0% rent growth), your $70k cash investment doubles in ~10 years — after that, you're playing with house money.
Negotiation context
- It's been on market 48 days — a 3% lower offer ($242k) is reasonable based on typical stale-listing flexibility.
- Current owner paid $85k; list at $250k implies a 194% gain — meaningful room to come down on a strong offer.
Risks & watch-outs
- Watch-outs: flood insurance adds $152/mo; HOA is 24% of rent.
- Climate carrying-cost: in FEMA flood zone AH (mandatory federal flood insurance); severe wind risk, 99% chance of damaging wind over 30y; extreme-heat days projected 7→28/yr by 2055 (HVAC capex compounding) — expect insurance premiums to compound above CPI over the hold.
Questions for the listing agent
- What do current leases actually rent for vs. the listed asking? Can we see a recent rent roll and the last 12 months of T-12 income?
- It's been on market 48 days. Have you received any prior offers? Is the seller open to a 3% concession, seller financing, or rate buy-down credit?
- Built in 1974 — when were the roof, HVAC, electrical panel, plumbing, and water heater last replaced?
- What's the actual annual flood-insurance premium (NFIP or private), and is the property in a SFHA with mandatory coverage?
- What does the HOA fee cover, when was the last increase, and are there any pending special assessments or reserve-fund shortfalls?
- Any open or pending special assessments — roof, HVAC, plumbing, elevator, façade? What's the per-unit balance and payoff schedule, and is the seller paying it off at close or rolling it to the buyer?
- Is there a deadline driving the sale (1031 exchange, divorce, estate, relocation)? That informs how much negotiation room exists.
- Schools are B-rated — typically a magnet for longer-tenancy family renters. What's the average tenant stay here, and is there a school-zone premium baked into asking?
- What's the average days-on-market for RENTAL listings here right now (not sales)? A rising rental-DOM trend means longer vacancies and softer asking-rent achievability than the comps imply.
- What's the recent tenant-quality profile in this submarket — average credit score on applications, eviction rate, late-payment / NSF rate, and stable-employment percentage? A property-management company in the area should have these aggregated.
- How much new apartment / multifamily construction is in the pipeline within 1–3 miles? Heavy new supply (>2% of stock underway) typically softens rents 12–24 months out; light construction supports rent growth.
Investment metrics
- 1% rule
- 1.37% ✓
- Cap rate
- 6.96%
- Cash-on-cash
- 2.37%
- DSCR
- 1.11
- GRM
- 6.1
CMA / ARV
No comps found within radius.
Projected returns pro-forma
-3.0% appreciation · 8.0% rent growth · sell at horizon
- IRR
- -8.2%
- Equity multiple
- 0.68×
- Total profit
- $-22,686
- Equity at exit
- $37,275
- IRR
- 9.0%
- Equity multiple
- 1.91×
- Total profit
- $63,943
- Equity at exit
- $21,615
Cash invested: $69,999 (down + closing). Projections, not guarantees.
Landlord ↔ Tenant lean methodology
- Overall (STATE)
- 87 Strongly Landlord-Friendly
- State Florida
- 87 Strongly Landlord-Friendly · R+3
- County
- — inherits STATE
- City
- — inherits STATE
ZIP-level market 34103
- Rents YoY
- 14.6%
- Active inventory
- 479
- Price-to-rent
- 6.1×
Monthly cashflow live
- Estimated rent
- $3,416 high interval (Pro) →
- Mortgage (P&I)
- −$1,311
- Tax est. 1.5%
- −$312 /mo · $3,750/yr
- Insurance
- −$104
- Flood insurance flood zone
- −$152 /mo · $1,824/yr
- HOA
- −$833
- Vacancy / Maint / Mgmt
- −$717
- Net cashflow
- $-14
Break-even live
UW: 25.0% down · 7.5% · 30yr · 1.5% tax · 5.0% vac · 8.0% maint · 8.0% mgmt
Financing live
Cash to close
- Down payment
- $62,499
- Closing costs
- $7,500
- Reserves months
- —
- Total cash needed
- —
Loan-product check · same deal, 3 products live
Conventional
25% down · 7.5% · 30yr
- Down + closing
- —
- Monthly P&I
- —
- Monthly cashflow
- —
- DSCR
- —
- Eligible?
- —
Personal DTI + credit; lowest rate.
DSCR
20% down · 8.5% · 30yr
- Down + closing
- —
- Monthly P&I
- —
- Monthly cashflow
- —
- DSCR
- —
- Eligible?
- —
No personal income docs; deal must DSCR.
Hard money
10% down · 12.0% · 12mo
- Down + closing
- —
- Monthly P&I
- —
- Monthly cashflow
- —
- DSCR
- —
- Eligible?
- —
Short-term bridge; refi at stabilization.
Rent comps 32 comps
| Address | Beds | Baths | Sqft | Rent | $/sqft | DOM | Units | Dist |
|---|---|---|---|---|---|---|---|---|
| 1400 Pompei Ln Naples, FL | 2.0 | 2.0 | 1012 | $1,888 | $1.86 | 23d | 2 | 0.01mi |
| 1400 Pompei Ln Unit S-21 Naples, FL | 2.0 | 2.0 | 1025 | $3,000 | $2.93 | 23d | 1 | 0.02mi |
| 1400 Pompei Ln Unit O-21 Naples, FL | 2.0 | 2.0 | 1025 | $2,200 | $2.15 | 23d | 1 | 0.02mi |
| 4525 Fluvia Ave Naples, FL | 2.0 | 1.0 | 1050 | $5,500 | $5.24 | 23d | 1 | 0.37mi |
| 4523 Fluvia Ave Naples, FL | 2.0 | 1.0 | 1050 | $5,500 | $5.24 | 23d | 1 | 0.37mi |
| 1100 Pine Ridge Rd Naples, FL | 1.0 | 1.0 | 868 | $2,125 | $2.45 | 13d | 3 | 0.39mi |
| 5934 Premier Way Naples, FL | 1.0–3.0 | 1.0–3.0 | 1350 | $3,618 | $2.68 | 13d | 29 | 0.49mi |
| 1085 Forest Lakes Dr Unit 8305 Naples, FL | 1.0 | 1.0 | 766 | $3,000 | $3.92 | 13d | 1 | 0.68mi |
| 1085 Forest Lakes Dr Unit 8202 Naples, FL | 2.0 | 2.0 | 1086 | $2,800 | $2.58 | 13d | 1 | 0.68mi |
| 1085 Forest Lakes Dr Unit 8106 Naples, FL | 2.0 | 2.0 | 1000 | $1,900 | $1.90 | 13d | 1 | 0.68mi |
| 1086 Forest Lakes Dr Unit 9303 Naples, FL | 2.0 | 2.0 | 1000 | $2,395 | $2.40 | 13d | 1 | 0.70mi |
| 287 Quail Forest Blvd #117 Naples, FL | 2.0 | 2.0 | 993 | $1,995 | $2.01 | 21d | 1 | 0.78mi |
| 287 Quail Forest Blvd #117 Naples, FL | 2.0 | 2.0 | 993 | $1,695 | $1.71 | 13d | 1 | 0.78mi |
| 260 Quail Forest Blvd Naples, FL | 1.0–2.0 | 1.0–2.0 | 875 | $2,533 | $2.89 | 13d | 22 | 0.82mi |
| 600 Neapolitan Way Naples, FL | 1.0–2.0 | 2.0 | 832 | $5,200 | $6.25 | 23d | 2 | 0.86mi |
| 180 Turtle Lake Ct #102 Naples, FL | 2.0 | 2.0 | 842 | $1,850 | $2.20 | 21d | 1 | 0.89mi |
| 170 Turtle Lake Ct Naples, FL | 2.0 | 2.0 | 842 | $2,975 | $3.53 | 13d | 1 | 0.89mi |
| 100 Forest Lakes Blvd Naples, FL | 1.0–2.0 | 2.0 | 842 | $3,500 | $4.16 | 13d | 3 | 0.91mi |
| 150 Turtle Lake Ct #307 Naples, FL | 1.0 | 1.0 | 638 | $1,500 | $2.35 | 23d | 1 | 0.94mi |
| 190 Turtle Lake Ct Unit 6 Naples, FL | 2.0 | 2.0 | 842 | $2,100 | $2.49 | 13d | 1 | 0.94mi |
| 200 Turtle Lake Ct #109 Naples, FL | 2.0 | 2.0 | 842 | $1,295 | $1.54 | 23d | 1 | 0.95mi |
| 225 Turtle Lake Ct Naples, FL | 1.0–2.0 | 1.0–2.0 | 740 | $1,900 | $2.57 | 23d | 2 | 0.96mi |
| 175 Turtle Lake Ct Naples, FL | 1.0–2.0 | 1.0–2.0 | 740 | $1,650 | $2.23 | 13d | 2 | 0.98mi |
| 200 Forest Lakes Blvd #111 Naples, FL | 2.0 | 2.0 | 842 | $3,100 | $3.68 | 13d | 1 | 1.06mi |
| 499 Forest Lakes Blvd #105 Naples, FL | 2.0 | 2.0 | 919 | $1,950 | $2.12 | 13d | 1 | 1.09mi |
| 300 Forest Lakes Blvd Naples, FL | 2.0 | 2.0 | 842 | $2,700 | $3.21 | 23d | 2 | 1.13mi |
| 400 Forest Lakes Blvd Naples, FL | 2.0 | 2.0 | 842 | $2,350 | $2.79 | 21d | 4 | 1.21mi |
| 501 Forest Lakes Blvd #111 Naples, FL | 2.0 | 2.0 | 919 | $2,300 | $2.50 | 13d | 1 | 1.21mi |
| 1545 Oyster Catcher Pt Unit A Naples, FL | 2.0 | 2.0 | 1124 | $2,200 | $1.96 | 13d | 1 | 1.26mi |
| 788 Park Shore Dr Naples, FL | 1.0–2.0 | 1.5–2.0 | 931 | $5,500 | $5.90 | 13d | 3 | 1.26mi |
| 1554 Oyster Catcher Pt Unit C Naples, FL | 2.0 | 2.0 | 1124 | $2,900 | $2.58 | 23d | 1 | 1.29mi |
| 301 Ridge Dr Naples, FL | 2.0 | 2.0 | 900 | $6,000 | $6.67 | 23d | 1 | 1.36mi |
HOA detail condo
- Monthly dues
- $833 · $9,996/yr
- Assessments
- None detected in remarks — confirm with the listing agent.
Listing history 18 events
-
2026-06-18days on market $249,995 Active 48 DOM
-
2026-06-17days on market $249,995 Active 47 DOM
-
2026-06-16days on market $249,995 Active 46 DOM
-
2026-06-15days on market $249,995 Active 45 DOM
-
2026-06-14days on market $249,995 Active 43 DOM
-
2026-06-10days on market $249,995 Active 40 DOM
-
2026-06-09days on market $249,995 Active 39 DOM
-
2026-06-08days on market $249,995 Active 38 DOM
-
2026-06-07days on market $249,995 Active 37 DOM
-
2026-06-03pricedays on market $249,995 Active 33 DOM
-
2026-06-02days on market $259,995 Active 32 DOM
-
2026-06-01days on market $259,995 Active 31 DOM
-
2026-05-31days on market $259,995 Active 30 DOM
-
2026-05-30days on market $259,995 Active 29 DOM
-
2026-05-01$259,995 Active
-
2003-12-13soldstatus $85,000
-
1999-07-08soldstatus $61,000
-
1987-08-01soldstatus $50,000
ⓘ Source: listings_history table (triggers on properties + properties_extension) + one-shot
backfill from property_details.listing_events for pre-trigger history.
Climate risk First Street
- Flood 5/10 Major FEMA zone AH · 23% chance over 30 yrs
- Wildfire 1/10 Low
- Heat 10/10 Extreme 7 d/yr ≥107°F today · 28 d/yr by 30 yrs out
- Wind 10/10 Extreme 99% chance of damaging wind over 30 yrs
- Air quality 2/10 Low 2 unhealthy d/yr today · 2 by 30 yrs out
Nearby sold comps map
Loading sold comps map…
Walkable amenities ~0.75 mi
Loading nearby amenities…
Taxation est. · year 1
- Rental income
- $40,994
- − Mortgage interest
- −$14,004
- − Property taxes
- −$3,750
- − Insurance
- −$3,074
- − Repairs & maintenance
- −$3,280
- − Management
- −$3,280
- − HOA
- −$9,996
- − Depreciation
- −$7,273
- Taxable loss
- −$3,661
- Est. tax savings @ 24.0%
- +$879
- After-tax cash flow
- $712/yr
For passive investors: Depreciation is non-cash, so a rental often shows a tax loss while cash-flowing — sheltering income. Rental losses are passive: they offset passive income freely, and up to $25,000/yr can offset ordinary (W-2) income if you actively participate and your MAGI is under $100k (phasing out to $0 by $150k); unused losses carry forward. On sale, claimed depreciation is recaptured at up to 25%, and gains may owe capital-gains tax (a 1031 exchange can defer both). Figures are a year-1 estimate at your 24.0% rate — not tax advice; consult a CPA.
Schools (NCES district)
- District
- Collier
- NCES district ID
- 1200330
- Math proficiency
- 60% ▼ -4.00%
- Reading proficiency
- 56% ▼ -2.00%
- Median HH income
- $58,275
- Composite
- 50.23/100
- National rank
- #1892
- State rank
- #16 of 73 in FL
Livability — Naples
- Score
- 80/100
- State rank
- #126
- US rank
- #1903
Category grades
Schools grade is shown separately in the Schools card above.
Census & demographics
- County
- Collier County · 396,295 people
- City population
- 344,941
- Metro
- Naples-Marco Island, FL
- Population (ZIP)
- 11,299
- Household income
- $116,875
- Rent vs Own
- Severe rent burden
- 311.0
Population outlook (Collier County) Hauer SSP2
- Today (2025)
- 420,858 people
- By 2030
- 450,054 · +6.9%
- By 2040
- 502,232 · +19.3%
- By 2050
- 544,932 · +29.5%
- By 2075
- 627,203 · +49.0%
- By 2100
- 659,015 · +56.6%
Race, ethnicity, and origin ACS 2023
- Neighborhood character
- Predominantly White (87%)
- Race & ethnicity
- White 87% Hispanic / Latino 10% Two or more races 8% Asian 1%
- Hispanic origin (detail)
- Common ancestry
- Romanian 4% Lithuanian 2% Portuguese 2%
- Foreign-born
- 13% · Canada
- Languages at home
- 87% English-only · Spanish 9% Other Indo-European 2% German/W. Germanic 1%
Political lean MEDSL · Collier
- 2024 margin
- Solid R (+33.1) · D 33.1% · R 66.2%
- 2008→2024 swing
- -10.6pp toward R · 2008: -22.5pp · 2024: -33.1pp
- All cycles
- 2024: R+33.1 2020: R+24.7 2016: R+26.0 2012: R+30.1 2008: R+22.5
Not yet ingested
- Civics
- —
Market trends
- HPI YoY
- ▼ -327.53%
- Current HPI
- 315.1396
- Rent YoY
- ▲ 14.55%
- Metro
- Naples-Marco Island, FL
- State GDP YoY
- ▲ 3.28%
- F500 in state
- 36
Industry mix (Fortune 500 HQ in FL)
| Industry | F500 HQs | Revenue |
|---|---|---|
| Industrial Technology | 2 | $29B |
|
||
| Insurance | 2 | $17B |
|
||
| Retail | 1 | $60B |
|
||
| Technology Distribution | 1 | $58B |
|
||
| Homebuilding | 1 | $35B |
|
||
| Technology Manufacturing | 1 | $35B |
|
||
Price history
+420.0% since first listed4 events — show timeline
- 2026-05-01 Listed $259,995 NAPLESMLS
- 2003-12-13 Sold (Public Records) $85,000 Public Records
- 1999-07-08 Sold (Public Records) $61,000 Public Records
- 1987-08-01 Sold (Public Records) $50,000 Public Records
Property tax history
+0.8%/yrLatest (2025): $393 · +3.8% YoY. Source: county tax records.
Cash-flow waterfall
monthlySold comps — $/sqft
last 12 mo · ≤1 miLoading sold comps…