 🏷️ Likely Rental
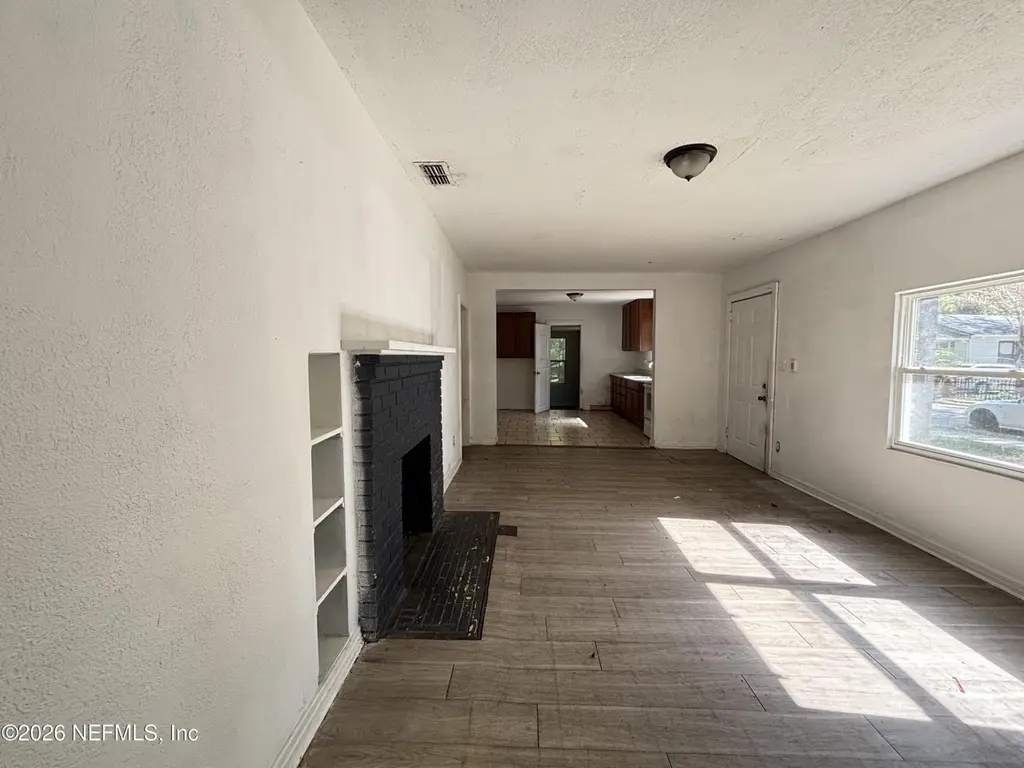
286 Belfort St · Jacksonville, FL
Flood risk 1/10 · Minimal
- FEMA flood zone
- X (unshaded)
- Chance of flooding over 30 yrs
- 0.0%
- Est. flood insurance / yr
- $507 – $1,088
Fire risk 1/10 · Minimal
- Est. fire insurance / yr
- $947 – $1,759
Heat risk 9/10 · Severe
- Hot days now (above 107°F)
- 7 days/yr
- Hot days in 30 yrs
- 20 days/yr
Wind risk 9/10 · Severe
- Chance of severe wind over 30 yrs
- 99.0%
Air-quality risk 5/10 · Moderate
- Unhealthy air days now
- 7 days/yr
- Unhealthy air days in 30 yrs
- 7 days/yr
Risk factors via First Street. Map © Google.
Why this score? — see what drove the B grade
The composite is a weighted blend of 9 inputs, each scored 0–100. Each bar is that input's sub-score; the figure is the points it added to the 100-point composite (weight × sub-score).
- Cash flow +30.0/30.0
- 1% rule +10.0/10.0
- DSCR +10.0/10.0
- ARV discount +7.5/15.0
- Livability +4.2/5.0
- Schools +3.9/10.0
- Rent growth +3.7/5.0
- Condition / age +2.5/5.0
- Appreciation +0.0/10.0
$99,000
🖨 Deal sheet 📄 Offer letter ✓ Due diligence
Listing remarks MLS
Occupied investment property. selling as is. Section 8 HUD approved.
Key facts
- Screened in porch
- Eat-in kitchen
- Oversized backyard
Tags
Property features AI
Exterior
- Parking: On-street parking
- Utilities: Electricity available; Sewer available; Water available
- Home design: Single-family residence; Used as investment property
- Exterior features: Lot approximately 0.24 acres; No private pool
Interior
- Kitchen: Electric range; Refrigerator
- Bedrooms: 3 bedrooms
- Bathrooms: 1 full bathroom
- Heating & cooling: Central heating; Central air
- Interior features: Electric range; Refrigerator; Central heating; Central air
Neighborhood map
What this means for you Summary
Snapshot
- This is a 3-bed/1.0-bath single-family listed at $99k.
Deal economics
- At list price, monthly cash flow is $549 ($7k/yr) — positive.
- The deal already cash-flows at list — no discount required.
- Meets the 1% rule at list price ($2k rent vs $99k).
- Recommended offer: $98k (1.5% below list) — sets the bar for market timing.
- Cap rate 12.9% vs local median 4.0% in Jacksonville — top-decile yield for the area; either an underpriced asset or a hidden risk that comps aren't pricing in. Stress-test before assuming the spread holds.
Location & tenants
- Location reads 83/100 on livability (#50 in FL, #911 nationally) — a professional / high-income tenant draw. Strengths: amenities A+, commute A+, housing A+.
- Duval (urban): math 46% / reading 45% proficiency, ranked #48 of 73 in FL (top 66%) — families likely to look elsewhere, expect single-tenant / working-renter base with shorter leases.
- Market conditions: Rents rising fast (+4.7%/yr); 75 active listings in the ZIP; 40 comparable units currently listed for rent nearby; rentals at typical pace (median 20d on market — plan ~3-4 weeks tenant-placement turnaround); 6,503 units permitted in Duval County in 2024 (1,131 in 5+ unit buildings).
- This rent runs 30% of the median local income ($65k/yr) — at the standard rent-burdened threshold; future hikes will face affordability resistance.
Forward outlook
- Local home prices are declining (-3.0%/yr); year-one equity from $684 of loan paydown is wiped out by about $3k of value loss. Plan a longer hold.
- Duval County population projected at +19% by 2050 — long-run rental-demand tailwind backs the buy-and-hold thesis.
- At projected returns (-3.0% appreciation + 4.7% rent growth), your $28k cash investment doubles in ~5 years — after that, you're playing with house money.
Negotiation context
- It's been on market 23 days — a 2% lower offer ($98k) is reasonable based on typical stale-listing flexibility.
- 8 sale attempts since 22y ago with the ask held roughly flat each time — persistent listings suggest the price (not the market) is what's stuck; bring a comps-based counter.
- Current owner paid $50k; list at $99k implies a 100% gain — meaningful room to come down on a strong offer.
Risks & watch-outs
- Watch-outs: built in 1950 — expect roof / HVAC / electrical / plumbing capex.
- Climate carrying-cost: severe wind risk, 99% chance of damaging wind over 30y; extreme-heat days projected 7→20/yr by 2055 (HVAC capex compounding) — expect insurance premiums to compound above CPI over the hold.
Questions for the listing agent
- Built in 1950 — when were the roof, HVAC, electrical panel, plumbing, and water heater last replaced?
- Is there a deadline driving the sale (1031 exchange, divorce, estate, relocation)? That informs how much negotiation room exists.
- Schools are B-rated — typically a magnet for longer-tenancy family renters. What's the average tenant stay here, and is there a school-zone premium baked into asking?
- What's the average days-on-market for RENTAL listings here right now (not sales)? A rising rental-DOM trend means longer vacancies and softer asking-rent achievability than the comps imply.
- What's the recent tenant-quality profile in this submarket — average credit score on applications, eviction rate, late-payment / NSF rate, and stable-employment percentage? A property-management company in the area should have these aggregated.
- How much new for-sale + rental construction is in the pipeline within 1–3 miles? Heavy new supply typically softens prices + rents 12–24 months out; constrained supply supports both.
Investment metrics
- 1% rule
- 1.66% ✓
- Cap rate
- 12.95%
- Cash-on-cash
- 23.77%
- DSCR
- 2.06
- GRM
- 5.0
CMA / ARV
- ARV (on-the-fly)
- $199,260
- Comps found
- 12
Show comp detail 12 sales within ~0.75 mi
| Address | Dist | Beds/Ba | Sqft | Sold | Price | $/sf | Match |
|---|---|---|---|---|---|---|---|
| 332 Woodlawn Ave | 0.08mi | 3/2.0 | 1,230 (0%) | 3mo | $235,100 | $191 | 89 |
| 2562 Summit St | 0.16mi | 3/2.0 | 1,268 (+3%) | 3mo | $205,000 | $162 | 81 |
| 306 Woodlawn Ave | 0.06mi | 3/2.0 | 1,100 (-11%) | 2mo | $70,000 | $64 | 74 |
| 411 King St | 0.38mi | 3/1.0 | 1,182 (-4%) | 4mo | $117,500 | $99 | 72 |
| 2550 Summit St | 0.14mi | 2/2.0 (-1) | 1,083 (-12%) | 0mo | $130,000 | $120 | 64 |
| 2331 Myra St | 0.68mi | 3/1.0 | 1,280 (+4%) | 1mo | $366,000 | $286 | 61 |
| 724 James St | 0.74mi | 3/2.0 | 1,207 (-2%) | 2mo | $265,000 | $220 | 57 |
| 2343 Ernest St | 0.56mi | 3/1.0 | 1,092 (-11%) | 4mo | $265,000 | $243 | 52 |
| 2664 Ernest St | 0.64mi | 3/2.0 | 1,361 (+11%) | 4mo | $295,000 | $217 | 45 |
| 2908 Spencer St | 0.71mi | 3/2.0 | 1,100 (-11%) | 0mo | $158,000 | $144 | 45 |
| 2881 Lenox Ave | 0.72mi | 3/1.0 | 1,068 (-13%) | 2mo | $90,000 | $84 | 43 |
| 1831 Broadway Ave | 0.71mi | 3/2.0 | 1,050 (-15%) | 3mo | $95,000 | $90 | 36 |
Match score weights: distance 35% · size 25% · config 20% · recency 20%. Top-matched comps best support the ARV.
Projected returns pro-forma
-3.0% appreciation · 4.69% rent growth · sell at horizon
- IRR
- 19.0%
- Equity multiple
- 1.79×
- Total profit
- $21,832
- Equity at exit
- $14,761
- IRR
- 28.5%
- Equity multiple
- 3.75×
- Total profit
- $76,358
- Equity at exit
- $8,560
Cash invested: $27,720 (down + closing). Projections, not guarantees.
Landlord ↔ Tenant lean methodology
- Overall (STATE)
- 87 Strongly Landlord-Friendly
- State Florida
- 87 Strongly Landlord-Friendly · R+3
- County
- — inherits STATE
- City
- — inherits STATE
ZIP-level market 32204
- Home prices YoY
- -28.2%
- Rents YoY
- 4.7%
- Active inventory
- 75
- Price-to-rent
- 5.0×
Monthly cashflow live
- Estimated rent
- $1,641 high interval (Pro) →
- Mortgage (P&I)
- −$519
- Tax from tax record
- −$187 /mo · $2,246/yr
- Insurance
- −$41
- HOA
- −$0
- Vacancy / Maint / Mgmt
- −$345
- Net cashflow
- $549
Break-even live
UW: 25.0% down · 7.5% · 30yr · 1.5% tax · 5.0% vac · 8.0% maint · 8.0% mgmt
Financing live
Cash to close
- Down payment
- $24,750
- Closing costs
- $2,970
- Reserves months
- —
- Total cash needed
- —
Loan-product check · same deal, 3 products live
Conventional
25% down · 7.5% · 30yr
- Down + closing
- —
- Monthly P&I
- —
- Monthly cashflow
- —
- DSCR
- —
- Eligible?
- —
Personal DTI + credit; lowest rate.
DSCR
20% down · 8.5% · 30yr
- Down + closing
- —
- Monthly P&I
- —
- Monthly cashflow
- —
- DSCR
- —
- Eligible?
- —
No personal income docs; deal must DSCR.
Hard money
10% down · 12.0% · 12mo
- Down + closing
- —
- Monthly P&I
- —
- Monthly cashflow
- —
- DSCR
- —
- Eligible?
- —
Short-term bridge; refi at stabilization.
Rent comps 40 comps
| Address | Beds | Baths | Sqft | Rent | $/sqft | DOM | Units | Dist |
|---|---|---|---|---|---|---|---|---|
| 371 Smith St Jacksonville, FL | 3.0 | 2.0 | 1050 | $1,325 | $1.26 | 4d | 1 | 0.29mi |
| 2526 Phyllis St Jacksonville, FL | 3.0 | 2.0 | 1300 | $1,800 | $1.38 | 24d | 1 | 0.42mi |
| 2561 Rosselle St #1 Jacksonville, FL | 3.0 | 3.0 | 1287 | $1,395 | $1.08 | 24d | 1 | 0.46mi |
| 420 Sunshine St Jacksonville, FL | 3.0 | 2.0 | 1050 | $1,350 | $1.29 | 2d | 1 | 0.55mi |
| 715 Ralph St Jacksonville, FL | 4.0 | 2.0 | 1338 | $2,195 | $1.64 | 4d | 1 | 0.63mi |
| 1923 Broadway Ave Jacksonville, FL | 3.0 | 2.0 | 1230 | $1,421 | $1.16 | 24d | 1 | 0.66mi |
| 717 King St Jacksonville, FL | 3.0 | 2.0 | 1132 | $1,800 | $1.59 | 17d | 1 | 0.66mi |
| 2012 Baldwin St Jacksonville, FL | 3.0 | 2.0 | 1232 | $1,445 | $1.17 | 24d | 1 | 0.67mi |
| 2614 Dellwood Ave Jacksonville, FL | 3.0 | 1.0 | 1122 | $2,325 | $2.07 | 4d | 1 | 0.67mi |
| 2002 Ernest St Unit A Jacksonville, FL | 2.0 | 1.0 | 1000 | $1,795 | $1.79 | 14d | 1 | 0.68mi |
| 2044 Dellwood Ave Jacksonville, FL | 2.0 | 1.0 | 1375 | $1,825 | $1.33 | 24d | 1 | 0.71mi |
| 2022 Dellwood Ave Unit 2 Jacksonville, FL | 2.0 | 1.0 | 800 | $1,098 | $1.37 | 15d | 1 | 0.72mi |
| 2128 Woodside St Jacksonville, FL | 2.0 | 1.0 | 776 | $895 | $1.15 | 24d | 1 | 0.74mi |
| 2309 College St Jacksonville, FL | 2.0 | 1.0 | 1200 | $1,200 | $1.00 | 14d | 1 | 0.75mi |
| 2611 Green St Jacksonville, FL | 2.0 | 1.0 | 728 | $1,195 | $1.64 | 24d | 1 | 0.75mi |
| 2611 Green St Jacksonville, FL | 2.0 | 1.0 | 728 | $1,195 | $1.64 | 15d | 1 | 0.75mi |
| 2701 Myra St Jacksonville, FL | 3.0 | 1.0 | 1065 | $1,595 | $1.50 | 21d | 1 | 0.75mi |
| 2577 Haldumar Ter Jacksonville, FL | 2.0 | 1.0 | 865 | $1,050 | $1.21 | 2d | 1 | 0.75mi |
| 2759 Dellwood Ave Jacksonville, FL | 3.0 | 2.0 | 1080 | $2,100 | $1.94 | 20d | 1 | 0.76mi |
| 2578 Haldumar Ter Jacksonville, FL | 2.0 | 1.0 | 1114 | $2,195 | $1.97 | 15d | 1 | 0.77mi |
| 1979 Yulee St Jacksonville, FL | 3.0 | 2.0 | 1050 | $1,500 | $1.43 | 24d | 1 | 0.78mi |
| 907 Copeland St Jacksonville, FL | 2.0 | 1.0 | 784 | $1,395 | $1.78 | 24d | 1 | 0.79mi |
| 2136 College St #4 Jacksonville, FL | 2.0 | 1.0 | 900 | $1,250 | $1.39 | 24d | 1 | 0.80mi |
| 1751 Broadway Ave Jacksonville, FL | 2.0 | 1.0 | 1000 | $1,525 | $1.52 | 4d | 1 | 0.83mi |
| 2812 Ernest St Jacksonville, FL | 3.0 | 1.0 | 1461 | $2,800 | $1.92 | 24d | 1 | 0.85mi |
| 2657 Post St Apt 2 Jacksonville, FL | 3.0 | 1.0 | 1100 | $1,700 | $1.55 | 3d | 1 | 0.88mi |
| 1657 Union St W Unit 1 Jacksonville, FL | 2.0 | 1.0 | 700 | $1,050 | $1.50 | 2d | 1 | 0.88mi |
| 1607 Logan St Jacksonville, FL | 4.0 | 2.0 | 1232 | $1,800 | $1.46 | 24d | 1 | 0.90mi |
| 2803 College St Jacksonville, FL | 2.0 | 1.0 | 1100 | $1,550 | $1.41 | 14d | 1 | 0.92mi |
| 3035 Fitzgerald St Jacksonville, FL | 2.0 | 1.0 | 900 | $1,021 | $1.13 | 3d | 1 | 0.94mi |
| 226 Spruce St Jacksonville, FL | 4.0 | 2.0 | 1196 | $1,148 | $0.96 | 3d | 1 | 0.94mi |
| 1545 Union St W Jacksonville, FL | 3.0 | 2.0 | 1253 | $1,400 | $1.12 | 3d | 1 | 0.95mi |
| 2410 McQuade St Jacksonville, FL | 3.0 | 2.0 | 1307 | $1,425 | $1.09 | 24d | 1 | 0.96mi |
| 2777 Post St Jacksonville, FL | 2.0 | 1.0 | 1200 | $1,195 | $1.00 | 24d | 1 | 0.96mi |
| 1539 Union St W Jacksonville, FL | 3.0 | 1.5 | 1000 | $1,144 | $1.14 | 14d | 1 | 0.96mi |
| 232 Chelsea St Unit 4 Jacksonville, FL | 2.0 | 1.0 | 850 | $1,000 | $1.18 | 24d | 1 | 0.96mi |
| 2185 Kingston St Jacksonville, FL | 3.0 | 2.0 | 1230 | $1,381 | $1.12 | 24d | 1 | 0.96mi |
| 2154 Placeda St Jacksonville, FL | 4.0 | 1.5 | 1124 | $1,500 | $1.33 | 21d | 1 | 0.97mi |
| 2589 Park St Unit 2589 Jacksonville, FL | 2.0 | 1.0 | 1354 | $1,850 | $1.37 | 24d | 1 | 0.97mi |
| 2512 Park St Unit 3 Jacksonville, FL | 2.0 | 1.5 | 800 | $1,395 | $1.74 | 4d | 1 | 0.98mi |
Listing history 35 events
-
2026-06-18days on market $99,000 Active 23 DOM
-
2026-06-17days on market $99,000 Active 22 DOM
-
2026-06-16days on market $99,000 Active 21 DOM
-
2026-06-15days on market $99,000 Active 20 DOM
-
2026-06-13days on market $99,000 Active 18 DOM
-
2026-06-13days on market $99,000 Active 17 DOM
-
2026-06-10days on market $99,000 Active 14 DOM
-
2026-06-08days on market $99,000 Active 13 DOM
-
2026-06-07days on market $99,000 Active 12 DOM
-
2026-06-05days on market $99,000 Active 9 DOM
-
2026-06-03days on market $99,000 Active 8 DOM
-
2026-06-02days on market $99,000 Active 7 DOM
-
2026-06-01days on market $99,000 Active 6 DOM
-
2026-05-31days on market $99,000 Active 5 DOM
-
2026-05-26$99,000 Active
-
2024-04-05historical $1,250
-
2024-03-30price $1,250
-
2024-03-08$1,300
-
2024-03-08historical $1,300
-
2024-03-06price $1,300
-
2024-02-14price $1,350
-
2024-02-13$1,400
-
2024-01-11historical $1,200
-
2024-01-04$1,200
-
2023-12-25historical $1,200
-
2023-12-23historical $1,200
-
2023-12-21$1,200
-
2023-11-28price $1,200
-
2023-10-31$1,250
-
2018-04-06soldstatus $49,500
-
2005-10-31historical 69-char remark
Show marketing remark (69 chars)
Occupied investment property. selling as is. Section 8 HUD approved.
-
2005-08-04soldstatus $45,000
-
2005-05-10$65,000 69-char remark
Show marketing remark (69 chars)
Occupied investment property. selling as is. Section 8 HUD approved.
-
2005-02-11historical 254-char remark
Show marketing remark (254 chars)
THIS HOME FEATURES A FORMAL LIVING ROOM WITH FIREPLACE, BUILT IN SHELVING, HARDWOOD FLOORS, EAT-IN KITCHEN, CENTRAL HEAT & AIR AND AN OVER SIZED BACKYARD. BEING SOLD 'AS-IS'. $1000 CASH BONUS TO SELLING AGENT. HUD RENTAL INC $700 THROUGHT 10/31/2004.
-
2004-08-11$65,000 254-char remark
Show marketing remark (254 chars)
THIS HOME FEATURES A FORMAL LIVING ROOM WITH FIREPLACE, BUILT IN SHELVING, HARDWOOD FLOORS, EAT-IN KITCHEN, CENTRAL HEAT & AIR AND AN OVER SIZED BACKYARD. BEING SOLD 'AS-IS'. $1000 CASH BONUS TO SELLING AGENT. HUD RENTAL INC $700 THROUGHT 10/31/2004.
ⓘ Source: listings_history table (triggers on properties + properties_extension) + one-shot
backfill from property_details.listing_events for pre-trigger history.
Tax reassessment forecast FL · Resets to sale price
- Current annual tax
- $2,246 · $187/mo
- Projected year-2 tax
- $2,246 · $187/mo
- Expected delta
- $0/yr ($0/mo · 0.0%)
ⓘ Screening estimate from a state-policy table — verify with the county assessor before closing.
Climate risk First Street
- Flood 1/10 Low FEMA zone X (unshaded) · 0% chance over 30 yrs
- Wildfire 1/10 Low
- Heat 9/10 Extreme 7 d/yr ≥107°F today · 20 d/yr by 30 yrs out
- Wind 9/10 Extreme 99% chance of damaging wind over 30 yrs
- Air quality 5/10 Major 7 unhealthy d/yr today · 7 by 30 yrs out
Nearby sold comps map
Loading sold comps map…
Walkable amenities ~0.75 mi
Loading nearby amenities…
Taxation est. · year 1
- Rental income
- $19,697
- − Mortgage interest
- −$5,546
- − Property taxes
- −$2,246
- − Insurance
- −$495
- − Repairs & maintenance
- −$1,576
- − Management
- −$1,576
- − Depreciation
- −$2,880
- Taxable income
- $5,379
- Est. tax owed @ 24.0%
- −$1,291
- After-tax cash flow
- $5,298/yr
For passive investors: Depreciation is non-cash, so a rental often shows a tax loss while cash-flowing — sheltering income. Rental losses are passive: they offset passive income freely, and up to $25,000/yr can offset ordinary (W-2) income if you actively participate and your MAGI is under $100k (phasing out to $0 by $150k); unused losses carry forward. On sale, claimed depreciation is recaptured at up to 25%, and gains may owe capital-gains tax (a 1031 exchange can defer both). Figures are a year-1 estimate at your 24.0% rate — not tax advice; consult a CPA.
Schools (NCES district)
- District
- Duval
- NCES district ID
- 1200480
- Math proficiency
- 46% ▼ -11.00%
- Reading proficiency
- 45% ▼ -4.00%
- Median HH income
- $48,987
- Composite
- 38.97/100
- National rank
- #4076
- State rank
- #48 of 73 in FL
Livability — Jacksonville
- Score
- 83/100
- State rank
- #50
- US rank
- #911
Category grades
Schools grade is shown separately in the Schools card above.
Census & demographics
- Census place
- Jacksonville, FL
- County
- Duval County · 1,015,274 people
- City population
- 979,034
- Metro
- Jacksonville, FL
- Population (ZIP)
- 9,151
- Household income
- $65,063
- Rent vs Own
- Severe rent burden
- 866.0
Population outlook (Duval County) Hauer SSP2
- Today (2025)
- 1,013,010 people
- By 2030
- 1,059,228 · +4.6%
- By 2040
- 1,141,439 · +12.7%
- By 2050
- 1,205,258 · +19.0%
- By 2075
- 1,324,282 · +30.7%
- By 2100
- 1,319,620 · +30.3%
Race, ethnicity, and origin ACS 2023
- Neighborhood character
- Diverse neighborhood (Simpson 0.60)
- Race & ethnicity
- White 55% Black 30% Hispanic / Latino 6% Asian 6% Two or more races 6%
- Hispanic origin (detail)
- Mexican 3% Puerto Rican 1%
- Common ancestry
- Slovak 2% Lithuanian 2% Italian 1%
- Foreign-born
- 7% · China, Canada, Philippines
- Languages at home
- 92% English-only · Spanish 3% Chinese 2% Other Asian/Pacific 2%
Political lean MEDSL · Duval
- 2024 margin
- Toss-up / Even · D 48.7% · R 50.1% · Other 1.2%
- 2008→2024 swing
- +0.4pp no change · 2008: -1.9pp · 2024: -1.5pp
- All cycles
- 2024: R+1.5 2020: D+3.8 2016: R+1.5 2012: R+3.6 2008: R+1.9
Not yet ingested
- Civics
- —
Market trends
- HPI YoY
- ▼ -123.96%
- Current HPI
- 316.3185
- Rent YoY
- ▲ 4.69%
- Metro
- Jacksonville, FL
- State GDP YoY
- ▲ 3.28%
- F500 in state
- 36
Industry mix (Fortune 500 HQ in FL)
| Industry | F500 HQs | Revenue |
|---|---|---|
| Industrial Technology | 2 | $29B |
|
||
| Insurance | 2 | $17B |
|
||
| Retail | 1 | $60B |
|
||
| Technology Distribution | 1 | $58B |
|
||
| Homebuilding | 1 | $35B |
|
||
| Technology Manufacturing | 1 | $35B |
|
||
Price history
+52.3% since first listed21 events — show timeline
- 2026-05-26 Listed $99,000 realMLS
- 2024-04-05 Rental Removed $1,250 NEFLMLS
- 2024-03-30 Price Changed $1,250 NEFLMLS
- 2024-03-08 Listed for Rent $1,300 NEFLMLS
- 2024-03-08 Rental Removed $1,300 BUILDIUM
- 2024-03-06 Price Changed $1,300 BUILDIUM
- 2024-02-14 Price Changed $1,350 BUILDIUM
- 2024-02-13 Listed for Rent $1,400 BUILDIUM
- 2024-01-11 Rental Removed $1,200 BUILDIUM
- 2024-01-04 Listed for Rent $1,200 BUILDIUM
- 2023-12-25 Rental Removed $1,200 BUILDIUM
- 2023-12-23 Rental Removed $1,200 NEFLMLS
- 2023-12-21 Listed for Rent $1,200 NEFLMLS
- 2023-11-28 Price Changed $1,200 BUILDIUM
- 2023-10-31 Listed for Rent $1,250 BUILDIUM
- 2018-04-06 Sold (Public Records) $49,500 Public Records
- 2005-10-31 Listing Removed — realMLS
- 2005-08-04 Sold (Public Records) $45,000 Public Records
- 2005-05-10 Listed $65,000 realMLS
- 2005-02-11 Listing Removed — realMLS
- 2004-08-11 Listed $65,000 realMLS
Property tax history
+9.8%/yrLatest (2025): $2,246 · +42.3% YoY. Source: county tax records.
Cash-flow waterfall
monthlySold comps — $/sqft
last 12 mo · ≤1 miLoading sold comps…