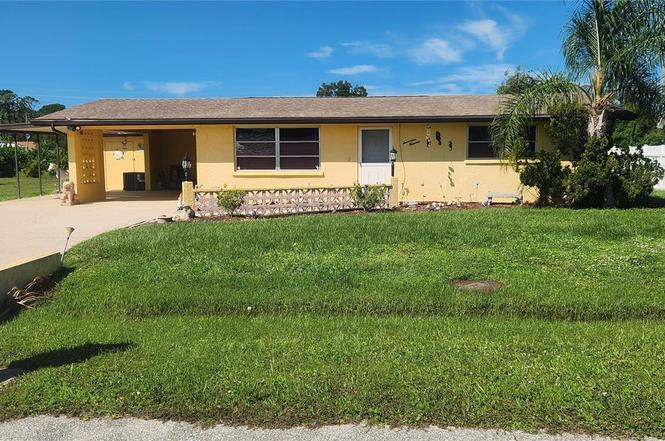
1700 Morning Dove Ln · Englewood, FL
Flood risk 8/10 · Major
- FEMA flood zone
- AE
- Chance of flooding over 30 yrs
- 0.99%
- Est. flood insurance / yr
- $1,737 – $8,500
Fire risk 3/10 · Minor
- Est. fire insurance / yr
- $947 – $1,759
Heat risk 10/10 · Severe
- Hot days now (above 107°F)
- 7 days/yr
- Hot days in 30 yrs
- 29 days/yr
Wind risk 10/10 · Severe
- Chance of severe wind over 30 yrs
- 99.0%
Air-quality risk 2/10 · Minimal
- Unhealthy air days now
- 1 days/yr
- Unhealthy air days in 30 yrs
- 1 days/yr
Risk factors via First Street. Map © Google.
Why this score? — see what drove the B grade
The composite is a weighted blend of 9 inputs, each scored 0–100. Each bar is that input's sub-score; the figure is the points it added to the 100-point composite (weight × sub-score).
- Cash flow +27.4/30.0
- ARV discount +15.0/15.0
- DSCR +9.6/10.0
- 1% rule +7.5/10.0
- Schools +4.6/10.0
- Livability +3.7/5.0
- Rent growth +2.5/5.0
- Condition / age +2.5/5.0
- Appreciation +0.0/10.0
$199,900
🖨 Deal sheet (PDF) 📄 Offer letter ✓ Due diligence
Listing remarks
Wonderful opportunity to own your own little slice of Paradise. This home is conveniently situated near the heart of Englewood, in close proximity to beautiful Beaches, numerous golf courses, and world class fishing. From the double car port, with attached storage shed, you can walk right into the utility room containing the washer/dryer, hot water heater, and half bath. The dining room has a unique under the sea wall with vibrant colorful fish, while the backyard contains a pond for real fish as well a a putting green. This home also boasts a 326 sq. ft buildable concrete pad WITH FOOTERS. Come take a look today before its SOLD!
Key facts
- Putting green
- 9,520 sq ft lot
- 2 parking spots
Tags
Property features AI
Finance
- Other: Property type: Single Family Residence; Total living area listed as approximately 1,327 (estimated); Building area listed as approximately 1,931 (public records)
- HOA & community: No HOA association indicated; Pets allowed
Exterior
- Parking: Carport with space for 2 vehicles
- Utilities: Public water; Public sewer; Electricity connected
- Home design: Single-family home; One story; Faces east; Residential zoning (RSF5)
- Construction: Block and stucco construction; Shingle roof; Slab foundation; Built on a 0.22-acre (approx. 85 x 112) lot
- Exterior features: Covered and screened patio/porch; Exterior lighting
Interior
- Kitchen: Range; Microwave; Refrigerator; Electric water heater
- Bedrooms: 2 bedrooms
- Flooring: Ceramic tile; Laminate
- Bathrooms: 1 full bathroom
- Heating & cooling: Central heating; Central air conditioning
- Interior features: Ceiling fans; Inside utility/additional room
- Laundry & utility: Washer; Dryer; Laundry inside
Neighborhood map
What this means for you Summary
Snapshot
- This is a 2-bed/1.0-bath single-family listed at $200k.
Deal economics
- At list price, monthly cash flow is $159 ($2k/yr) — positive.
- The deal already cash-flows at list — no discount required.
- Meets the 1% rule at list price ($3k rent vs $200k).
- Recommended offer: $176k (12.0% below list) — sets the bar for market timing.
- Cap rate 9.8% vs local median 3.8% in Englewood — top-decile yield for the area; either an underpriced asset or a hidden risk that comps aren't pricing in. Stress-test before assuming the spread holds.
Location & tenants
- Location reads 73/100 on livability (#321 in FL) — a middle-class / working-renter tenant base. Strengths: housing A+, cost of living A, health & safety A; Watch: employment C-, amenities F, commute F.
- Charlotte (suburban): math 54% / reading 54% proficiency, ranked #22 of 73 in FL (top 30%) — acceptable for families but not a draw, mixed tenant base, ~2y average lease.
- Zoned schools: Vineland Elementary School (math 74% / reading 67%, grade A-, #333 of 2,144 statewide, top 16%, 579 students, 45% FRL); L. A. Ainger Middle School (math 65% / reading 53%, grade B, #144 of 571 statewide, top 26%, 720 students, 40% FRL); Lemon Bay High School (math 50% / reading 56%, grade C-, #148 of 667 statewide, top 23%, 1,360 students, 28% FRL) — zoned schools average 38% FRL vs 54% district-wide (16 pts lower); this property's tenant base skews higher-income than the district average.
- Market conditions: Rents soft (-0.1%/yr); 737 active listings in the ZIP; 17 comparable units currently listed for rent nearby; rentals at typical pace (median 23d on market — plan ~3-4 weeks tenant-placement turnaround); 4,585 units permitted in Charlotte County in 2024 (703 in 5+ unit buildings).
- At $2,501/mo this rent would consume 52% of the median local household income ($57k/yr) (locally 329% of renters already pay >50% of income on rent) — very limited rent-growth headroom before tenants either downsize or default.
Forward outlook
- Local home prices are declining (-3.0%/yr); year-one equity from $1k of loan paydown is wiped out by about $6k of value loss. Plan a longer hold.
- Charlotte County population projected at +24% by 2050 — long-run rental-demand tailwind backs the buy-and-hold thesis.
Negotiation context
- It's been on market 603 days — a 12% lower offer ($176k) is reasonable based on typical stale-listing flexibility.
- 3 sale attempts since 2y ago; this cycle's ask has dropped $50k (20%) from the opening price — seller is motivated, your offer sets the floor, not the list.
Risks & watch-outs
- Watch-outs: flood insurance adds $427/mo.
- Climate carrying-cost: in FEMA flood zone AE (mandatory federal flood insurance); severe wind risk, 99% chance of damaging wind over 30y; extreme-heat days projected 7→29/yr by 2055 (HVAC capex compounding) — expect insurance premiums to compound above CPI over the hold.
Questions for the listing agent
- It's been on market 603 days. Have you received any prior offers? Is the seller open to a 12% concession, seller financing, or rate buy-down credit?
- Built in 1970 — when were the roof, HVAC, electrical panel, plumbing, and water heater last replaced?
- What's the actual annual flood-insurance premium (NFIP or private), and is the property in a SFHA with mandatory coverage?
- Why hasn't it sold? Are there any deal-killer items the seller is aware of (foundation, flood, title, zoning, code violations)?
- Is there a deadline driving the sale (1031 exchange, divorce, estate, relocation)? That informs how much negotiation room exists.
- Schools are A-rated — typically a magnet for longer-tenancy family renters. What's the average tenant stay here, and is there a school-zone premium baked into asking?
- What's the average days-on-market for RENTAL listings here right now (not sales)? A rising rental-DOM trend means longer vacancies and softer asking-rent achievability than the comps imply.
- What's the recent tenant-quality profile in this submarket — average credit score on applications, eviction rate, late-payment / NSF rate, and stable-employment percentage? A property-management company in the area should have these aggregated.
- How much new for-sale + rental construction is in the pipeline within 1–3 miles? Heavy new supply typically softens prices + rents 12–24 months out; constrained supply supports both.
Investment metrics
- 1% rule
- 1.25% ✓
- Cap rate
- 9.81%
- Cash-on-cash
- 12.56%
- DSCR
- 1.56
- GRM
- 6.7
CMA / ARV
- ARV (on-the-fly)
- $278,208
- Comps found
- 4
Show comp detail 4 sales within ~0.75 mi
| Address | Dist | Beds/Ba | Sqft | Sold | Price | $/sf | Match |
|---|---|---|---|---|---|---|---|
| 1785 Morning Dove Ln | 0.08mi | 2/2.0 | 996 (-10%) | 11mo | $188,000 | $189 | 66 |
| 1725 Blue Bird Ln | 0.13mi | 2/2.0 | 1,238 (+12%) | 6mo | $215,000 | $174 | 65 |
| 1224 Lincoln Dr | 0.43mi | 2/2.0 | 1,053 (-5%) | 7mo | $265,000 | $252 | 62 |
| 1060 Haste Ln | 0.47mi | 2/2.0 | 1,212 (+10%) | 10mo | $325,000 | $268 | 49 |
Match score weights: distance 35% · size 25% · config 20% · recency 20%. Top-matched comps best support the ARV.
Projected returns pro-forma
-3.0% appreciation · 0.0% rent growth · sell at horizon
- IRR
- -15.2%
- Equity multiple
- 0.48×
- Total profit
- $-29,278
- Equity at exit
- $29,806
- IRR
- -15.1%
- Equity multiple
- 0.29×
- Total profit
- $-39,523
- Equity at exit
- $17,284
Cash invested: $55,972 (down + closing). Projections, not guarantees.
Landlord ↔ Tenant lean methodology
- Overall (STATE)
- 87 Strongly Landlord-Friendly
- State Florida
- 87 Strongly Landlord-Friendly · R+3
- County
- — inherits STATE
- City
- — inherits STATE
ZIP-level market 34224
- Home prices YoY
- -18.9%
- Rents YoY
- -0.1%
- Active inventory
- 737
- Price-to-rent
- 6.7×
Monthly cashflow live
- Estimated rent
- $2,501 high interval (Pro) →
- Mortgage (P&I)
- −$1,048
- Tax from tax record
- −$258 /mo · $3,099/yr
- Insurance
- −$83
- Flood insurance flood zone
- −$427 /mo · $5,118/yr
- HOA
- −$0
- Vacancy / Maint / Mgmt
- −$525
- Net cashflow
- $159
Break-even live
Sensitivity live
| Price | -10% $272 | -5% $216 | +0% $159 | +5% $103 | +10% $46 |
|---|---|---|---|---|---|
| Rent | -10% $-38 | -5% $60 | +0% $159 | +5% $258 | +10% $357 |
| Rate | -1.0pp $260 | -0.5pp $210 | base $159 | +0.5pp $107 | +1.0pp $55 |
UW: 25.0% down · 7.5% · 30yr · 1.5% tax · 5.0% vac · 8.0% maint · 8.0% mgmt
Financing live
Cash to close
- Down payment
- $49,975
- Closing costs
- $5,997
- Reserves months
- —
- Total cash needed
- —
Loan-product check · same deal, 3 products live
Conventional
25% down · 7.5% · 30yr
- Down + closing
- —
- Monthly P&I
- —
- Monthly cashflow
- —
- DSCR
- —
- Eligible?
- —
Personal DTI + credit; lowest rate.
DSCR
20% down · 8.5% · 30yr
- Down + closing
- —
- Monthly P&I
- —
- Monthly cashflow
- —
- DSCR
- —
- Eligible?
- —
No personal income docs; deal must DSCR.
Hard money
10% down · 12.0% · 12mo
- Down + closing
- —
- Monthly P&I
- —
- Monthly cashflow
- —
- DSCR
- —
- Eligible?
- —
Short-term bridge; refi at stabilization.
Rent comps 17 comps
| Address | Beds | Baths | Sqft | Rent | $/sqft | DOM | Units | Dist |
|---|---|---|---|---|---|---|---|---|
| 1604 Cardinal Ln Unit 1 Englewood, FL | 1.0 | 1.0 | 750 | $1,300 | $1.73 | 22d | 1 | 0.13mi |
| 2275 S McCall Rd #201 Englewood, FL | 2.0 | 2.0 | 1050 | $2,000 | $1.90 | 15d | 1 | 0.22mi |
| 2643 Lear Rd Englewood, FL | 2.0 | 2.0 | 1206 | $5,800 | $4.81 | 22d | 1 | 0.68mi |
| 1531 Placida Rd #203 Englewood, FL | 2.0 | 2.0 | 1056 | $3,900 | $3.69 | 22d | 1 | 0.70mi |
| 1531 Placida Rd #204 Englewood, FL | 2.0 | 2.0 | 1056 | $3,500 | $3.31 | 22d | 1 | 0.71mi |
| 1120 Lampp Dr Englewood, FL | 3.0 | 2.0 | 1212 | $4,000 | $3.30 | 22d | 1 | 0.75mi |
| 6699 San Casa Dr Englewood, FL | 2.0 | 2.0 | 1028 | $1,900 | $1.85 | 22d | 1 | 0.77mi |
| 6688 San Casa Dr Englewood, FL | 2.0 | 2.0 | 1143 | $1,600 | $1.40 | 22d | 1 | 0.89mi |
| 1960 Oregon Trl Unit 2A Englewood, FL | 2.0 | 2.0 | 1360 | $3,750 | $2.76 | 22d | 1 | 0.91mi |
| 858 E 7th St Englewood, FL | 3.0 | 2.0 | 1244 | $1,995 | $1.60 | 22d | 1 | 0.97mi |
| 1435 New Point Comfort Rd Unit B Englewood, FL | 1.0 | 1.0 | 744 | $1,520 | $2.04 | 22d | 1 | 1.04mi |
| 1970 Georgia Ave Englewood, FL | 3.0 | 2.0 | 1160 | $11,790 | $10.16 | 22d | 1 | 1.11mi |
| 1575 Loralin Dr Englewood, FL | 3.0 | 2.0 | 1322 | $5,000 | $3.78 | 22d | 1 | 1.16mi |
| 8363 Sago Ct Englewood, FL | 2.0 | 2.0 | 1360 | $1,950 | $1.43 | 22d | 1 | 1.30mi |
| 1210 S Maryknoll Rd Englewood, FL | 2.0 | 2.0 | 1063 | $2,600 | $2.45 | 22d | 1 | 1.33mi |
| 1401 S McCall Rd Unit 301A Englewood, FL | 2.0 | 2.0 | 1093 | $3,300 | $3.02 | 22d | 1 | 1.38mi |
| 1915 Pennsylvania Ave Englewood, FL | 2.0 | 2.0 | 1394 | $7,500 | $5.38 | 22d | 1 | 1.45mi |
Listing history 25 events
-
2026-06-22days on market $199,900 Active 603 DOM
-
2026-06-18days on market $199,900 Active 600 DOM
-
2026-06-17days on market $199,900 Active 599 DOM
-
2026-06-16days on market $199,900 Active 598 DOM
-
2026-06-15days on market $199,900 Active 597 DOM
-
2026-06-14days on market $199,900 Active 595 DOM
-
2026-06-13days on market $199,900 Active 594 DOM
-
2026-06-10days on market $199,900 Active 592 DOM
-
2026-06-09days on market $199,900 Active 591 DOM
-
2026-06-08days on market $199,900 Active 590 DOM
-
2026-06-05days on market $199,900 Active 586 DOM
-
2026-06-02days on market $199,900 Active 584 DOM
-
2026-06-01days on market $199,900 Active 583 DOM
-
2026-05-31days on market $199,900 Active 582 DOM
-
2026-05-30days on market $199,900 Active 581 DOM
-
2026-03-26price $199,900
-
2026-03-16price $200,000
-
2025-10-03price $220,000
-
2025-09-02status Active
-
2025-08-22status Pending
-
2025-02-21price $245,000
-
2024-10-15$250,000 Active
-
2024-04-16historical
-
2024-03-01price $245,000
-
2024-01-23$255,000 Active
ⓘ Source: listings_history table (triggers on properties + properties_extension) + one-shot
backfill from property_details.listing_events for pre-trigger history.
Tax reassessment forecast FL · Resets to sale price
- Current annual tax
- $3,099 · $258/mo
- Projected year-2 tax
- $3,099 · $258/mo
- Expected delta
- $0/yr ($0/mo · 0.0%)
ⓘ Screening estimate from a state-policy table — verify with the county assessor before closing.
Climate risk First Street
- Flood 8/10 Severe FEMA zone AE · 99% chance over 30 yrs
- Wildfire 3/10 Moderate
- Heat 10/10 Extreme 7 d/yr ≥107°F today · 29 d/yr by 30 yrs out
- Wind 10/10 Extreme 99% chance of damaging wind over 30 yrs
- Air quality 2/10 Low 1 unhealthy d/yr today · 1 by 30 yrs out
Nearby sold comps map
Loading sold comps map…
Walkable amenities ~0.75 mi
Loading nearby amenities…
Taxation est. · year 1
- Rental income
- $30,009
- − Mortgage interest
- −$11,198
- − Property taxes
- −$3,099
- − Insurance
- −$6,118
- − Repairs & maintenance
- −$2,401
- − Management
- −$2,401
- − Depreciation
- −$5,815
- Taxable loss
- −$1,023
- Est. tax savings @ 24.0%
- +$245
- After-tax cash flow
- $2,156/yr
For passive investors: Depreciation is non-cash, so a rental often shows a tax loss while cash-flowing — sheltering income. Rental losses are passive: they offset passive income freely, and up to $25,000/yr can offset ordinary (W-2) income if you actively participate and your MAGI is under $100k (phasing out to $0 by $150k); unused losses carry forward. On sale, claimed depreciation is recaptured at up to 25%, and gains may owe capital-gains tax (a 1031 exchange can defer both). Figures are a year-1 estimate at your 24.0% rate — not tax advice; consult a CPA.
Schools (NCES district)
- District
- Charlotte
- NCES district ID
- 1200240
- Math proficiency
- 54% ▼ -6.00%
- Reading proficiency
- 54% ▼ -1.00%
- Median HH income
- $44,864
- Composite
- 45.62/100
- National rank
- #2586
- State rank
- #22 of 73 in FL
Livability — Englewood
- Score
- 73/100
- State rank
- #321
- US rank
- #5655
Category grades
Schools grade is shown separately in the Schools card above.
Census & demographics
- Census place
- Englewood, FL
- County
- Charlotte County · 196,994 people
- City population
- 35,420
- Metro
- Punta Gorda, FL
- Population (ZIP)
- 15,536
- Household income
- $57,281
- Rent vs Own
- Severe rent burden
- 329.0
Population outlook (Charlotte County) Hauer SSP2
- Today (2025)
- 198,646 people
- By 2030
- 210,507 · +6.0%
- By 2040
- 230,857 · +16.2%
- By 2050
- 247,148 · +24.4%
- By 2075
- 281,777 · +41.8%
- By 2100
- 293,609 · +47.8%
Race, ethnicity, and origin ACS 2023
- Neighborhood character
- Predominantly White (92%)
- Race & ethnicity
- White 92% Two or more races 5% Hispanic / Latino 3% Asian 1%
- Common ancestry
- Romanian 4% Slovak 4% Lithuanian 4%
- Foreign-born
- 9% · Canada
- Languages at home
- 92% English-only · Other Indo-European 2% Spanish 2% German/W. Germanic 1%
Political lean MEDSL · Charlotte
- 2024 margin
- Solid R (+34.0) · D 32.7% · R 66.7%
- 2008→2024 swing
- -26.7pp toward R · 2008: -7.2pp · 2024: -34.0pp
- All cycles
- 2024: R+34.0 2020: R+26.6 2016: R+27.8 2012: R+14.3 2008: R+7.2
Not yet ingested
- Civics
- —
Market trends
- HPI YoY
- ▼ -75.76%
- Current HPI
- 325.0345
- Rent YoY
- ▼ -0.11%
- Metro
- Punta Gorda, FL
- State GDP YoY
- ▲ 3.28%
- F500 in state
- 36
Industry mix (Fortune 500 HQ in FL)
| Industry | F500 HQs | Revenue |
|---|---|---|
| Industrial Technology | 2 | $29B |
|
||
| Insurance | 2 | $17B |
|
||
| Retail | 1 | $60B |
|
||
| Technology Distribution | 1 | $58B |
|
||
| Homebuilding | 1 | $35B |
|
||
| Technology Manufacturing | 1 | $35B |
|
||
Price history
-21.6% since first listed10 events — show timeline
- 2026-03-26 Price Changed $199,900 Stellar MLS as Distributed by MLS Grid
- 2026-03-16 Price Changed $200,000 Stellar MLS as Distributed by MLS Grid
- 2025-10-03 Price Changed $220,000 Stellar MLS as Distributed by MLS Grid
- 2025-09-02 Relisted — Stellar MLS as Distributed by MLS Grid
- 2025-08-22 Pending — Stellar MLS as Distributed by MLS Grid
- 2025-02-21 Price Changed $245,000 Stellar MLS as Distributed by MLS Grid
- 2024-10-15 Listed $250,000 Stellar MLS as Distributed by MLS Grid
- 2024-04-16 Listing Removed — Stellar MLS as Distributed by MLS Grid
- 2024-03-01 Price Changed $245,000 Stellar MLS as Distributed by MLS Grid
- 2024-01-23 Listed $255,000 Stellar MLS as Distributed by MLS Grid
Property tax history
+8.2%/yrLatest (2025): $3,099 · -3.8% YoY. Source: county tax records.
Cash-flow waterfall
monthlySold comps — $/sqft
last 12 mo · ≤1 miLoading sold comps…