 Multi-family
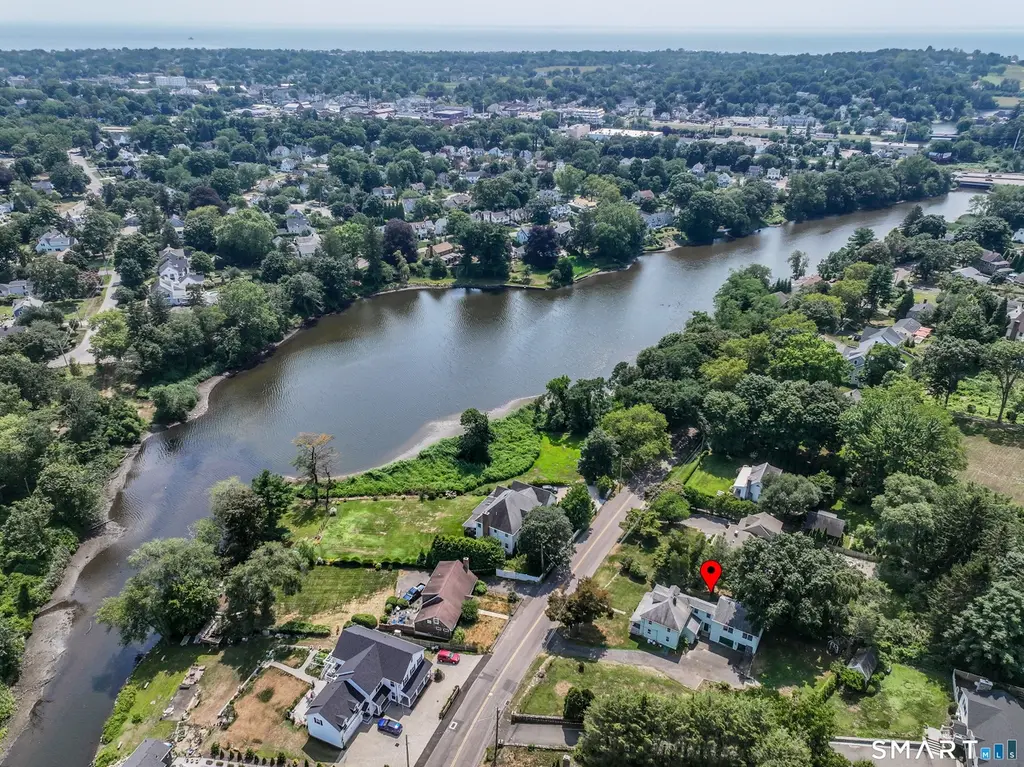
647 Bronson Rd · Mill Plain, CT
Flood risk 1/10 · Minimal
- FEMA flood zone
- X (unshaded)
- Chance of flooding over 30 yrs
- 0.0%
- Est. flood insurance / yr
- $507 – $1,088
Fire risk 1/10 · Minimal
- Est. fire insurance / yr
- $829 – $1,539
Heat risk 5/10 · Moderate
- Hot days now (above 98°F)
- 7 days/yr
- Hot days in 30 yrs
- 15 days/yr
Wind risk 6/10 · Moderate
- Chance of severe wind over 30 yrs
- 69.0%
Air-quality risk 8/10 · Major
- Unhealthy air days now
- 13 days/yr
- Unhealthy air days in 30 yrs
- 18 days/yr
Risk factors via First Street. Map © Google.
Why this score? — see what drove the D grade
The composite is a weighted blend of 9 inputs, each scored 0–100. Each bar is that input's sub-score; the figure is the points it added to the 100-point composite (weight × sub-score).
- Cash flow +12.9/30.0
- ARV discount +7.5/15.0
- Schools +6.3/10.0
- DSCR +3.9/10.0
- 1% rule +3.5/10.0
- Rent growth +2.5/5.0
- Livability +2.5/5.0
- Condition / age +2.5/5.0
- Appreciation +0.0/10.0
$899,000
🖨 Deal sheet 📄 Offer letter ✓ Due diligence
Multi-family units
County records classify this as Multi-Family (2-4 Unit). Listing-text estimate: 1 unit. estimate disagrees with records
Listing remarks
First Time on the Market - A Southport Treasure with Endless Possibilities For the first time since 1912, this cherished Southport residence is being offered for sale. Passed down through generations, this classic colonial has been a cornerstone of one family's legacy for over a century - and now it's ready for its next chapter. Set on nearly a half-acre in the heart of Southport, this property offers tranquil water views, timeless charm, and unmatched potential. Originally a four-bedroom single-family home, a thoughtfully designed in-law suite with its own private entrance, separate mechanicals, and utilities was added in 1991 - ideal for multi-generational living, guests, or rental income
Key facts
- 0.41 acre lot
- Built 1913
- Listed 4 days
Property features AI
Exterior
- Utilities: Public water connected; Public sewer connected; Oil hot water (tank located in basement)
- Home design: Single-family home
- Construction: Built with frame construction; Vinyl siding; Concrete foundation; Asphalt shingle roof; Pale green exterior color
- Exterior features: Deck; Garden area; Water view; Beach rights; Walkable to the water
Interior
- Kitchen: Electric range; Refrigerator; Dishwasher
- Bedrooms: 4 bedrooms
- Bathrooms: 2 full bathrooms; 1 half bathroom
- Heating & cooling: Steam heat (oil-fired); Ceiling fans; Window air conditioning units
- Interior features: 8 total rooms; Bonus room; Full unfinished basement; Attic with pull-down stairs; In-law apartment with separate second-floor entry
- Laundry & utility: Laundry on main level
Neighborhood map
What this means for you Summary
Snapshot
- This is a 4-bed/2.5-bath multifamily listed at $899k.
Deal economics
- At list price, monthly cash flow is $-60 ($-726/yr) — negative.
- To cash-flow at today's rent, offer at most $888k (1.2% below list).
- To meet the 1% rule (rent ≥ 1% of price), the offer needs to be $765k (14.9% below list).
- Recommended offer: $765k (14.9% below list) — sets the bar for 1% rule.
Location & tenants
- Location reads: area grade D — affects rentability + tenant quality, not the cash-flow math above.
- Fairfield School District (suburban): math 61% / reading 72% proficiency, ranked #21 of 153 in CT (top 14%) — acceptable for families but not a draw, mixed tenant base, ~2y average lease; only 7% free/reduced lunch — higher-income household profile.
- Zoned schools: Mill Hill School (math 67% / reading 77%, grade A-, #62 of 553 statewide, top 13%, 404 students, 10% FRL); Fairfield Ludlowe High School (math 69% / reading 85%, grade A-, #9 of 194 statewide, top 4%, 1,498 students, 15% FRL).
- Market conditions: 28 active listings in the ZIP; 11 comparable units currently listed for rent nearby; rentals at typical pace (median 24d on market — plan ~3-4 weeks tenant-placement turnaround); 852 units permitted in Greater Bridgeport Planning Region in 2024 (698 in 5+ unit buildings).
Forward outlook
- Local home prices are declining (-3.0%/yr); year-one equity from $6k of loan paydown is wiped out by about $27k of value loss. Plan a longer hold.
Negotiation context
- Only 4 days on market — expect competitive offers; lowballing is unlikely to land.
- 5 sale attempts with the ask held roughly flat each time — persistent listings suggest the price (not the market) is what's stuck; bring a comps-based counter.
Risks & watch-outs
- Watch-outs: built in 1913 — expect roof / HVAC / electrical / plumbing capex.
- Climate carrying-cost: major wind risk, 69% chance of damaging wind over 30y; extreme-heat days projected 7→15/yr by 2055 (HVAC capex compounding) — expect insurance premiums to compound above CPI over the hold.
Questions for the listing agent
- What do current leases actually rent for vs. the listed asking? Can we see a recent rent roll and the last 12 months of T-12 income?
- Built in 1913 — when were the roof, HVAC, electrical panel, plumbing, and water heater last replaced?
- Is there a deadline driving the sale (1031 exchange, divorce, estate, relocation)? That informs how much negotiation room exists.
- The area grade is low — what's the realistic commute time and amenity access for the typical tenant pool here? Any planned neighborhood developments (good or bad) we should know about?
- What's the average days-on-market for RENTAL listings here right now (not sales)? A rising rental-DOM trend means longer vacancies and softer asking-rent achievability than the comps imply.
- What's the recent tenant-quality profile in this submarket — average credit score on applications, eviction rate, late-payment / NSF rate, and stable-employment percentage? A property-management company in the area should have these aggregated.
- How much new apartment / multifamily construction is in the pipeline within 1–3 miles? Heavy new supply (>2% of stock underway) typically softens rents 12–24 months out; light construction supports rent growth.
Investment metrics
- 1% rule
- 0.85% ✗
- Cap rate
- 6.21%
- Cash-on-cash
- -0.29%
- DSCR
- 0.99
- GRM
- 9.8
CMA / ARV
No comps found within radius.
Projected returns pro-forma
-3.0% appreciation · 3.0% rent growth · sell at horizon
- IRR
- -16.8%
- Equity multiple
- 0.41×
- Total profit
- $-149,481
- Equity at exit
- $134,044
- IRR
- -8.6%
- Equity multiple
- 0.46×
- Total profit
- $-134,934
- Equity at exit
- $77,729
Cash invested: $251,720 (down + closing). Projections, not guarantees.
Landlord ↔ Tenant lean methodology
- Overall (STATE)
- 27 Tenant-Leaning
- State Connecticut
- 27 Tenant-Leaning · D+7
- County
- — inherits STATE
- City
- — inherits STATE
ZIP-level market 06890
- Active inventory
- 28
- Price-to-rent
- 9.8×
Monthly cashflow live
- Estimated rent
- $7,646 high interval (Pro) →
- Mortgage (P&I)
- −$4,714
- Tax from tax record
- −$1,012 /mo · $12,143/yr
- Insurance
- −$375
- HOA
- −$0
- Vacancy / Maint / Mgmt
- −$1,606
- Net cashflow
- $-60
Break-even live
UW: 25.0% down · 7.5% · 30yr · 1.5% tax · 5.0% vac · 8.0% maint · 8.0% mgmt
Financing live
Cash to close
- Down payment
- $224,750
- Closing costs
- $26,970
- Reserves months
- —
- Total cash needed
- —
Loan-product check · same deal, 3 products live
Conventional
25% down · 7.5% · 30yr
- Down + closing
- —
- Monthly P&I
- —
- Monthly cashflow
- —
- DSCR
- —
- Eligible?
- —
Personal DTI + credit; lowest rate.
DSCR
20% down · 8.5% · 30yr
- Down + closing
- —
- Monthly P&I
- —
- Monthly cashflow
- —
- DSCR
- —
- Eligible?
- —
No personal income docs; deal must DSCR.
Hard money
10% down · 12.0% · 12mo
- Down + closing
- —
- Monthly P&I
- —
- Monthly cashflow
- —
- DSCR
- —
- Eligible?
- —
Short-term bridge; refi at stabilization.
Rent comps 11 comps
| Address | Beds | Baths | Sqft | Rent | $/sqft | DOM | Units | Dist |
|---|---|---|---|---|---|---|---|---|
| 20 Chelsea St Fairfield, CT | 4.0 | 2.5 | 2518 | $7,500 | $2.98 | 43d | 1 | 0.25mi |
| 798 Mill Plain Rd Fairfield, CT | 3.0 | 1.5 | 1894 | $6,000 | $3.17 | 23d | 1 | 0.47mi |
| 860 Oldfield Rd Fairfield, CT | 3.0 | 2.5 | 2150 | $6,000 | $2.79 | 43d | 1 | 1.08mi |
| 1005 Old Post Rd Fairfield, CT | 4.0 | 2.5 | 3474 | $24,500 | $7.05 | 14d | 1 | 1.11mi |
| 46 Parkway Fairfield, CT | 3.0 | 2.0 | 1831 | $5,450 | $2.98 | 14d | 1 | 1.11mi |
| 254 Sherwood Farm Rd Fairfield, CT | 4.0 | 4.5 | 3570 | $12,500 | $3.50 | 10d | 1 | 1.24mi |
| 146 Oxford Rd Southport, CT | 3.0 | 2.5 | 2896 | $8,850 | $3.06 | 14d | 1 | 1.37mi |
| 146 Oxford Rd Southport, CT | 3.0 | 2.5 | 1792 | $8,850 | $4.94 | 2d | 1 | 1.37mi |
| 447 Reef Rd Fairfield, CT | 3.0 | 2.5 | 1972 | $8,000 | $4.06 | 43d | 1 | 1.37mi |
| 1975 Mill Plain Rd Fairfield, CT | 3.0 | 2.0 | 2144 | $5,950 | $2.78 | 43d | 1 | 1.39mi |
| 510 Reef Rd Fairfield, CT | 3.0 | 1.5 | 1908 | $12,000 | $6.29 | 23d | 1 | 1.43mi |
Listing history 15 events
-
2026-04-30status Under Contract
-
2026-04-27$899,000 Active
-
2026-04-20historical $899,000
-
2026-04-10historical
-
2026-04-10historical
-
2025-10-13historical Under Contract - Continue to Show
-
2025-10-13historical Under Contract - Continue to Show
-
2025-09-26historical
-
2025-09-26historical
-
2025-09-26$950,000 Active
-
2025-09-26$950,000 Active
-
2025-07-31$1,000,000 Active
-
2025-07-31$1,000,000 Active
-
2025-07-25historical
-
2025-07-25historical
ⓘ Source: listings_history table (triggers on properties + properties_extension) + one-shot
backfill from property_details.listing_events for pre-trigger history.
Tax reassessment forecast CT · Partial reset (capped growth)
- Current annual tax
- $12,143 · $1,012/mo
- Projected year-2 tax
- $15,691 · $1,308/mo
- Expected delta
- +$3,548/yr (+$296/mo · 29.2%)
ⓘ Screening estimate from a state-policy table — verify with the county assessor before closing.
Climate risk First Street
- Flood 1/10 Low FEMA zone X (unshaded) · 0% chance over 30 yrs
- Wildfire 1/10 Low
- Heat 5/10 Major 7 d/yr ≥98°F today · 15 d/yr by 30 yrs out
- Wind 6/10 Major 69% chance of damaging wind over 30 yrs
- Air quality 8/10 Severe 13 unhealthy d/yr today · 18 by 30 yrs out
Nearby sold comps map
Loading sold comps map…
Walkable amenities ~0.75 mi
Loading nearby amenities…
Taxation est. · year 1
- Rental income
- $91,754
- − Mortgage interest
- −$50,358
- − Property taxes
- −$12,143
- − Insurance
- −$4,495
- − Repairs & maintenance
- −$7,340
- − Management
- −$7,340
- − Depreciation
- −$26,153
- Taxable loss
- −$16,075
- Est. tax savings @ 24.0%
- +$3,858
- After-tax cash flow
- $3,132/yr
For passive investors: Depreciation is non-cash, so a rental often shows a tax loss while cash-flowing — sheltering income. Rental losses are passive: they offset passive income freely, and up to $25,000/yr can offset ordinary (W-2) income if you actively participate and your MAGI is under $100k (phasing out to $0 by $150k); unused losses carry forward. On sale, claimed depreciation is recaptured at up to 25%, and gains may owe capital-gains tax (a 1031 exchange can defer both). Figures are a year-1 estimate at your 24.0% rate — not tax advice; consult a CPA.
Schools (NCES district)
- District
- Fairfield School District
- NCES district ID
- 0901530
- Math proficiency
- 61% ▼ -10.00%
- Reading proficiency
- 72% ▼ -7.00%
- Median HH income
- $119,139
- Composite
- 63.03/100
- National rank
- #650
- State rank
- #21 of 153 in CT
Livability — Mill Plain
No livability data for this city. (Only ~50 U.S. cities are tracked.)
Census & demographics
- Population (ZIP)
- 4,566
Population outlook (Greater Bridgeport County) Hauer SSP2
- By 2040
- 365,581
Race, ethnicity, and origin ACS 2023
- Neighborhood character
- Predominantly White (89%)
- Race & ethnicity
- White 89% Asian 5% Two or more races 5% Hispanic / Latino 4%
- Common ancestry
- Romanian 6% Slovak 5% Lithuanian 2%
- Foreign-born
- 8% · Canada, Dominican Republic
- Languages at home
- 90% English-only · Other Indo-European 5% Spanish 3% Russian/Polish/Slavic 1%
Political lean MEDSL · Greater Bridgeport
- 2024 margin
- Strong D (+23.3) · D 60.9% · R 37.6% · Other 1.5%
- All cycles
- 2024: D+23.3
Not yet ingested
- Civics
- —
Market trends
- HPI YoY
- ▼ -103.54%
- Current HPI
- 188.7723
- Rent YoY
- —
- Metro
- —
- State GDP YoY
- ▲ 1.06%
- F500 in state
- 38
Industry mix (Fortune 500 HQ in CT)
| Industry | F500 HQs | Revenue |
|---|---|---|
| Industrial Machinery | 4 | $38B |
|
||
| Insurance | 3 | $71B |
|
||
| Financial Services | 2 | $25B |
|
||
| Transportation / Logistics | 2 | $18B |
|
||
| Healthcare | 1 | $247B |
|
||
| Telecommunications | 1 | $55B |
|
||
Price history
-10.1% since first listed15 events — show timeline
- 2026-04-30 Pending — Smart MLS
- 2026-04-27 Listed $899,000 Smart MLS
- 2026-04-20 Coming Soon $899,000 Smart MLS
- 2026-04-10 Listing Removed — Smart MLS
- 2026-04-10 Listing Removed — Smart MLS
- 2025-10-13 Contingent — Smart MLS
- 2025-10-13 Contingent — Smart MLS
- 2025-09-26 Listing Removed — Smart MLS
- 2025-09-26 Listing Removed — Smart MLS
- 2025-09-26 Listed $950,000 Smart MLS
- 2025-09-26 Listed $950,000 Smart MLS
- 2025-07-31 Listed $1,000,000 Smart MLS
- 2025-07-31 Listed $1,000,000 Smart MLS
- 2025-07-25 Coming Soon — Smart MLS
- 2025-07-25 Coming Soon — Smart MLS
Property tax history
+1.0%/yrLatest (2023): $12,143 · +1.0% YoY. Source: county tax records.
Cash-flow waterfall
monthlySold comps — $/sqft
last 12 mo · ≤1 miLoading sold comps…