 🔨 Auction
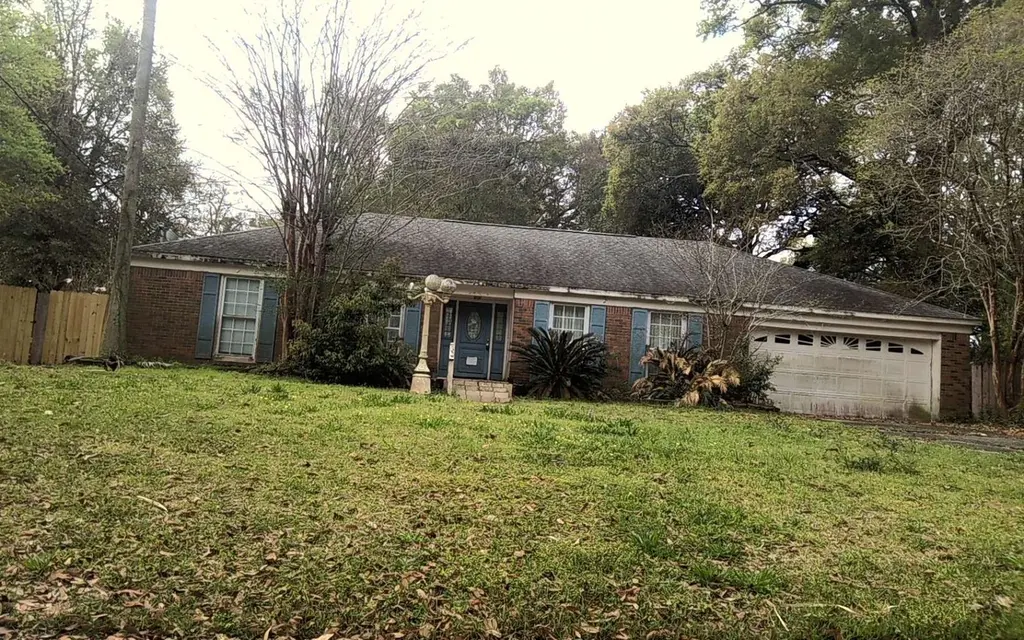
1076 Candlewood Cir · Ferry Pass, FL
Flood risk 1/10 · Minimal
- FEMA flood zone
- X (unshaded)
- Chance of flooding over 30 yrs
- 0.0%
- Est. flood insurance / yr
- $507 – $1,088
Fire risk 1/10 · Minimal
- Est. fire insurance / yr
- $947 – $1,759
Heat risk 10/10 · Severe
- Hot days now (above 106°F)
- 7 days/yr
- Hot days in 30 yrs
- 23 days/yr
Wind risk 9/10 · Severe
- Chance of severe wind over 30 yrs
- 99.0%
Air-quality risk 1/10 · Minimal
- Unhealthy air days now
- 0 days/yr
- Unhealthy air days in 30 yrs
- 0 days/yr
Risk factors via First Street. Map © Google.
Why this score? — see what drove the F grade
The composite is a weighted blend of 9 inputs, each scored 0–100. Each bar is that input's sub-score; the figure is the points it added to the 100-point composite (weight × sub-score).
- ARV discount +7.5/15.0
- Cash flow +5.4/30.0
- Schools +3.6/10.0
- Livability +3.2/5.0
- Rent growth +2.7/5.0
- Condition / age +2.5/5.0
- 1% rule +1.0/10.0
- DSCR +0.0/10.0
- Appreciation +0.0/10.0
$5,000
🖨 Deal sheet 📄 Offer letter ✓ Due diligence
Listing remarks
Foreclosure Auction Ends June 19, 2026 at 12:00 PM EST. Explore this charming 3-bedroom, 2-bath residence set in a peaceful and well-located Pensacola community. The list price is the opening bid for the online auction. Sold As-is. Explore more details and submit your bid through Federa.
Key facts
- 2 garage spots
- Listed 7 days
Property features AI
Exterior
- Parking: 2-car garage
- Home design: Residential property
- Exterior features: Lot approximately 0.28 acres; Zoned MDR (Medium Density Residential)
Interior
- Bathrooms: 2 full bathrooms
- Interior features: Single-story layout
Neighborhood map
What this means for you Summary
Snapshot
- This is a 3-bed/2.0-bath single-family listed at $5k.
Deal economics
- At list price, monthly cash flow is $-656 ($-8k/yr) — negative.
- The deal already cash-flows at list — no discount required.
- Meets the 1% rule at list price ($2k rent vs $5k).
Location & tenants
- Location reads 65/100 on livability (#664 in FL) — a middle-class / working-renter tenant base. Strengths: cost of living A+, housing A+; Watch: employment C-, schools D, amenities F.
- Escambia (suburban): math 40% / reading 45% proficiency, ranked #56 of 73 in FL (top 77%) — families likely to look elsewhere, expect single-tenant / working-renter base with shorter leases.
- Market conditions: Rents flat; 221 active listings in the ZIP; 18 comparable units currently listed for rent nearby; rentals at typical pace (median 23d on market — plan ~3-4 weeks tenant-placement turnaround); 1,479 units permitted in Escambia County in 2024 (0 in 5+ unit buildings).
- This rent runs 32% of the median local income ($67k/yr) — at the standard rent-burdened threshold; future hikes will face affordability resistance.
Forward outlook
- Local home prices are declining (-3.0%/yr); year-one equity from $2k of loan paydown is wiped out by about $9k of value loss. Plan a longer hold.
- Escambia County population projected at +13% by 2050 — modest demand growth; plan on rents tracking national, not racing it.
Negotiation context
- Only 7 days on market — expect competitive offers; lowballing is unlikely to land.
Risks & watch-outs
- Watch-outs: property tax is 90.1% of price.
- Climate carrying-cost: severe wind risk, 99% chance of damaging wind over 30y; extreme-heat days projected 7→23/yr by 2055 (HVAC capex compounding) — expect insurance premiums to compound above CPI over the hold.
Questions for the listing agent
- What do current leases actually rent for vs. the listed asking? Can we see a recent rent roll and the last 12 months of T-12 income?
- Built in 1968 — when were the roof, HVAC, electrical panel, plumbing, and water heater last replaced?
- Property tax is high relative to price — has the assessment been appealed recently, and will the sale trigger a re-assessment?
- Is there a deadline driving the sale (1031 exchange, divorce, estate, relocation)? That informs how much negotiation room exists.
- Schools are D-rated, which usually means shorter tenancies and higher turnover. Who's the typical renter profile here, and what's been the actual vacancy rate?
- The area grade is low — what's the realistic commute time and amenity access for the typical tenant pool here? Any planned neighborhood developments (good or bad) we should know about?
- What's the average days-on-market for RENTAL listings here right now (not sales)? A rising rental-DOM trend means longer vacancies and softer asking-rent achievability than the comps imply.
- What's the recent tenant-quality profile in this submarket — average credit score on applications, eviction rate, late-payment / NSF rate, and stable-employment percentage? A property-management company in the area should have these aggregated.
- How much new for-sale + rental construction is in the pipeline within 1–3 miles? Heavy new supply typically softens prices + rents 12–24 months out; constrained supply supports both.
Investment metrics
- 1% rule
- 0.60% ✗
- Cap rate
- 3.67%
- Cash-on-cash
- -9.35%
- DSCR
- 0.58
- GRM
- 13.9
CMA / ARV
- ARV (on-the-fly)
- $300,472
- Comps found
- 12
Show comp detail 12 sales within ~0.75 mi
| Address | Dist | Beds/Ba | Sqft | Sold | Price | $/sf | Match |
|---|---|---|---|---|---|---|---|
| 652 Mozingo Ln | 0.49mi | 3/2.0 | 1,626 (-0%) | 6mo | $293,000 | $180 | 72 |
| 1001 Stillbrook Rd | 0.30mi | 3/2.0 | 1,808 (+11%) | 1mo | $339,000 | $188 | 67 |
| 754 Mozingo Ln | 0.51mi | 3/2.0 | 1,660 (+2%) | 7mo | $354,000 | $213 | 67 |
| 1032 Peakview Dr | 0.46mi | 3/2.0 | 1,584 (-3%) | 8mo | $280,500 | $177 | 67 |
| 8715 Norstum Dr | 0.57mi | 3/2.0 | 1,566 (-4%) | 5mo | $270,000 | $172 | 62 |
| 9542 Hummingbird Blvd | 0.64mi | 4/2.0 (+1) | 1,680 (+3%) | 2mo | $339,000 | $202 | 59 |
| 10045 Foxrun Rd | 0.55mi | 3/2.0 | 1,492 (-9%) | 4mo | $275,000 | $184 | 56 |
| 9011 Westside Dr | 0.68mi | 3/2.0 | 1,501 (-8%) | 4mo | $285,000 | $190 | 52 |
| 721 Candlestick Pl | 0.70mi | 3/2.0 | 1,500 (-8%) | 4mo | $245,000 | $163 | 50 |
| 1405 Aries Dr | 0.71mi | 3/2.0 | 1,488 (-9%) | 7mo | $294,000 | $198 | 47 |
| 8825 Airway Dr | 0.74mi | 4/2.0 (+1) | 1,721 (+5%) | 8mo | $290,000 | $169 | 45 |
| 9640 Hummingbird Blvd | 0.68mi | 3/2.0 | 1,810 (+11%) | 7mo | $316,900 | $175 | 44 |
Match score weights: distance 35% · size 25% · config 20% · recency 20%. Top-matched comps best support the ARV.
Projected returns pro-forma
-3.0% appreciation · 0.76% rent growth · sell at horizon
- IRR
- -35.4%
- Equity multiple
- -0.12×
- Total profit
- $-94,386
- Equity at exit
- $44,801
- IRR
- -64.2%
- Equity multiple
- -0.80×
- Total profit
- $-151,406
- Equity at exit
- $25,979
Cash invested: $84,132 (down + closing). Projections, not guarantees.
Landlord ↔ Tenant lean methodology
- Overall (STATE)
- 87 Strongly Landlord-Friendly
- State Florida
- 87 Strongly Landlord-Friendly · R+3
- County
- — inherits STATE
- City
- — inherits STATE
ZIP-level market 32514
- Home prices YoY
- -31.2%
- Rents YoY
- 0.8%
- Active inventory
- 221
- Price-to-rent
- 0.2×
Monthly cashflow live
- Estimated rent
- $1,799 high interval (Pro) →
- Mortgage (P&I)
- −$1,576
- Tax est. 1.5%
- −$376 /mo · $4,507/yr
- Insurance
- −$125
- HOA
- −$0
- Vacancy / Maint / Mgmt
- −$378
- Net cashflow
- $-656
Break-even live
UW: 25.0% down · 7.5% · 30yr · 1.5% tax · 5.0% vac · 8.0% maint · 8.0% mgmt
Financing live
Cash to close
- Down payment
- $75,118
- Closing costs
- $9,014
- Reserves months
- —
- Total cash needed
- —
Loan-product check · same deal, 3 products live
Conventional
25% down · 7.5% · 30yr
- Down + closing
- —
- Monthly P&I
- —
- Monthly cashflow
- —
- DSCR
- —
- Eligible?
- —
Personal DTI + credit; lowest rate.
DSCR
20% down · 8.5% · 30yr
- Down + closing
- —
- Monthly P&I
- —
- Monthly cashflow
- —
- DSCR
- —
- Eligible?
- —
No personal income docs; deal must DSCR.
Hard money
10% down · 12.0% · 12mo
- Down + closing
- —
- Monthly P&I
- —
- Monthly cashflow
- —
- DSCR
- —
- Eligible?
- —
Short-term bridge; refi at stabilization.
Rent comps 18 comps
| Address | Beds | Baths | Sqft | Rent | $/sqft | DOM | Units | Dist |
|---|---|---|---|---|---|---|---|---|
| 758 Mozingo Ln Pensacola, FL | 3.0 | 2.0 | 1700 | $1,850 | $1.09 | 13d | 1 | 0.54mi |
| 1335 Foxborough Dr Unit 1329, 1331, 1333, 1335 Pensacola, FL | 2.0 | 1.5 | 1098 | $1,350 | $1.23 | 23d | 1 | 0.64mi |
| 9091 Airway Dr Pensacola, FL | 2.0 | 2.0 | 1524 | $1,675 | $1.10 | 13d | 6 | 0.70mi |
| 8742 Meadow Flower Ln Pensacola, FL | 3.0 | 2.5 | 1553 | $1,950 | $1.26 | 13d | 1 | 0.72mi |
| 8706 Meadow Flower Ln Pensacola, FL | 3.0 | 2.5 | 1537 | $1,800 | $1.17 | 23d | 1 | 0.74mi |
| 9976 Fairway Villas Ln Pensacola, FL | 3.0 | 2.0 | 1660 | $1,900 | $1.14 | 21d | 1 | 0.77mi |
| 9095 Airway Dr Pensacola, FL | 1.0–3.0 | 1.0–2.0 | 1542 | $1,809 | $1.17 | 13d | 19 | 0.84mi |
| 8651 Airway Dr Pensacola, FL | 2.0 | 2.0 | 1170 | $1,682 | $1.44 | 21d | 15 | 0.89mi |
| 1232 Greystone Ln Pensacola, FL | 3.0 | 2.0 | 1628 | $2,100 | $1.29 | 23d | 1 | 0.90mi |
| 8881 Bellawood Cir Pensacola, FL | 3.0 | 2.0 | 1685 | $2,100 | $1.25 | 23d | 1 | 0.96mi |
| 9100 Baldridge Rd Pensacola, FL | 1.0–3.0 | 1.0–2.0 | 1086 | $1,966 | $1.81 | 13d | 13 | 1.12mi |
| 1878 E Nine Mile Rd Pensacola, FL | 1.0–3.0 | 1.0–2.0 | 887 | $1,495 | $1.68 | 23d | 8 | 1.18mi |
| 8440 Chisholm Rd Unit B Pensacola, FL | 3.0 | 2.0 | 1112 | $1,525 | $1.37 | 23d | 1 | 1.27mi |
| 9004 Governors Place Ct Pensacola, FL | 2.0 | 2.5 | 1250 | $1,450 | $1.16 | 13d | 1 | 1.42mi |
| 1600 Governors Dr Pensacola, FL | 1.0–3.0 | 1.0–2.0 | 1010 | $1,991 | $1.97 | 13d | 25 | 1.47mi |
| 2025 Cambridge Cir Pensacola, FL | 3.0 | 2.0 | 1374 | $1,600 | $1.16 | 23d | 1 | 1.48mi |
| 1613 Governors Dr Pensacola, FL | 2.0 | 2.0 | 1275 | $1,600 | $1.25 | 23d | 1 | 1.48mi |
| 1500 E Johnson Ave #128 Pensacola, FL | 2.0 | 2.0 | 1078 | $1,275 | $1.18 | 23d | 1 | 1.49mi |
Listing history 6 events
-
2026-06-18days on market $5,000 Active 7 DOM
-
2026-06-17days on market $5,000 Active 6 DOM
-
2026-06-16days on market $5,000 Active 5 DOM
-
2026-06-15days on market $5,000 Active 4 DOM
-
2026-06-14remarks 288-char remark
-
2026-06-14$5,000 Active 2 DOM
ⓘ Source: listings_history table (triggers on properties + properties_extension) + one-shot
backfill from property_details.listing_events for pre-trigger history.
Climate risk First Street
- Flood 1/10 Low FEMA zone X (unshaded) · 0% chance over 30 yrs
- Wildfire 1/10 Low
- Heat 10/10 Extreme 7 d/yr ≥106°F today · 23 d/yr by 30 yrs out
- Wind 9/10 Extreme 99% chance of damaging wind over 30 yrs
- Air quality 1/10 Low 0 unhealthy d/yr today · 0 by 30 yrs out
Nearby sold comps map
Loading sold comps map…
Walkable amenities ~0.75 mi
Loading nearby amenities…
Taxation est. · year 1
- Rental income
- $21,582
- − Mortgage interest
- −$16,831
- − Property taxes
- −$4,507
- − Insurance
- −$1,502
- − Repairs & maintenance
- −$1,727
- − Management
- −$1,727
- − Depreciation
- −$8,741
- Taxable loss
- −$13,452
- Est. tax savings @ 24.0%
- +$3,229
- After-tax cash flow
- $-4,639/yr
For passive investors: Depreciation is non-cash, so a rental often shows a tax loss while cash-flowing — sheltering income. Rental losses are passive: they offset passive income freely, and up to $25,000/yr can offset ordinary (W-2) income if you actively participate and your MAGI is under $100k (phasing out to $0 by $150k); unused losses carry forward. On sale, claimed depreciation is recaptured at up to 25%, and gains may owe capital-gains tax (a 1031 exchange can defer both). Figures are a year-1 estimate at your 24.0% rate — not tax advice; consult a CPA.
Schools (NCES district)
- District
- Escambia
- NCES district ID
- 1200510
- Math proficiency
- 40% ▼ -9.00%
- Reading proficiency
- 45% ▼ -4.00%
- Median HH income
- $44,649
- Composite
- 36.04/100
- National rank
- #4773
- State rank
- #56 of 73 in FL
Livability — Ferry Pass
- Score
- 65/100
- State rank
- #664
- US rank
- #13543
Category grades
Schools grade is shown separately in the Schools card above.
Census & demographics
- Census place
- Ferry Pass, FL
- County
- Escambia County · 301,722 people
- City population
- 43,072
- Metro
- Pensacola-Ferry Pass-Brent, FL
- Population (ZIP)
- 42,447
- Household income
- $66,644
- Rent vs Own
- Severe rent burden
- 1962.0
Population outlook (Escambia County) Hauer SSP2
- Today (2025)
- 334,637 people
- By 2030
- 345,779 · +3.3%
- By 2040
- 364,828 · +9.0%
- By 2050
- 378,514 · +13.1%
- By 2075
- 403,220 · +20.5%
- By 2100
- 386,125 · +15.4%
Race, ethnicity, and origin ACS 2023
- Neighborhood character
- Diverse neighborhood (Simpson 0.55)
- Race & ethnicity
- White 63% Black 22% Two or more races 9% Hispanic / Latino 7% Asian 2%
- Hispanic origin (detail)
- Mexican 2% Puerto Rican 2%
- Common ancestry
- Italian 3% Lithuanian 2% Slovak 2%
- Foreign-born
- 6% · Canada, South Korea
- Languages at home
- 91% English-only · Spanish 5% Other Indo-European 1% Tagalog/Filipino 1%
Political lean MEDSL · Escambia
- 2024 margin
- R (+19.5) · D 39.7% · R 59.2% · Other 1.1%
- 2008→2024 swing
- -0.2pp no change · 2008: -19.3pp · 2024: -19.5pp
- All cycles
- 2024: R+19.5 2020: R+15.1 2016: R+20.6 2012: R+20.6 2008: R+19.3
Not yet ingested
- Civics
- —
Market trends
- HPI YoY
- ▼ -120.99%
- Current HPI
- 266.7408
- Rent YoY
- ▲ 0.76%
- Metro
- Pensacola-Ferry Pass-Brent, FL
- State GDP YoY
- ▲ 3.28%
- F500 in state
- 36
Industry mix (Fortune 500 HQ in FL)
| Industry | F500 HQs | Revenue |
|---|---|---|
| Industrial Technology | 2 | $29B |
|
||
| Insurance | 2 | $17B |
|
||
| Retail | 1 | $60B |
|
||
| Technology Distribution | 1 | $58B |
|
||
| Homebuilding | 1 | $35B |
|
||
| Technology Manufacturing | 1 | $35B |
|
||
Price history
-86.5% since first listed4 events — show timeline
- 2026-06-11 Listed $5,000 NFMLS
- 1975-01-01 Sold (Public Records) $40,500 Public Records
- 1973-01-01 Sold (Public Records) $33,000 Public Records
- 1969-01-01 Sold (Public Records) $37,000 Public Records
Property tax history
+3.7%/yrLatest (2025): $1,057 · +19.2% YoY. Source: county tax records.
Cash-flow waterfall
monthlySold comps — $/sqft
last 12 mo · ≤1 miLoading sold comps…