 Triplex
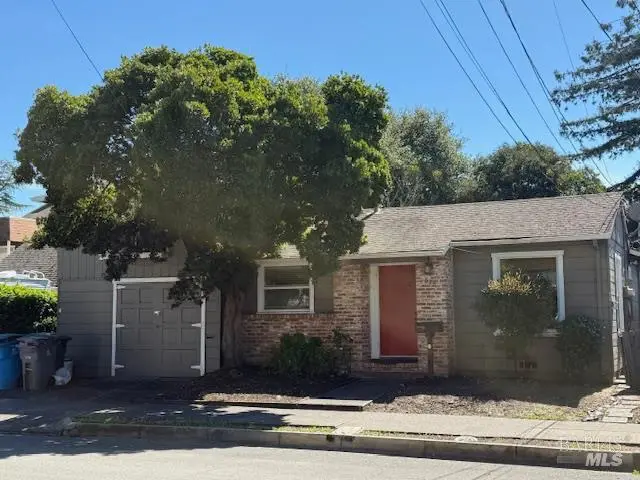
618 Benton St · Santa Rosa, CA
Flood risk 5/10 · Moderate
- FEMA flood zone
- X (unshaded)
- Chance of flooding over 30 yrs
- 0.66%
- Est. flood insurance / yr
- $507 – $1,088
Fire risk 1/10 · Minimal
- Est. fire insurance / yr
- $659 – $1,223
Heat risk 4/10 · Minor
- Hot days now (above 92°F)
- 7 days/yr
- Hot days in 30 yrs
- 15 days/yr
Wind risk 1/10 · Minimal
- Chance of severe wind over 30 yrs
- —
Air-quality risk 8/10 · Major
- Unhealthy air days now
- 15 days/yr
- Unhealthy air days in 30 yrs
- 17 days/yr
Risk factors via First Street. Map © Google.
Why this score? — see what drove the D- grade
The composite is a weighted blend of 9 inputs, each scored 0–100. Each bar is that input's sub-score; the figure is the points it added to the 100-point composite (weight × sub-score).
- Cash flow +12.7/30.0
- DSCR +3.8/10.0
- Livability +3.8/5.0
- Schools +3.7/10.0
- ARV discount +3.0/15.0
- 1% rule +2.9/10.0
- Rent growth +2.8/5.0
- Condition / age +2.5/5.0
- Appreciation +0.0/10.0
$895,000
🖨 Deal sheet (PDF) 📄 Offer letter ✓ Due diligence
Multi-family units
County records classify this as Multi-Family (2-4 Unit). Listing-text estimate: 3 units. confirmed
Listing remarks
Prime investment opportunity with strong income in Santa Rosa JC area, close to shopping, transportation, and schools. Charming 1940's triplex consisting of s 2 bedroom 1 bath with garage and yard, 1 bedroom 1 bath with fireplace and yard, both have washer/dryer hookups, and upstairs private studio unit above garage. All of hardwood floors, dual pane windows, stoves and refrigerators. One owner is California Licensed Real Estate Broker.
Key facts
- Private studio unit
- Washer dryer hookups
- Santa rosa jc area
Tags
Property features AI
Finance
- Other: Three total units (includes one studio); Unit 1 approximately 1,110 sq ft; Unit 2 approximately 548 sq ft
- HOA & community: No homeowners association
Exterior
- Parking: Street parking available; Attached garage with 1 garage space (total parking count: 1)
- Utilities: Public sewer
- Home design: Residential income property; Triplex
- Construction: Composition roof
- Exterior features: Composition roof; Lot is irregularly shaped
Interior
- Kitchen: Kitchens vary by unit
- Bedrooms: Unit 1: 2 bedrooms; Unit 2: 1 bedroom; One studio unit included (total units: 3)
- Bathrooms: Unit 1: 1 full bathroom; Unit 2: 1 full bathroom
- Heating & cooling: Heating varies by unit; No central cooling
- Interior features: Laundry arrangements vary by unit; No basement
- Laundry & utility: Laundry varies by unit
Neighborhood map
What this means for you Summary
Snapshot
- This is a 2×3bd/1.0ba + 1×1bd/1.0ba units multifamily listed at $895k.
Deal economics
- At list price, monthly cash flow is $-93 ($-1k/yr) — negative. Per door: $-31/mo.
- To cash-flow at today's rent, offer at most $879k (1.8% below list).
- To meet the 1% rule (rent ≥ 1% of price), the offer needs to be $709k (20.8% below list).
- Recommended offer: $709k (20.8% below list) — sets the bar for 1% rule.
- Cap rate 6.2% vs local median 2.5% in Santa Rosa — top-decile yield for the area; either an underpriced asset or a hidden risk that comps aren't pricing in. Stress-test before assuming the spread holds.
Location & tenants
- Location reads 75/100 on livability (#112 in CA, #3,940 nationally) — a middle-class / working-renter tenant base. Strengths: amenities A+, commute A+, employment A+; Watch: cost of living F.
- Santa Rosa High (urban): math 31% / reading 47% proficiency, ranked #703 of 1,400 in CA (top 50%) — families likely to look elsewhere, expect single-tenant / working-renter base with shorter leases.
- Zoned schools: Steele Lane Elementary (378 students, 69% FRL); Santa Rosa Middle (466 students, 53% FRL); Santa Rosa High (1,682 students, 39% FRL) — zoned schools average 54% FRL vs 22% district-wide (31 pts higher); higher-poverty schools than district average — tighter screening recommended.
- Market conditions: Rents rising (+1.1%/yr); 250 active listings in the ZIP; 9 comparable units currently listed for rent nearby; rentals at typical pace (median 16d on market — plan ~3-4 weeks tenant-placement turnaround); solid renter incomes; 1,039 units permitted in Sonoma County in 2024 (185 in 5+ unit buildings).
- At $7,086/mo this rent would consume 81% of the median local household income ($105k/yr) (locally 1663% of renters already pay >50% of income on rent) — very limited rent-growth headroom before tenants either downsize or default.
Forward outlook
- Local home prices are declining (-3.0%/yr); year-one equity from $6k of loan paydown is wiped out by about $27k of value loss. Plan a longer hold.
- Sonoma County population projected at +8% by 2050 — modest demand growth; plan on rents tracking national, not racing it.
Negotiation context
- It's been on market 29 days — a 2% lower offer ($882k) is reasonable based on typical stale-listing flexibility.
- Current owner paid $450k; list at $895k implies a 99% gain — meaningful room to come down on a strong offer.
Risks & watch-outs
- Watch-outs: built in 1940 — expect roof / HVAC / electrical / plumbing capex.
- Climate carrying-cost: moderate flood risk — expect insurance premiums to compound above CPI over the hold.
Questions for the listing agent
- What do current leases actually rent for vs. the listed asking? Can we see a recent rent roll and the last 12 months of T-12 income?
- Can we see the unit-by-unit rent roll, current vacancy, and any below-market leases? What's the average tenancy length?
- What capital expenditures (roof, boiler, parking lot, exteriors) have been made in the last 5 years, and what's planned in the next 2?
- Built in 1940 — when were the roof, HVAC, electrical panel, plumbing, and water heater last replaced?
- Is there a deadline driving the sale (1031 exchange, divorce, estate, relocation)? That informs how much negotiation room exists.
- The area grade is low — what's the realistic commute time and amenity access for the typical tenant pool here? Any planned neighborhood developments (good or bad) we should know about?
- What's the average days-on-market for RENTAL listings here right now (not sales)? A rising rental-DOM trend means longer vacancies and softer asking-rent achievability than the comps imply.
- What's the recent tenant-quality profile in this submarket — average credit score on applications, eviction rate, late-payment / NSF rate, and stable-employment percentage? A property-management company in the area should have these aggregated.
- How much new apartment / multifamily construction is in the pipeline within 1–3 miles? Heavy new supply (>2% of stock underway) typically softens rents 12–24 months out; light construction supports rent growth.
Investment metrics
- 1% rule
- 0.79% ✗
- Cap rate
- 6.17%
- Cash-on-cash
- -0.45%
- DSCR
- 0.98
- GRM
- 10.5
CMA / ARV
- ARV (on-the-fly)
- $814,368
- Comps found
- 6
Show comp detail 6 sales within ~0.75 mi
| Address | Dist | Beds/Ba | Sqft | Sold | Price | $/sf | Match |
|---|---|---|---|---|---|---|---|
| 342 College Ave | 0.34mi | 3/2.0 (-1) | 1,500 (-8%) | 4mo | $749,000 | $499 | 58 |
| 326 - 328 Carrillo St | 0.34mi | 4/2.0 | 1,764 (+8%) | 12mo | $750,000 | $425 | 57 |
| 130 - 130A 11th St | 0.60mi | 4/2.0 | 1,514 (-7%) | 4mo | $777,777 | $514 | 53 |
| 1816 Arbor Ave | 0.71mi | 3/3.0 (-1) | 1,670 (+2%) | 18mo | $872,580 | $523 | 43 |
| 134 11th St | 0.59mi | 3/2.0 (-1) | 1,485 (-9%) | 17mo | $670,000 | $451 | 34 |
| 134 11th St | 0.59mi | 3/2.0 (-1) | 1,485 (-9%) | 17mo | $670,000 | $451 | 34 |
Match score weights: distance 35% · size 25% · config 20% · recency 20%. Top-matched comps best support the ARV.
Projected returns pro-forma
-3.0% appreciation · 1.1% rent growth · sell at horizon
- IRR
- -19.0%
- Equity multiple
- 0.34×
- Total profit
- $-164,449
- Equity at exit
- $133,447
- IRR
- -15.7%
- Equity multiple
- 0.19×
- Total profit
- $-204,145
- Equity at exit
- $77,383
Cash invested: $250,600 (down + closing). Projections, not guarantees.
Landlord ↔ Tenant lean methodology
- Overall (STATE)
- 18 Strongly Tenant-Friendly
- State California
- 18 Strongly Tenant-Friendly · D+13
- County
- — inherits STATE
- City
- — inherits STATE
ZIP-level market 95404
- Rents YoY
- 1.1%
- Active inventory
- 250
- Price-to-rent
- 29.0×
Monthly cashflow live
- Estimated rent
- $7,086 high interval (Pro) →
- Mortgage (P&I)
- −$4,693
- Tax from tax record
- −$625 /mo · $7,496/yr
- Insurance
- −$373
- HOA
- −$0
- Vacancy / Maint / Mgmt
- −$1,488
- Net cashflow
- $-93
Break-even live
Sensitivity live
| Price | -10% $414 | -5% $160 | +0% $-93 | +5% $-346 | +10% $-600 |
|---|---|---|---|---|---|
| Rent | -10% $-653 | -5% $-373 | +0% $-93 | +5% $187 | +10% $467 |
| Rate | -1.0pp $358 | -0.5pp $135 | base $-93 | +0.5pp $-325 | +1.0pp $-561 |
3-unit breakdown (identical units grouped — click to expand)
| Units | Beds | Baths | Est. rent |
|---|---|---|---|
| 2× units | 3 | 1 | $5,140 |
| #1 | 3 | 1 | $2,570 |
| #2 | 3 | 1 | $2,570 |
| 1× unit | 1 | 1 | $1,946 |
| Total (3 units) | $7,086 | ||
UW: 25.0% down · 7.5% · 30yr · 1.5% tax · 5.0% vac · 8.0% maint · 8.0% mgmt
Financing live
Cash to close
- Down payment
- $223,750
- Closing costs
- $26,850
- Reserves months
- —
- Total cash needed
- —
Loan-product check · same deal, 3 products live
Conventional
25% down · 7.5% · 30yr
- Down + closing
- —
- Monthly P&I
- —
- Monthly cashflow
- —
- DSCR
- —
- Eligible?
- —
Personal DTI + credit; lowest rate.
DSCR
20% down · 8.5% · 30yr
- Down + closing
- —
- Monthly P&I
- —
- Monthly cashflow
- —
- DSCR
- —
- Eligible?
- —
No personal income docs; deal must DSCR.
Hard money
10% down · 12.0% · 12mo
- Down + closing
- —
- Monthly P&I
- —
- Monthly cashflow
- —
- DSCR
- —
- Eligible?
- —
Short-term bridge; refi at stabilization.
Rent comps 9 comps
| Address | Beds | Baths | Sqft | Rent | $/sqft | DOM | Units | Dist |
|---|---|---|---|---|---|---|---|---|
| 824 Spencer Ave Apt 2 Santa Rosa, CA | 3.0 | 1.0 | 1100 | $2,600 | $2.36 | 23d | 1 | 0.22mi |
| 300 Brown St Santa Rosa, CA | 3.0 | 1.5 | 1193 | $3,200 | $2.68 | 15d | 1 | 0.91mi |
| 901 Link Ln Santa Rosa, CA | 3.0 | 1.0 | 1100 | $2,645 | $2.40 | 15d | 1 | 1.12mi |
| 1303 Hexem Ave Santa Rosa, CA | 3.0 | 2.0 | 1529 | $3,500 | $2.29 | 23d | 1 | 1.14mi |
| 1470 Tammy Way Santa Rosa, CA | 3.0 | 2.5 | 1200 | $3,000 | $2.50 | 15d | 1 | 1.18mi |
| 1217 Jennings Ave Santa Rosa, CA | 3.0 | 2.0 | 1172 | $3,250 | $2.77 | 15d | 1 | 1.23mi |
| 1333 W Steele Ln Santa Rosa, CA | 1.0–3.0 | 1.0–2.0 | 850 | $3,000 | $3.53 | 15d | 4 | 1.25mi |
| 1514 Lance Dr Santa Rosa, CA | 3.0 | 2.5 | 1185 | $3,150 | $2.66 | 23d | 1 | 1.26mi |
| 2791 McBride Ln #118 Santa Rosa, CA | 3.0 | 2.5 | 1400 | $3,500 | $2.50 | 15d | 1 | 1.47mi |
Listing history 22 events
-
2026-06-21days on market $895,000 Active 29 DOM
-
2026-06-18days on market $895,000 Active 26 DOM
-
2026-06-17days on market $895,000 Active 25 DOM
-
2026-06-16days on market $895,000 Active 24 DOM
-
2026-06-15days on market $895,000 Active 23 DOM
-
2026-06-14days on market $895,000 Active 21 DOM
-
2026-06-13days on market $895,000 Active 20 DOM
-
2026-06-10days on market $895,000 Active 18 DOM
-
2026-06-09days on market $895,000 Active 17 DOM
-
2026-06-08days on market $895,000 Active 16 DOM
-
2026-06-07days on market $895,000 Active 15 DOM
-
2026-06-05days on market $895,000 Active 12 DOM
-
2026-06-03days on market $895,000 Active 11 DOM
-
2026-06-02days on market $895,000 Active 10 DOM
-
2026-06-01days on market $895,000 Active 9 DOM
-
2026-05-31days on market $895,000 Active 8 DOM
-
2026-05-30days on market $895,000 Active 7 DOM
-
2026-05-23$895,000 Active
-
2003-01-17soldstatus $450,000
-
2000-08-29soldstatus $330,000
-
1994-05-20soldstatus $193,000
-
1982-01-07soldstatus $125,000
ⓘ Source: listings_history table (triggers on properties + properties_extension) + one-shot
backfill from property_details.listing_events for pre-trigger history.
Tax reassessment forecast CA · Resets to sale price
- Current annual tax
- $7,496 · $625/mo
- Projected year-2 tax
- $7,496 · $625/mo
- Expected delta
- $0/yr ($0/mo · 0.0%)
ⓘ Screening estimate from a state-policy table — verify with the county assessor before closing.
Climate risk First Street
- Flood 5/10 Major FEMA zone X (unshaded) · 66% chance over 30 yrs
- Wildfire 1/10 Low
- Heat 4/10 Moderate 7 d/yr ≥92°F today · 15 d/yr by 30 yrs out
- Wind 1/10 Low
- Air quality 8/10 Severe 15 unhealthy d/yr today · 17 by 30 yrs out
Nearby sold comps map
Loading sold comps map…
Walkable amenities ~0.75 mi
Loading nearby amenities…
Taxation est. · year 1
- Rental income
- $85,032
- − Mortgage interest
- −$50,134
- − Property taxes
- −$7,496
- − Insurance
- −$4,475
- − Repairs & maintenance
- −$6,803
- − Management
- −$6,803
- − Depreciation
- −$26,036
- Taxable loss
- −$16,714
- Est. tax savings @ 24.0%
- +$4,011
- After-tax cash flow
- $2,894/yr
For passive investors: Depreciation is non-cash, so a rental often shows a tax loss while cash-flowing — sheltering income. Rental losses are passive: they offset passive income freely, and up to $25,000/yr can offset ordinary (W-2) income if you actively participate and your MAGI is under $100k (phasing out to $0 by $150k); unused losses carry forward. On sale, claimed depreciation is recaptured at up to 25%, and gains may owe capital-gains tax (a 1031 exchange can defer both). Figures are a year-1 estimate at your 24.0% rate — not tax advice; consult a CPA.
Schools (NCES district)
- District
- Santa Rosa High
- NCES district ID
- 0635830
- Math proficiency
- 31% —
- Reading proficiency
- 47% —
- Median HH income
- $62,000
- Composite
- 37.25/100
- National rank
- #8972
- State rank
- #703 of 1400 in CA
Livability — Santa Rosa
- Score
- 75/100
- State rank
- #112
- US rank
- #3940
Category grades
Schools grade is shown separately in the Schools card above.
Census & demographics
- Census place
- Santa Rosa, CA
- County
- Sonoma County · 449,805 people
- City population
- 210,074
- Metro
- Santa Rosa-Petaluma, CA
- Population (ZIP)
- 37,011
- Household income
- $105,437
- Rent vs Own
- Severe rent burden
- 1663.0
Population outlook (Sonoma County) Hauer SSP2
- Today (2025)
- 539,935 people
- By 2030
- 554,870 · +2.8%
- By 2040
- 573,262 · +6.2%
- By 2050
- 580,715 · +7.6%
- By 2075
- 579,229 · +7.3%
- By 2100
- 547,835 · +1.5%
Race, ethnicity, and origin ACS 2023
- Neighborhood character
- Diverse neighborhood (Simpson 0.56)
- Race & ethnicity
- White 61% Hispanic / Latino 25% Two or more races 13% Asian 7% Black 2%
- Hispanic origin (detail)
- Mexican 21%
- Common ancestry
- Lithuanian 4% Italian 4% Slovak 3%
- Foreign-born
- 14% · Canada, China
- Languages at home
- 76% English-only · Spanish 16% Other Asian/Pacific 2% Tagalog/Filipino 2%
Political lean MEDSL · Sonoma
- 2024 margin
- Solid D (+46.2) · D 71.4% · R 25.2% · Other 3.3%
- 2008→2024 swing
- -3.4pp toward R · 2008: 49.6pp · 2024: 46.2pp
- All cycles
- 2024: D+46.2 2020: D+51.5 2016: D+47.9 2012: D+44.9 2008: D+49.6
Not yet ingested
- Civics
- —
Market trends
- HPI YoY
- ▼ -797.65%
- Current HPI
- 244.7593
- Rent YoY
- ▲ 1.10%
- Metro
- Santa Rosa-Petaluma, CA
- State GDP YoY
- ▲ 3.21%
- F500 in state
- 116
Industry mix (Fortune 500 HQ in CA)
| Industry | F500 HQs | Revenue |
|---|---|---|
| Technology | 27 | $1,492B |
|
||
| Financial Services | 3 | $174B |
|
||
| Retail | 3 | $44B |
|
||
| Insurance | 3 | $26B |
|
||
| Media / Entertainment | 2 | $115B |
|
||
| Pharmaceuticals / Biotech | 2 | $62B |
|
||
Price history
+616.0% since first listed5 events — show timeline
- 2026-05-23 Listed $895,000 BAREIS
- 2003-01-17 Sold (Public Records) $450,000 Public Records
- 2000-08-29 Sold (Public Records) $330,000 Public Records
- 1994-05-20 Sold (Public Records) $193,000 Public Records
- 1982-01-07 Sold (Public Records) $125,000 Public Records
Property tax history
+1.7%/yrLatest (2025): $7,496 · +1.5% YoY. Source: county tax records.
Cash-flow waterfall
monthlySold comps — $/sqft
last 12 mo · ≤1 miLoading sold comps…