101 Joslin Rd.#7 Rd · Carlsborg, WA
Flood risk 1/10 · Minimal
- FEMA flood zone
- X
- Chance of flooding over 30 yrs
- 0.0%
- Est. flood insurance / yr
- $507 – $1,088
Fire risk 3/10 · Minor
- Est. fire insurance / yr
- $604 – $1,122
Heat risk 2/10 · Minimal
- Hot days now (above 83°F)
- 7 days/yr
- Hot days in 30 yrs
- 15 days/yr
Wind risk 1/10 · Minimal
- Chance of severe wind over 30 yrs
- —
Air-quality risk 6/10 · Moderate
- Unhealthy air days now
- 7 days/yr
- Unhealthy air days in 30 yrs
- 8 days/yr
Risk factors via First Street. Map © Google.
Why this score? — see what drove the B grade
The composite is a weighted blend of 9 inputs, each scored 0–100. Each bar is that input's sub-score; the figure is the points it added to the 100-point composite (weight × sub-score).
- Cash flow +30.0/30.0
- 1% rule +10.0/10.0
- DSCR +10.0/10.0
- ARV discount +7.5/15.0
- Schools +5.3/10.0
- Livability +3.0/5.0
- Rent growth +2.5/5.0
- Condition / age +2.5/5.0
- Appreciation +0.0/10.0
$89,000
🖨 Deal sheet 📄 Offer letter ✓ Due diligence
Listing remarks MLS
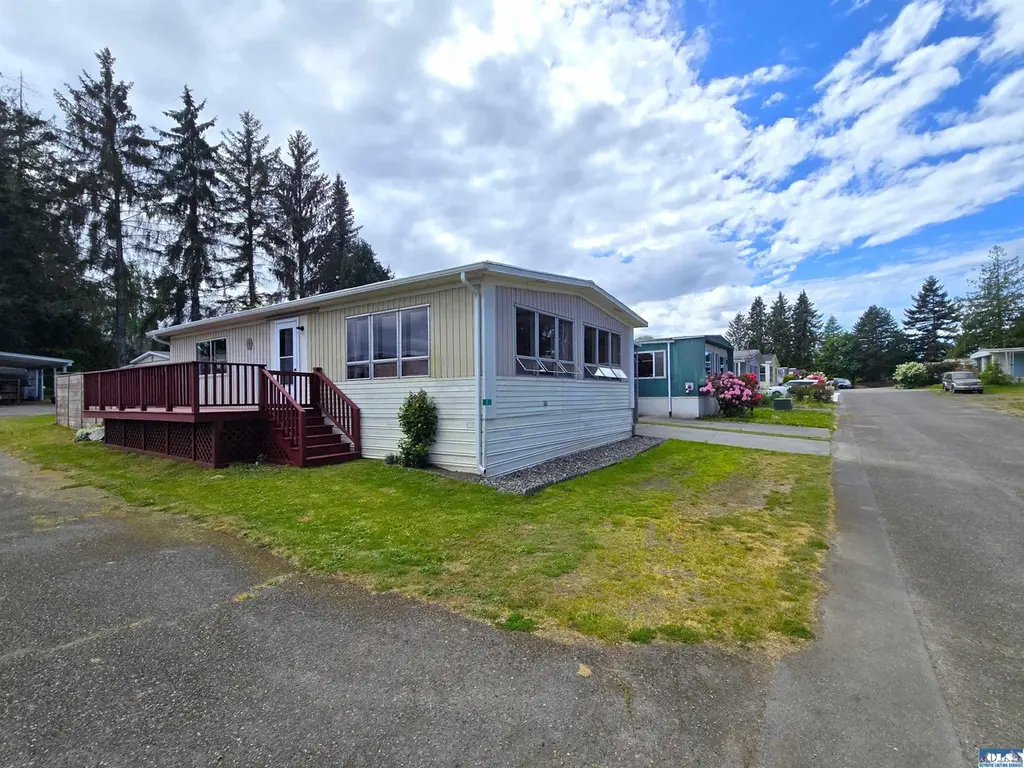
Great possibilities with this comfortable 2 Bedroom mobile in Olympic View Mobile Home Park! Enjoy sipping coffee in the morning sunshine from the big east facing deck! Quiet corner lot with low traffic and a great neighborhood! This mobile has a nice carport that could accommodate 2 cars, and 2 storage sheds with power and a workbench for the hobbies! Close to bus lines and away from the bustle of town. Come take a look!
Key facts
- Large deck
- Southern exposure
- Double wide home
Tags
Property features AI
Exterior
- Parking: Paved parking
- Utilities: Septic tank (shared septic)
- Home design: Residential mobile home; Faces south
- Exterior features: Deck; Workshop; Level yard; Corner lot
Interior
- Kitchen: Dishwasher; Oven; Range; Refrigerator
- Flooring: Laminate; Carpet
- Bathrooms: 1 full bathroom
- Heating & cooling: Electric heating; Forced air
- Interior features: Dishwasher; Dryer; Oven; Range; Refrigerator; Storage
- Laundry & utility: Dryer
Neighborhood map
What this means for you Summary
Snapshot
- This is a 2-bed/1.0-bath manufactured listed at $89k.
Deal economics
- At list price, monthly cash flow is $963 ($12k/yr) — positive.
- The deal already cash-flows at list — no discount required.
- Meets the 1% rule at list price ($2k rent vs $89k).
- Recommended offer: $86k (3.0% below list) — sets the bar for market timing.
- Cap rate 19.3% vs local median 2.4% in Carlsborg — top-decile yield for the area; either an underpriced asset or a hidden risk that comps aren't pricing in. Stress-test before assuming the spread holds.
Location & tenants
- Location reads 59/100 on livability (#493 in WA) — a working-class tenant base; expect higher turnover. Strengths: cost of living A+, housing A+; Watch: employment D, health & safety D, crime D-.
- Sequim School District (town): math 55% / reading 66% proficiency, ranked #64 of 291 in WA (top 22%) — acceptable for families but not a draw, mixed tenant base, ~2y average lease.
- Market conditions: 605 active listings in the ZIP; 166 units permitted in Clallam County in 2024 (0 in 5+ unit buildings).
- This rent runs 31% of the median local income ($74k/yr) — at the standard rent-burdened threshold; future hikes will face affordability resistance.
Forward outlook
- Local home prices are declining (-3.0%/yr); year-one equity from $615 of loan paydown is wiped out by about $3k of value loss. Plan a longer hold.
- Clallam County population projected at +5% by 2050 — modest demand growth; plan on rents tracking national, not racing it.
- At projected returns (-3.0% appreciation + 3.0% rent growth), your $25k cash investment doubles in ~3 years — after that, you're playing with house money.
Negotiation context
- It's been on market 36 days — a 3% lower offer ($86k) is reasonable based on typical stale-listing flexibility.
- 2 sale attempts; this cycle's ask has dropped $10k (10%) from the opening price — seller is motivated, your offer sets the floor, not the list.
- Current owner paid $62k; 44% above their basis — modest negotiation headroom, anchor on the comps not their cost.
Questions for the listing agent
- It's been on market 36 days. Have you received any prior offers? Is the seller open to a 3% concession, seller financing, or rate buy-down credit?
- Built in 1973 — when were the roof, HVAC, electrical panel, plumbing, and water heater last replaced?
- Is there a deadline driving the sale (1031 exchange, divorce, estate, relocation)? That informs how much negotiation room exists.
- Schools are B-rated — typically a magnet for longer-tenancy family renters. What's the average tenant stay here, and is there a school-zone premium baked into asking?
- Crime grade is D in this area — have there been break-ins, vandalism, or insurance claims at this property in the last 3 years? What carrier currently insures it and at what premium?
- What's the average days-on-market for RENTAL listings here right now (not sales)? A rising rental-DOM trend means longer vacancies and softer asking-rent achievability than the comps imply.
- What's the recent tenant-quality profile in this submarket — average credit score on applications, eviction rate, late-payment / NSF rate, and stable-employment percentage? A property-management company in the area should have these aggregated.
- How much new for-sale + rental construction is in the pipeline within 1–3 miles? Heavy new supply typically softens prices + rents 12–24 months out; constrained supply supports both.
Investment metrics
- 1% rule
- 2.12% ✓
- Cap rate
- 19.27%
- Cash-on-cash
- 46.35%
- DSCR
- 3.06
- GRM
- 3.9
CMA / ARV
- ARV (on-the-fly)
- $40,320
- Comps found
- 1
Show comp detail 1 sale within ~0.75 mi
| Address | Dist | Beds/Ba | Sqft | Sold | Price | $/sf | Match |
|---|---|---|---|---|---|---|---|
| 101 Joslin Rd #8 | 0.00mi | 2/1.0 | 960 (0%) | 4mo | $40,000 | $42 | 96 |
Match score weights: distance 35% · size 25% · config 20% · recency 20%. Top-matched comps best support the ARV.
Projected returns pro-forma
-3.0% appreciation · 3.0% rent growth · sell at horizon
- IRR
- 43.6%
- Equity multiple
- 2.88×
- Total profit
- $46,858
- Equity at exit
- $13,270
- IRR
- 49.6%
- Equity multiple
- 5.80×
- Total profit
- $119,645
- Equity at exit
- $7,695
Cash invested: $24,920 (down + closing). Projections, not guarantees.
Landlord ↔ Tenant lean methodology
- Overall (STATE)
- 28 Tenant-Leaning
- State Washington
- 28 Tenant-Leaning · D+8
- County
- — inherits STATE
- City
- — inherits STATE
ZIP-level market 98382
- Active inventory
- 605
- Price-to-rent
- 3.9×
Monthly cashflow live
- Estimated rent
- $1,890 medium interval (Pro) →
- Mortgage (P&I)
- −$467
- Tax from tax record
- −$27 /mo · $319/yr
- Insurance
- −$37
- HOA
- −$0
- Vacancy / Maint / Mgmt
- −$397
- Net cashflow
- $963
Break-even live
UW: 25.0% down · 7.5% · 30yr · 1.5% tax · 5.0% vac · 8.0% maint · 8.0% mgmt
Financing live
Cash to close
- Down payment
- $22,250
- Closing costs
- $2,670
- Reserves months
- —
- Total cash needed
- —
Loan-product check · same deal, 3 products live
Conventional
25% down · 7.5% · 30yr
- Down + closing
- —
- Monthly P&I
- —
- Monthly cashflow
- —
- DSCR
- —
- Eligible?
- —
Personal DTI + credit; lowest rate.
DSCR
20% down · 8.5% · 30yr
- Down + closing
- —
- Monthly P&I
- —
- Monthly cashflow
- —
- DSCR
- —
- Eligible?
- —
No personal income docs; deal must DSCR.
Hard money
10% down · 12.0% · 12mo
- Down + closing
- —
- Monthly P&I
- —
- Monthly cashflow
- —
- DSCR
- —
- Eligible?
- —
Short-term bridge; refi at stabilization.
Listing history 21 events
-
2026-06-19days on market $89,000 Active 36 DOM
-
2026-06-18days on market $89,000 Active 35 DOM
-
2026-06-17days on market $89,000 Active 34 DOM
-
2026-06-16days on market $89,000 Active 33 DOM
-
2026-06-15days on market $89,000 Active 32 DOM
-
2026-06-14days on market $89,000 Active 30 DOM
-
2026-06-12days on market $89,000 Active 29 DOM
-
2026-06-09days on market $89,000 Active 26 DOM
-
2026-06-08days on market $89,000 Active 25 DOM
-
2026-06-07days on market $89,000 Active 24 DOM
-
2026-06-05days on market $89,000 Active 21 DOM
-
2026-06-03days on market $89,000 Active 20 DOM
-
2026-06-03price $89,000 Active 19 DOM
-
2026-06-02days on market $99,000 Active 19 DOM
-
2026-06-01days on market $99,000 Active 18 DOM
-
2026-05-31days on market $99,000 Active 17 DOM
-
2026-05-30days on market $99,000 Active 16 DOM
-
2026-05-16status Active
-
2026-05-14status Pending
-
2026-05-11$99,000 Active
-
2022-11-09soldstatus $62,000 431-char remark
Show marketing remark (431 chars)
Great possibilities with this comfortable 2 Bedroom mobile in Olympic View Mobile Home Park! Enjoy sipping coffee in the morning sunshine from the big east facing deck! Quiet corner lot with low traffic and a great neighborhood! This mobile has a nice carport that could accommodate 2 cars, and 2 storage sheds with power and a workbench for the hobbies! Close to bus lines and away from the bustle of town. Come take a look!
ⓘ Source: listings_history table (triggers on properties + properties_extension) + one-shot
backfill from property_details.listing_events for pre-trigger history.
Tax reassessment forecast WA · Resets to sale price
- Current annual tax
- $319 · $27/mo
- Projected year-2 tax
- $872 · $73/mo
- Expected delta
- +$553/yr (+$46/mo · 173.4%)
ⓘ Screening estimate from a state-policy table — verify with the county assessor before closing.
Climate risk First Street
- Flood 1/10 Low FEMA zone X · 0% chance over 30 yrs
- Wildfire 3/10 Moderate
- Heat 2/10 Low 7 d/yr ≥83°F today · 15 d/yr by 30 yrs out
- Wind 1/10 Low
- Air quality 6/10 Major 7 unhealthy d/yr today · 8 by 30 yrs out
Nearby sold comps map
Loading sold comps map…
Walkable amenities ~0.75 mi
Loading nearby amenities…
Taxation est. · year 1
- Rental income
- $22,677
- − Mortgage interest
- −$4,985
- − Property taxes
- −$319
- − Insurance
- −$445
- − Repairs & maintenance
- −$1,814
- − Management
- −$1,814
- − Depreciation
- −$2,589
- Taxable income
- $10,710
- Est. tax owed @ 24.0%
- −$2,570
- After-tax cash flow
- $8,980/yr
For passive investors: Depreciation is non-cash, so a rental often shows a tax loss while cash-flowing — sheltering income. Rental losses are passive: they offset passive income freely, and up to $25,000/yr can offset ordinary (W-2) income if you actively participate and your MAGI is under $100k (phasing out to $0 by $150k); unused losses carry forward. On sale, claimed depreciation is recaptured at up to 25%, and gains may owe capital-gains tax (a 1031 exchange can defer both). Figures are a year-1 estimate at your 24.0% rate — not tax advice; consult a CPA.
Schools (NCES district)
- District
- Sequim School District
- NCES district ID
- 5307830
- Math proficiency
- 55% ▼ -1.00%
- Reading proficiency
- 66% ▲ 1.00%
- Median HH income
- $46,969
- Composite
- 52.77/100
- National rank
- #3312
- State rank
- #64 of 291 in WA
Livability — Carlsborg
- Score
- 59/100
- State rank
- #493
- US rank
- #20503
Category grades
Schools grade is shown separately in the Schools card above.
Census & demographics
- County
- Clallam County · 31,052 people
- Metro
- Port Angeles, WA
- Population (ZIP)
- 31,052
- Household income
- $74,189
- Rent vs Own
- Severe rent burden
- 666.0
Population outlook (Clallam County) Hauer SSP2
- Today (2025)
- 76,817 people
- By 2030
- 78,177 · +1.8%
- By 2040
- 79,795 · +3.9%
- By 2050
- 80,890 · +5.3%
- By 2075
- 83,933 · +9.3%
- By 2100
- 82,141 · +6.9%
Race, ethnicity, and origin ACS 2023
- Neighborhood character
- Predominantly White (85%)
- Race & ethnicity
- White 85% Two or more races 7% Hispanic / Latino 4% Asian 2%
- Common ancestry
- Portuguese 5% Slovak 5% Italian 4%
- Foreign-born
- 6% · Canada
- Languages at home
- 95% English-only · Spanish 2% German/W. Germanic 1% Other Indo-European 1%
Political lean MEDSL · Clallam
- 2024 margin
- Lean D (+7.9) · D 52.6% · R 44.7% · Other 2.7%
- 2008→2024 swing
- +4.6pp toward D · 2008: 3.3pp · 2024: 7.9pp
- All cycles
- 2024: D+7.9 2020: D+3.4 2016: R+1.6 2012: D+0.4 2008: D+3.3
Not yet ingested
- Civics
- —
Market trends
- HPI YoY
- ▼ -225.89%
- Current HPI
- 181.4372
- Rent YoY
- —
- Metro
- Port Angeles, WA
- State GDP YoY
- ▲ 4.65%
- F500 in state
- 22
Industry mix (Fortune 500 HQ in WA)
| Industry | F500 HQs | Revenue |
|---|---|---|
| Retail | 2 | $269B |
|
||
| Technology / Retail | 1 | $638B |
|
||
| Technology | 1 | $245B |
|
||
| Telecommunications | 1 | $38B |
|
||
| Food / Beverage | 1 | $36B |
|
||
| Automotive / Trucks | 1 | $34B |
|
||
Price history
+59.7% since first listed4 events — show timeline
- 2026-05-16 Relisted — OLS
- 2026-05-14 Pending — OLS
- 2026-05-11 Listed $99,000 OLS
- 2022-11-09 Sold (MLS) $62,000 OLS
Property tax history
+27.1%/yrLatest (2026): $319 · +20.4% YoY. Source: county tax records.
Cash-flow waterfall
monthlySold comps — $/sqft
last 12 mo · ≤1 miLoading sold comps…