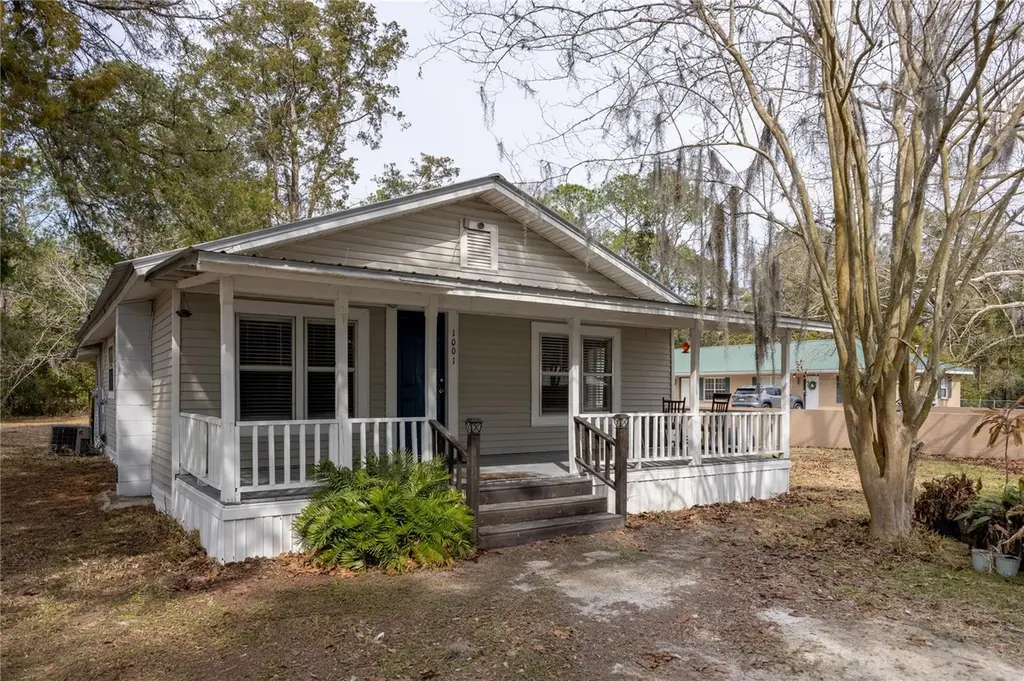
1001 NE 2nd Ave · Trenton, FL
Flood risk No data
- FEMA flood zone
- —
- Chance of flooding over 30 yrs
- —
- Est. flood insurance / yr
- —
Fire risk No data
- Est. fire insurance / yr
- —
Heat risk No data
- Hot days now (above threshold)
- —
- Hot days in 30 yrs
- —
Wind risk No data
- Chance of severe wind over 30 yrs
- —
Air-quality risk No data
- Unhealthy air days now
- —
- Unhealthy air days in 30 yrs
- —
Risk factors via First Street. Map © Google.
Why this score? — see what drove the C+ grade
The composite is a weighted blend of 9 inputs, each scored 0–100. Each bar is that input's sub-score; the figure is the points it added to the 100-point composite (weight × sub-score).
- Cash flow +16.0/30.0
- ARV discount +15.0/15.0
- Appreciation +10.0/10.0
- Schools +5.3/10.0
- DSCR +4.9/10.0
- 1% rule +3.9/10.0
- Livability +3.9/5.0
- Rent growth +2.5/5.0
- Condition / age +2.5/5.0
$140,000
🖨 Deal sheet 📄 Offer letter ✓ Due diligence
Listing remarks MLS
3/1 country style home in the heart of town! Take a look at this charming home originally built in 1928 sitting on a third of an acre and on a corner lot. Large open living room, spacious kitchen with plenty of counterspace and a separate dining room for family dinners on Sundays. Huge utility room at the back of the house with plenty of space for extra storage. The most charming thing about this home is the front porch. Imagine yourself sitting in the rocking chair enjoying a glass of sweet tea and chatting with the neighbors as they walk by or swinging on a porch swing with your loved ones. The backyard is large enough for the kids to run and play and there's even room for a small garden. Located just walking distance to local restaurants, shopping and doctors offices. A 30 minute drive to Gainesville for work, entertainment and UF Health. This beautiful home won't last long! Call today to schedule a private tour!
Key facts
- Covered front porch
- Newer ac
- Metal roof
Tags
Property features AI
Finance
- Other: Residential zoning; Unfurnished; Living area about 1,248 sq ft (public records); Building area about 1,456 sq ft (public records)
- HOA & community: No association
Exterior
- Parking: Paved access (street)
- Utilities: Public water; Public sewer; Electricity connected; Water connected; Sewer connected
- Home design: Single-family residence; One-story home; Faces south
- Construction: Frame construction with wood siding; Metal roof; Crawlspace foundation; Built on a 0.39-acre lot (approx. 1/4 to less than 1/2 acre)
- Exterior features: Covered front and rear porches; Private mailbox; Corner lot within city limits; Level, paved lot
Interior
- Kitchen: Dishwasher; Refrigerator
- Bedrooms: 3 bedrooms
- Flooring: Vinyl
- Bathrooms: 1 full bathroom
- Heating & cooling: Electric heating; Heat pump; Central air conditioning
- Interior features: Ceiling fans; Window treatments (blinds)
- Laundry & utility: Dedicated laundry room
Neighborhood map
What this means for you Summary
Snapshot
- This is a 3-bed/1.0-bath single-family listed at $140k.
Deal economics
- At list price, monthly cash flow is $69 ($826/yr) — positive.
- The deal already cash-flows at list — no discount required.
- To meet the 1% rule (rent ≥ 1% of price), the offer needs to be $125k (10.7% below list).
- Recommended offer: $125k (10.7% below list) — sets the bar for 1% rule.
- Cap rate 6.9% vs local median 4.9% in Trenton — top-decile yield for the area; either an underpriced asset or a hidden risk that comps aren't pricing in. Stress-test before assuming the spread holds.
Location & tenants
- Location reads 77/100 on livability (#207 in FL, #3,078 nationally) — a middle-class / working-renter tenant base. Strengths: crime A+, cost of living A+, housing A+; Watch: amenities F, commute F, employment F.
- Gilchrist (rural): math 66% / reading 61% proficiency, ranked #9 of 73 in FL (top 12%) — acceptable for families but not a draw, mixed tenant base, ~2y average lease.
- Market conditions: 199 active listings in the ZIP; 1 comparable units currently listed for rent nearby; 94 units permitted in Gilchrist County in 2024 (0 in 5+ unit buildings).
Forward outlook
- In year one you build about $15k of equity ($968 loan paydown + $14k appreciation (10.0% local appreciation)).
- Gilchrist County population projected to shrink 6% by 2050 — rents likely to lag national; underwrite the cash flow, not the appreciation.
- At projected returns (10.0% appreciation + 3.0% rent growth), your $39k cash investment doubles in ~3 years — after that, you're playing with house money.
- By year 3, paydown + projected appreciation supports a ~$38k cash-out refi (75% LTV) — recoverable capital for the next deal without selling this one.
Negotiation context
- It's been on market 68 days — a 6% lower offer ($132k) is reasonable based on typical stale-listing flexibility.
- 4 sale attempts since 18y ago; this cycle's ask has dropped $35k (20%) from the opening price — seller is motivated, your offer sets the floor, not the list.
Risks & watch-outs
- Watch-outs: built in 1928 — expect roof / HVAC / electrical / plumbing capex.
Questions for the listing agent
- It's been on market 68 days. Have you received any prior offers? Is the seller open to a 11% concession, seller financing, or rate buy-down credit?
- Built in 1928 — when were the roof, HVAC, electrical panel, plumbing, and water heater last replaced?
- Why hasn't it sold? Are there any deal-killer items the seller is aware of (foundation, flood, title, zoning, code violations)?
- Is there a deadline driving the sale (1031 exchange, divorce, estate, relocation)? That informs how much negotiation room exists.
- Schools are B-rated — typically a magnet for longer-tenancy family renters. What's the average tenant stay here, and is there a school-zone premium baked into asking?
- What's the average days-on-market for RENTAL listings here right now (not sales)? A rising rental-DOM trend means longer vacancies and softer asking-rent achievability than the comps imply.
- What's the recent tenant-quality profile in this submarket — average credit score on applications, eviction rate, late-payment / NSF rate, and stable-employment percentage? A property-management company in the area should have these aggregated.
- How much new for-sale + rental construction is in the pipeline within 1–3 miles? Heavy new supply typically softens prices + rents 12–24 months out; constrained supply supports both.
Investment metrics
- 1% rule
- 0.89% ✗
- Cap rate
- 6.88%
- Cash-on-cash
- 2.11%
- DSCR
- 1.09
- GRM
- 9.3
CMA / ARV
- ARV (on-the-fly)
- $205,920
- Comps found
- 12
Show comp detail 12 sales within ~0.75 mi
| Address | Dist | Beds/Ba | Sqft | Sold | Price | $/sf | Match |
|---|---|---|---|---|---|---|---|
| 506 NE 2nd St | 0.44mi | 3/2.0 | 1,264 (+1%) | 4mo | $216,000 | $171 | 70 |
| 518 NE 2nd St | 0.45mi | 2/1.0 (-1) | 1,299 (+4%) | 2mo | $87,000 | $67 | 66 |
| 260 NE Trenton Blvd | 0.56mi | 3/2.0 | 1,253 (+0%) | 8mo | $219,000 | $175 | 63 |
| 110 NE Rowland Blvd | 0.52mi | 3/2.0 | 1,257 (+1%) | 11mo | $207,000 | $165 | 61 |
| 270 NE Trenton Blvd | 0.55mi | 3/2.0 | 1,253 (+0%) | 11mo | $217,500 | $174 | 61 |
| 104 NE Rowland Blvd | 0.54mi | 3/2.0 | 1,257 (+1%) | 11mo | $224,800 | $179 | 61 |
| 280 NE Trenton Blvd | 0.56mi | 3/2.0 | 1,253 (+0%) | 12mo | $219,000 | $175 | 60 |
| 330 SE 2nd Ave | 0.44mi | 3/1.0 | 1,128 (-10%) | 9mo | $49,000 | $43 | 56 |
| 220 SE 2nd St | 0.48mi | 3/1.0 | 1,114 (-11%) | 13mo | $98,000 | $88 | 49 |
| 504 NE 4th Ave | 0.33mi | 3/2.0 | 1,404 (+12%) | 15mo | $105,000 | $75 | 47 |
| 501 NW Second St | 0.71mi | 3/2.0 | 1,363 (+9%) | 7mo | $200,000 | $147 | 42 |
| 511 NW Second St | 0.73mi | 3/2.0 | 1,363 (+9%) | 7mo | $200,000 | $147 | 41 |
Match score weights: distance 35% · size 25% · config 20% · recency 20%. Top-matched comps best support the ARV.
Projected returns pro-forma
10.0% appreciation · 3.0% rent growth · sell at horizon
- IRR
- 25.8%
- Equity multiple
- 3.06×
- Total profit
- $80,623
- Equity at exit
- $126,123
- IRR
- 22.7%
- Equity multiple
- 6.97×
- Total profit
- $233,949
- Equity at exit
- $271,989
Cash invested: $39,200 (down + closing). Projections, not guarantees.
Landlord ↔ Tenant lean methodology
- Overall (STATE)
- 87 Strongly Landlord-Friendly
- State Florida
- 87 Strongly Landlord-Friendly · R+3
- County
- — inherits STATE
- City
- — inherits STATE
ZIP-level market 32693
- Home prices YoY
- 14.8%
- Active inventory
- 199
- Price-to-rent
- 9.3×
Monthly cashflow live
- Estimated rent
- $1,250 medium interval (Pro) →
- Mortgage (P&I)
- −$734
- Tax from tax record
- −$126 /mo · $1,514/yr
- Insurance
- −$58
- HOA
- −$0
- Vacancy / Maint / Mgmt
- −$262
- Net cashflow
- $69
Break-even live
UW: 25.0% down · 7.5% · 30yr · 1.5% tax · 5.0% vac · 8.0% maint · 8.0% mgmt
Financing live
Cash to close
- Down payment
- $35,000
- Closing costs
- $4,200
- Reserves months
- —
- Total cash needed
- —
Loan-product check · same deal, 3 products live
Conventional
25% down · 7.5% · 30yr
- Down + closing
- —
- Monthly P&I
- —
- Monthly cashflow
- —
- DSCR
- —
- Eligible?
- —
Personal DTI + credit; lowest rate.
DSCR
20% down · 8.5% · 30yr
- Down + closing
- —
- Monthly P&I
- —
- Monthly cashflow
- —
- DSCR
- —
- Eligible?
- —
No personal income docs; deal must DSCR.
Hard money
10% down · 12.0% · 12mo
- Down + closing
- —
- Monthly P&I
- —
- Monthly cashflow
- —
- DSCR
- —
- Eligible?
- —
Short-term bridge; refi at stabilization.
Rent comps 1 comps
| Address | Beds | Baths | Sqft | Rent | $/sqft | DOM | Units | Dist |
|---|---|---|---|---|---|---|---|---|
| 1102 NE 16th Ave Trenton, FL | 3.0 | 2.0 | 1056 | $1,250 | $1.18 | 13d | 1 | 0.65mi |
Listing history 14 events
-
2026-05-21price $140,000
-
2026-05-18status Active
-
2026-04-11status Pending
-
2026-03-30price $159,000
-
2026-03-07price $169,000
-
2026-02-12$175,000 Active
-
2022-09-07soldstatus $146,750
-
2022-08-31soldstatus $146,750 929-char remark
Show marketing remark (929 chars)
3/1 country style home in the heart of town! Take a look at this charming home originally built in 1928 sitting on a third of an acre and on a corner lot. Large open living room, spacious kitchen with plenty of counterspace and a separate dining room for family dinners on Sundays. Huge utility room at the back of the house with plenty of space for extra storage. The most charming thing about this home is the front porch. Imagine yourself sitting in the rocking chair enjoying a glass of sweet tea and chatting with the neighbors as they walk by or swinging on a porch swing with your loved ones. The backyard is large enough for the kids to run and play and there's even room for a small garden. Located just walking distance to local restaurants, shopping and doctors offices. A 30 minute drive to Gainesville for work, entertainment and UF Health. This beautiful home won't last long! Call today to schedule a private tour!
-
2022-07-07$149,900 929-char remark
Show marketing remark (929 chars)
3/1 country style home in the heart of town! Take a look at this charming home originally built in 1928 sitting on a third of an acre and on a corner lot. Large open living room, spacious kitchen with plenty of counterspace and a separate dining room for family dinners on Sundays. Huge utility room at the back of the house with plenty of space for extra storage. The most charming thing about this home is the front porch. Imagine yourself sitting in the rocking chair enjoying a glass of sweet tea and chatting with the neighbors as they walk by or swinging on a porch swing with your loved ones. The backyard is large enough for the kids to run and play and there's even room for a small garden. Located just walking distance to local restaurants, shopping and doctors offices. A 30 minute drive to Gainesville for work, entertainment and UF Health. This beautiful home won't last long! Call today to schedule a private tour!
-
2008-05-13soldstatus $86,900
-
2008-04-02$84,900
-
2008-04-01soldstatus $52,000
-
2002-03-12soldstatus $25,000
-
2001-11-06soldstatus $25,500
ⓘ Source: listings_history table (triggers on properties + properties_extension) + one-shot
backfill from property_details.listing_events for pre-trigger history.
Tax reassessment forecast FL · Resets to sale price
- Current annual tax
- $1,514 · $126/mo
- Projected year-2 tax
- $1,514 · $126/mo
- Expected delta
- $0/yr ($0/mo · 0.0%)
ⓘ Screening estimate from a state-policy table — verify with the county assessor before closing.
Nearby sold comps map
Loading sold comps map…
Walkable amenities ~0.75 mi
Loading nearby amenities…
Taxation est. · year 1
- Rental income
- $15,000
- − Mortgage interest
- −$7,842
- − Property taxes
- −$1,514
- − Insurance
- −$700
- − Repairs & maintenance
- −$1,200
- − Management
- −$1,200
- − Depreciation
- −$4,073
- Taxable loss
- −$1,528
- Est. tax savings @ 24.0%
- +$367
- After-tax cash flow
- $1,193/yr
For passive investors: Depreciation is non-cash, so a rental often shows a tax loss while cash-flowing — sheltering income. Rental losses are passive: they offset passive income freely, and up to $25,000/yr can offset ordinary (W-2) income if you actively participate and your MAGI is under $100k (phasing out to $0 by $150k); unused losses carry forward. On sale, claimed depreciation is recaptured at up to 25%, and gains may owe capital-gains tax (a 1031 exchange can defer both). Figures are a year-1 estimate at your 24.0% rate — not tax advice; consult a CPA.
Schools (NCES district)
- District
- Gilchrist
- NCES district ID
- 1200630
- Math proficiency
- 66% ▼ -4.00%
- Reading proficiency
- 61% ▼ -5.00%
- Median HH income
- $39,610
- Composite
- 53.01/100
- National rank
- #1522
- State rank
- #9 of 73 in FL
Livability — Trenton
- Score
- 77/100
- State rank
- #207
- US rank
- #3078
Category grades
Schools grade is shown separately in the Schools card above.
Census & demographics
- Census place
- Trenton, FL
- Population (ZIP)
- 11,692
Population outlook (Gilchrist County) Hauer SSP2
- Today (2025)
- 17,730 people
- By 2030
- 17,722 · +-0.0%
- By 2040
- 17,393 · -1.9%
- By 2050
- 16,597 · -6.4%
- By 2075
- 14,300 · -19.3%
- By 2100
- 11,498 · -35.1%
Race, ethnicity, and origin ACS 2023
- Neighborhood character
- Predominantly White (82%)
- Race & ethnicity
- White 82% Hispanic / Latino 8% Two or more races 7% Black 5%
- Hispanic origin (detail)
- Mexican 2% Puerto Rican 3%
- Common ancestry
- Lithuanian 4% Slovak 3% Romanian 1%
- Foreign-born
- 4% · Canada
- Languages at home
- 94% English-only · Spanish 5%
Political lean MEDSL · Gilchrist
- 2024 margin
- Solid R (+68.0) · D 15.6% · R 83.6%
- 2008→2024 swing
- -21.2pp toward R · 2008: -46.8pp · 2024: -68.0pp
- All cycles
- 2024: R+68.0 2020: R+64.0 2016: R+62.8 2012: R+51.0 2008: R+46.8
Not yet ingested
- Civics
- —
Market trends
- HPI YoY
- ▲ 46.81%
- Current HPI
- 363.4299
- Rent YoY
- —
- Metro
- —
- State GDP YoY
- ▲ 3.28%
- F500 in state
- 36
Industry mix (Fortune 500 HQ in FL)
| Industry | F500 HQs | Revenue |
|---|---|---|
| Industrial Technology | 2 | $29B |
|
||
| Insurance | 2 | $17B |
|
||
| Retail | 1 | $60B |
|
||
| Technology Distribution | 1 | $58B |
|
||
| Homebuilding | 1 | $35B |
|
||
| Technology Manufacturing | 1 | $35B |
|
||
Price history
+449.0% since first listed14 events — show timeline
- 2026-05-21 Price Changed $140,000 Stellar MLS as Distributed by MLS Grid
- 2026-05-18 Relisted — Stellar MLS as Distributed by MLS Grid
- 2026-04-11 Pending — Stellar MLS as Distributed by MLS Grid
- 2026-03-30 Price Changed $159,000 Stellar MLS as Distributed by MLS Grid
- 2026-03-07 Price Changed $169,000 Stellar MLS as Distributed by MLS Grid
- 2026-02-12 Listed $175,000 Stellar MLS as Distributed by MLS Grid
- 2022-09-07 Sold (Public Records) $146,750 Public Records
- 2022-08-31 Sold (MLS) $146,750 DGLMLS
- 2022-07-07 Listed $149,900 DGLMLS
- 2008-05-13 Sold (Public Records) $86,900 Public Records
- 2008-04-02 Listed $84,900 Stellar MLS as Distributed by MLS Grid
- 2008-04-01 Sold (Public Records) $52,000 Public Records
- 2002-03-12 Sold (Public Records) $25,000 Public Records
- 2001-11-06 Sold (Public Records) $25,500 Public Records
Property tax history
+2.9%/yrLatest (2025): $1,514 · +2.8% YoY. Source: county tax records.
Cash-flow waterfall
monthlySold comps — $/sqft
last 12 mo · ≤1 miLoading sold comps…