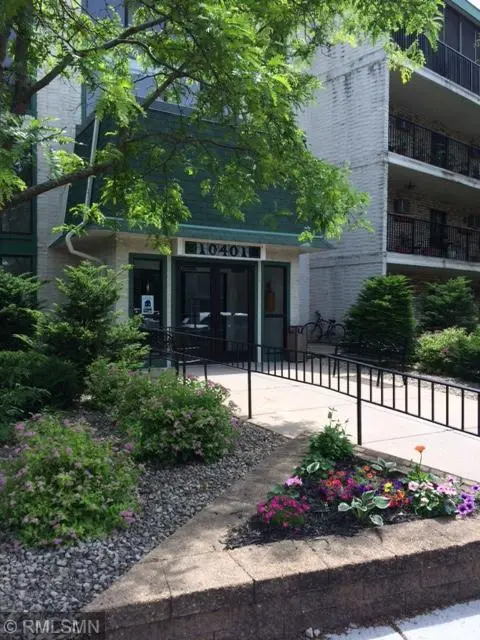
10401 Cedar Lake Rd #215 · Minnetonka, MN
Flood risk 1/10 · Minimal
- FEMA flood zone
- X (unshaded)
- Chance of flooding over 30 yrs
- 0.0%
- Est. flood insurance / yr
- $507 – $1,088
Fire risk 1/10 · Minimal
- Est. fire insurance / yr
- $888 – $1,650
Heat risk 2/10 · Minimal
- Hot days now (above 98°F)
- 7 days/yr
- Hot days in 30 yrs
- 14 days/yr
Wind risk 2/10 · Minimal
- Chance of severe wind over 30 yrs
- —
Air-quality risk 2/10 · Minimal
- Unhealthy air days now
- 2 days/yr
- Unhealthy air days in 30 yrs
- 2 days/yr
Risk factors via First Street. Map © Google.
Why this score? — see what drove the D grade
The composite is a weighted blend of 9 inputs, each scored 0–100. Each bar is that input's sub-score; the figure is the points it added to the 100-point composite (weight × sub-score).
- Cash flow +10.9/30.0
- 1% rule +8.2/10.0
- ARV discount +7.5/15.0
- Schools +4.6/10.0
- Livability +3.8/5.0
- Rent growth +3.3/5.0
- DSCR +3.1/10.0
- Condition / age +2.5/5.0
- Appreciation +0.0/10.0
$109,000
🖨 Deal sheet (PDF) 📄 Offer letter ✓ Due diligence
Listing remarks
Great value in amenity-rich Greenbriar Village! This unit is conveniently located on the ground level, with easy access to the parking lot and amenities, it's so handy for visitors! Sweet location near trails along Minnehaha Creek for walking and biking and easy access to highways and byways for scooting around town. Amenities include indoor and outdoor pools, fitness center, guest suites, party room, and tennis courts. The unit has two sliding doors that provide good natural light and great storage including a 6x6 storage closet, and linen, entry, and bedroom closets. Seller willing to have unit professionally painted prior to closing.
Key facts
- Fitness center
- Guest suites
- Party room
Tags
Property features AI
Finance
- HOA & community: HOA managed by Gassen Management; Monthly association fee of $459; Association includes heating, water, sewer, lawn care, grounds maintenance, snow removal, professional management and shared amenities; Building amenities: laundry, elevator(s), lobby entrance, tennis courts, clubhouse/party room
Exterior
- Parking: Assigned parking; Attached heated garage with garage door opener (1 garage space); Underground parking; Guest parking
- Utilities: City water connected; City sewer connected; Natural gas; Circuit breaker electric
- Home design: Attached residential unit; One level; Poured concrete foundation
- Construction: Poured concrete foundation; Foundation area 840
- Exterior features: Stone exterior; Patio (28 x 6); Shared heated indoor pool
Interior
- Kitchen: Dishwasher; Microwave; Range; Refrigerator
- Bedrooms: Main floor bedroom (1 bedroom, 14 x 12)
- Bathrooms: Main floor full bath (1 full bath)
- Heating & cooling: Baseboard heating (hot water); Wall unit cooling
- Interior features: Ceiling fan(s); Informal dining room; No internal stairs
- Laundry & utility: Common area laundry on main level
Neighborhood map
What this means for you Summary
Snapshot
- This is a 1-bed/1.0-bath condo listed at $109k.
Deal economics
- At list price, monthly cash flow is $-49 ($-584/yr) — negative.
- To cash-flow at today's rent, offer at most $100k (7.9% below list).
- Meets the 1% rule at list price ($1k rent vs $109k).
- Recommended offer: $100k (7.9% below list) — sets the bar for cash-flow.
- Cap rate 5.8% vs local median 2.4% in Minnetonka — top-decile yield for the area; either an underpriced asset or a hidden risk that comps aren't pricing in. Stress-test before assuming the spread holds.
Location & tenants
- Location reads 75/100 on livability (#187 in MN, #3,994 nationally) — a middle-class / working-renter tenant base. Strengths: employment A+, housing A+, crime A-; Watch: amenities F, cost of living F, health & safety F.
- Hopkins Public School District (suburban): math 48% / reading 57% proficiency, ranked #75 of 301 in MN (top 25%) — acceptable for families but not a draw, mixed tenant base, ~2y average lease.
- Zoned schools: L.H. Tanglen Elementary (math 42% / reading 56%, grade D, #475 of 857 statewide, top 56%, 559 students, 50% FRL); Hopkins North Junior High (math 42% / reading 61%, grade C, #65 of 258 statewide, top 26%, 888 students, 40% FRL); Hopkins Senior High (math 52% / reading 63%, grade C, #59 of 471 statewide, top 13%, 1,491 students, 40% FRL).
- Market conditions: Rents rising (+3.3%/yr); 123 active listings in the ZIP; 36 comparable units currently listed for rent nearby; rentals leasing fast (median 7d on market — plan ~1-2 weeks tenant-placement turnaround); solid renter incomes; 4,651 units permitted in Hennepin County in 2024 (2,443 in 5+ unit buildings).
- This rent is only 16% of the median local income ($105k/yr) — well below the 30% rent-burden line; pricing power to push rent on renewal without tenant pushback.
Forward outlook
- Local home prices are declining (-3.0%/yr); year-one equity from $754 of loan paydown is wiped out by about $3k of value loss. Plan a longer hold.
- Hennepin County population projected at +30% by 2050 — long-run rental-demand tailwind backs the buy-and-hold thesis.
Negotiation context
- It's been on market 32 days — a 3% lower offer ($106k) is reasonable based on typical stale-listing flexibility.
- 7 sale attempts since 34y ago with the ask held roughly flat each time — persistent listings suggest the price (not the market) is what's stuck; bring a comps-based counter.
Risks & watch-outs
- Watch-outs: HOA is 32% of rent.
Questions for the listing agent
- What do current leases actually rent for vs. the listed asking? Can we see a recent rent roll and the last 12 months of T-12 income?
- It's been on market 32 days. Have you received any prior offers? Is the seller open to a 8% concession, seller financing, or rate buy-down credit?
- Built in 1975 — when were the roof, HVAC, electrical panel, plumbing, and water heater last replaced?
- What does the HOA fee cover, when was the last increase, and are there any pending special assessments or reserve-fund shortfalls?
- Any open or pending special assessments — roof, HVAC, plumbing, elevator, façade? What's the per-unit balance and payoff schedule, and is the seller paying it off at close or rolling it to the buyer?
- Is there a deadline driving the sale (1031 exchange, divorce, estate, relocation)? That informs how much negotiation room exists.
- Schools are A-rated — typically a magnet for longer-tenancy family renters. What's the average tenant stay here, and is there a school-zone premium baked into asking?
- The area grade is low — what's the realistic commute time and amenity access for the typical tenant pool here? Any planned neighborhood developments (good or bad) we should know about?
- What's the average days-on-market for RENTAL listings here right now (not sales)? A rising rental-DOM trend means longer vacancies and softer asking-rent achievability than the comps imply.
- What's the recent tenant-quality profile in this submarket — average credit score on applications, eviction rate, late-payment / NSF rate, and stable-employment percentage? A property-management company in the area should have these aggregated.
- How much new apartment / multifamily construction is in the pipeline within 1–3 miles? Heavy new supply (>2% of stock underway) typically softens rents 12–24 months out; light construction supports rent growth.
Investment metrics
- 1% rule
- 1.32% ✓
- Cap rate
- 5.76%
- Cash-on-cash
- -1.91%
- DSCR
- 0.91
- GRM
- 6.3
CMA / ARV
No comps found within radius.
Projected returns pro-forma
-3.0% appreciation · 3.28% rent growth · sell at horizon
- IRR
- -18.6%
- Equity multiple
- 0.34×
- Total profit
- $-20,073
- Equity at exit
- $16,252
- IRR
- -9.6%
- Equity multiple
- 0.39×
- Total profit
- $-18,643
- Equity at exit
- $9,424
Cash invested: $30,520 (down + closing). Projections, not guarantees.
Landlord ↔ Tenant lean methodology
- Overall (STATE)
- 46 Balanced
- State Minnesota
- 46 Balanced · D+2
- County
- — inherits STATE
- City
- — inherits STATE
ZIP-level market 55305
- Rents YoY
- 3.3%
- Active inventory
- 123
- Price-to-rent
- 6.3×
Monthly cashflow live
- Estimated rent
- $1,434 high interval (Pro) →
- Mortgage (P&I)
- −$572
- Tax from tax record
- −$105 /mo · $1,263/yr
- Insurance
- −$45
- HOA
- −$459
- Vacancy / Maint / Mgmt
- −$301
- Net cashflow
- $-49
Break-even live
Sensitivity live
| Price | -10% $13 | -5% $-18 | +0% $-49 | +5% $-80 | +10% $-110 |
|---|---|---|---|---|---|
| Rent | -10% $-162 | -5% $-105 | +0% $-49 | +5% $8 | +10% $65 |
| Rate | -1.0pp $6 | -0.5pp $-21 | base $-49 | +0.5pp $-77 | +1.0pp $-106 |
UW: 25.0% down · 7.5% · 30yr · 1.5% tax · 5.0% vac · 8.0% maint · 8.0% mgmt
Financing live
Cash to close
- Down payment
- $27,250
- Closing costs
- $3,270
- Reserves months
- —
- Total cash needed
- —
Loan-product check · same deal, 3 products live
Conventional
25% down · 7.5% · 30yr
- Down + closing
- —
- Monthly P&I
- —
- Monthly cashflow
- —
- DSCR
- —
- Eligible?
- —
Personal DTI + credit; lowest rate.
DSCR
20% down · 8.5% · 30yr
- Down + closing
- —
- Monthly P&I
- —
- Monthly cashflow
- —
- DSCR
- —
- Eligible?
- —
No personal income docs; deal must DSCR.
Hard money
10% down · 12.0% · 12mo
- Down + closing
- —
- Monthly P&I
- —
- Monthly cashflow
- —
- DSCR
- —
- Eligible?
- —
Short-term bridge; refi at stabilization.
Rent comps 36 comps
| Address | Beds | Baths | Sqft | Rent | $/sqft | DOM | Units | Dist |
|---|---|---|---|---|---|---|---|---|
| 10401 Cedar Lake Rd #505 Hopkins, MN | 1.0 | 1.0 | 600 | $1,295 | $2.16 | 1d | 1 | 0.01mi |
| 10401 Cedar Lake Rd #505 Hopkins, MN | 1.0 | 1.0 | 600 | $1,395 | $2.33 | 45d | 1 | 0.01mi |
| 10401 Cedar Lk Rd S Minnetonka, MN | 1.0 | 1.0 | 600 | $1,295 | $2.16 | 3d | 1 | 0.01mi |
| 10201 Cedar Lake Rd S Unit 201-101 Minnetonka, MN | 2.0 | 1.5 | 1038 | $1,499 | $1.44 | 19d | 1 | 0.17mi |
| 2828 Jordan Ave S Minnetonka, MN | 1.0–3.0 | 1.0–2.0 | 1008 | $1,359 | $1.35 | 6d | 9 | 0.46mi |
| 10100 Minnetonka Blvd Hopkins, MN | 2.0 | 1.0 | 950 | $1,400 | $1.47 | 45d | 1 | 0.60mi |
| 9700 Waterstone Pl Hopkins, MN | 1.0–2.0 | 1.0–2.0 | 1014 | $1,769 | $1.74 | 0d | 15 | 0.65mi |
| 10213 W 34th St Unit 10213-204 Minnetonka, MN | 2.0 | 1.0 | 948 | $1,850 | $1.95 | 5d | 1 | 0.78mi |
| 10213 W 34th St Unit 10233-302 Minnetonka, MN | 2.0 | 1.0 | 953 | $1,650 | $1.73 | 5d | 1 | 0.78mi |
| 10213 W 34th St Unit 10213-302 Minnetonka, MN | 2.0 | 1.0 | 948 | $1,995 | $2.10 | 5d | 1 | 0.78mi |
| 10213 W 34th St Unit 10213-202 Minnetonka, MN | 2.0 | 1.0 | 948 | $1,795 | $1.89 | 5d | 1 | 0.78mi |
| 10213 W 34th St Unit 10233-304 Minnetonka, MN | 1.0 | 1.0 | 700 | $1,350 | $1.93 | 5d | 1 | 0.78mi |
| 10213 W 34th St Minnetonka, MN | 1.0 | 1.0 | 707 | $1,295 | $1.83 | 5d | 1 | 0.78mi |
| 10213 W 34th St Unit 10253-103 Minnetonka, MN | 1.0 | 1.0 | 707 | $1,350 | $1.91 | 6d | 1 | 0.78mi |
| 10233 W 34th St Unit 10233-302 Minnetonka, MN | 2.0 | 1.0 | 953 | $1,650 | $1.73 | 0d | 1 | 0.80mi |
| 10253 W 34th St Unit 10253-103 Hopkins, MN | 1.0 | 1.0 | 707 | $1,295 | $1.83 | 0d | 1 | 0.83mi |
| 1919 Ymca Ln Hopkins, MN | 1.0–2.0 | 1.0–2.0 | 1023 | $1,545 | $1.51 | 0d | 5 | 1.31mi |
| 8824 W 35th St Unit 9 Minneapolis, MN | 1.0 | 1.0 | 700 | $1,065 | $1.52 | 26d | 1 | 1.32mi |
| 8817 W 35th St Minneapolis, MN | 1.0–2.0 | 1.0 | 787 | $1,175 | $1.49 | 6d | 2 | 1.34mi |
| 3033 Xylon Ave S Minneapolis, MN | 2.0 | 1.0 | 837 | $1,262 | $1.51 | 6d | 2 | 1.34mi |
| 1301 Highway 7 Hopkins, MN | 1.0–2.0 | 1.0 | 786 | $1,235 | $1.57 | 1d | 13 | 1.34mi |
| 8801 W 35th St Minneapolis, MN | 1.0 | 1.0 | 650 | $1,025 | $1.58 | 45d | 1 | 1.36mi |
| 3544 Aquila Cir Unit 8 St Louis Park, MN | 2.0 | 1.0 | 800 | $1,299 | $1.62 | 45d | 1 | 1.38mi |
| 3601 Phillips Pkwy Minneapolis, MN | 3.0 | 1.0–2.0 | 920 | $1,793 | $1.95 | 0d | 12 | 1.40mi |
| 8216 W 31st St Unit 08 Minneapolis, MN | 2.0 | 1.0 | 950 | $1,250 | $1.32 | 6d | 1 | 1.40mi |
| 8216 W 31st St Unit 07 Minneapolis, MN | 2.0 | 1.0 | 950 | $1,250 | $1.32 | 26d | 1 | 1.40mi |
| 8201 W 30 1/2 St Minneapolis, MN | 2.0 | 1.0 | 850 | $1,295 | $1.52 | 6d | 1 | 1.42mi |
| 8200 W 31st St Minneapolis, MN | 1.0 | 1.0 | 689 | $1,100 | $1.60 | 45d | 2 | 1.44mi |
| 3055 Virginia Ave S Unit 3055-12 St Louis Park, MN | 1.0 | 1.0 | 675 | $1,075 | $1.59 | 25d | 1 | 1.47mi |
| 3055 Virginia Ave S St Louis Park, MN | 1.0 | 1.0 | 675 | $1,075 | $1.59 | 45d | 1 | 1.47mi |
| 3055 Virginia Ave S Unit 3055-2 St Louis Park, MN | 1.0 | 1.0 | 550 | $1,199 | $2.18 | 26d | 1 | 1.47mi |
| 3055 Virginia Ave S Unit 3063-18 St Louis Park, MN | 1.0 | 1.0 | 700 | $1,075 | $1.54 | 6d | 1 | 1.47mi |
| 3063 Virginia Ave S Minneapolis, MN | 1.0 | 1.0 | 700 | $1,075 | $1.54 | 6d | 1 | 1.47mi |
| 3101 Virginia Ave S Minneapolis, MN | 2.0 | 1.0–1.5 | 850 | $1,360 | $1.60 | 3d | 4 | 1.47mi |
| 3117 Virginia Ave S Unit 102 Minneapolis, MN | 2.0 | 1.0 | 970 | $1,425 | $1.47 | 45d | 1 | 1.49mi |
| 11700 Wayzata Blvd Hopkins, MN | 1.0–2.0 | 1.0–2.0 | 1079 | $1,645 | $1.52 | 0d | 15 | 1.50mi |
HOA detail condo
- Monthly dues
- $459 · $5,508/yr
- Likely covers
- poolgym
- Assessments
- None detected in remarks — confirm with the listing agent.
Listing history 37 events
-
2026-06-21statusdays on market $109,000 Pending 32 DOM
-
2026-06-18days on market $109,000 Contingent - Subject to Statutory Rescission 30 DOM
-
2026-06-17days on market $109,000 Contingent - Subject to Statutory Rescission 29 DOM
-
2026-06-16days on market $109,000 Contingent - Subject to Statutory Rescission 28 DOM
-
2026-06-15days on market $109,000 Contingent - Subject to Statutory Rescission 27 DOM
-
2026-06-13days on market $109,000 Contingent - Subject to Statutory Rescission 25 DOM
-
2026-06-13days on market $109,000 Contingent - Subject to Statutory Rescission 24 DOM
-
2026-06-09days on market $109,000 Contingent - Subject to Statutory Rescission 21 DOM
-
2026-06-08days on market $109,000 Contingent - Subject to Statutory Rescission 20 DOM
-
2026-06-07days on market $109,000 Contingent - Subject to Statutory Rescission 19 DOM
-
2026-06-04days on market $109,000 Contingent - Subject to Statutory Rescission 16 DOM
-
2026-06-03days on market $109,000 Contingent - Subject to Statutory Rescission 15 DOM
-
2026-06-02statusdays on market $109,000 Contingent - Subject to Statutory Rescission 14 DOM
-
2026-06-01days on market $109,000 Contingent - Inspection 13 DOM
-
2026-05-31days on market $109,000 Contingent - Inspection 12 DOM
-
2026-05-19$109,000 Active 644-char remark
-
2026-05-16historical
-
2026-04-09$115,000 Active
-
2026-04-09historical
-
2026-03-06price $123,500
-
2026-01-20price $129,900
-
2025-11-14$135,000 Active
-
2025-11-10historical
-
2019-07-24soldstatus $115,000
-
2019-07-15soldstatus $115,000 Sold
-
2019-07-12historical Contingent - Inspection
-
2019-07-03$118,500 Active
-
2010-08-17soldstatus $41,500
-
2010-07-23historical
-
2010-05-06$43,000
-
1999-01-26soldstatus $65,000
-
1998-12-31soldstatus $65,000
-
1998-12-02historical
-
1998-11-16$64,900
-
1992-11-17soldstatus $39,500
-
1992-08-29soldstatus $39,500
-
1992-03-10$40,900
ⓘ Source: listings_history table (triggers on properties + properties_extension) + one-shot
backfill from property_details.listing_events for pre-trigger history.
Tax reassessment forecast MN · Partial reset (capped growth)
- Current annual tax
- $1,263 · $105/mo
- Projected year-2 tax
- $1,263 · $105/mo
- Expected delta
- $0/yr ($0/mo · 0.0%)
ⓘ Screening estimate from a state-policy table — verify with the county assessor before closing.
Climate risk First Street
- Flood 1/10 Low FEMA zone X (unshaded) · 0% chance over 30 yrs
- Wildfire 1/10 Low
- Heat 2/10 Low 7 d/yr ≥98°F today · 14 d/yr by 30 yrs out
- Wind 2/10 Low
- Air quality 2/10 Low 2 unhealthy d/yr today · 2 by 30 yrs out
Nearby sold comps map
Loading sold comps map…
Walkable amenities ~0.75 mi
Loading nearby amenities…
Taxation est. · year 1
- Rental income
- $17,204
- − Mortgage interest
- −$6,106
- − Property taxes
- −$1,263
- − Insurance
- −$545
- − Repairs & maintenance
- −$1,376
- − Management
- −$1,376
- − HOA
- −$5,508
- − Depreciation
- −$3,171
- Taxable loss
- −$2,141
- Est. tax savings @ 24.0%
- +$514
- After-tax cash flow
- $-70/yr
For passive investors: Depreciation is non-cash, so a rental often shows a tax loss while cash-flowing — sheltering income. Rental losses are passive: they offset passive income freely, and up to $25,000/yr can offset ordinary (W-2) income if you actively participate and your MAGI is under $100k (phasing out to $0 by $150k); unused losses carry forward. On sale, claimed depreciation is recaptured at up to 25%, and gains may owe capital-gains tax (a 1031 exchange can defer both). Figures are a year-1 estimate at your 24.0% rate — not tax advice; consult a CPA.
Schools (NCES district)
- District
- Hopkins Public School District
- NCES district ID
- 2714260
- Math proficiency
- 48% ▼ -6.00%
- Reading proficiency
- 57% ▼ -2.00%
- Median HH income
- $66,915
- Composite
- 46.44/100
- National rank
- #2448
- State rank
- #75 of 301 in MN
Livability — Minnetonka
- Score
- 75/100
- State rank
- #187
- US rank
- #3994
Category grades
Schools grade is shown separately in the Schools card above.
Census & demographics
- Census place
- Minnetonka, MN
- County
- Hennepin County · 1,150,272 people
- City population
- 41,857
- Metro
- Minneapolis-St. Paul-Bloomington, MN-WI
- Population (ZIP)
- 21,068
- Household income
- $104,914
- Rent vs Own
- Severe rent burden
- 949.0
Population outlook (Hennepin County) Hauer SSP2
- Today (2025)
- 1,405,227 people
- By 2030
- 1,492,650 · +6.2%
- By 2040
- 1,660,157 · +18.1%
- By 2050
- 1,823,498 · +29.8%
- By 2075
- 2,221,283 · +58.1%
- By 2100
- 2,509,976 · +78.6%
Race, ethnicity, and origin ACS 2023
- Neighborhood character
- Predominantly White (78%)
- Race & ethnicity
- White 78% Asian 10% Two or more races 5% Hispanic / Latino 4% Black 4%
- Common ancestry
- Portuguese 11% Lithuanian 3% Romanian 3%
- Foreign-born
- 14% · Canada, China, South Korea
- Languages at home
- 84% English-only · Other Asian/Pacific 6% Other Indo-European 2% Spanish 2%
Political lean MEDSL · Hennepin
- 2024 margin
- Solid D (+42.6) · D 70.2% · R 27.5% · Other 2.3%
- 2008→2024 swing
- +14.0pp toward D · 2008: 28.6pp · 2024: 42.6pp
- All cycles
- 2024: D+42.6 2020: D+43.2 2016: D+35.3 2012: D+27.1 2008: D+28.6
Not yet ingested
- Civics
- —
Market trends
- HPI YoY
- ▼ -358.96%
- Current HPI
- 231.3421
- Rent YoY
- ▲ 3.28%
- Metro
- Minneapolis-St. Paul-Bloomington, MN-WI
- State GDP YoY
- ▲ 2.41%
- F500 in state
- 34
Industry mix (Fortune 500 HQ in MN)
| Industry | F500 HQs | Revenue |
|---|---|---|
| Healthcare | 2 | $407B |
|
||
| Retail | 2 | $150B |
|
||
| Consumer Goods | 2 | $32B |
|
||
| Industrial Machinery | 2 | $6B |
|
||
| Agriculture | 1 | $40B |
|
||
| Healthcare / Medical Devices | 1 | $32B |
|
||
Price history
+166.5% since first listed23 events — show timeline
- 2026-05-29 Contingent — NORTHSTARMLS as Distributed by MLS Grid
- 2026-05-19 Listed $109,000 NORTHSTARMLS as Distributed by MLS Grid
- 2026-05-16 Listing Removed — NORTHSTARMLS as Distributed by MLS Grid
- 2026-04-09 Listing Removed — NORTHSTARMLS as Distributed by MLS Grid
- 2026-04-09 Listed $115,000 NORTHSTARMLS as Distributed by MLS Grid
- 2026-03-06 Price Changed $123,500 NORTHSTARMLS as Distributed by MLS Grid
- 2026-01-20 Price Changed $129,900 NORTHSTARMLS as Distributed by MLS Grid
- 2025-11-14 Listed $135,000 NORTHSTARMLS as Distributed by MLS Grid
- 2025-11-10 Coming Soon — NORTHSTARMLS as Distributed by MLS Grid
- 2019-07-24 Sold (Public Records) $115,000 Public Records
- 2019-07-15 Sold (MLS) $115,000 NORTHSTARMLS as Distributed by MLS Grid
- 2019-07-12 Contingent — NORTHSTARMLS as Distributed by MLS Grid
- 2019-07-03 Listed $118,500 NORTHSTARMLS as Distributed by MLS Grid
- 2010-08-17 Sold (MLS) $41,500 NORTHSTARMLS as Distributed by MLS Grid
- 2010-07-23 Listing Removed — NORTHSTARMLS as Distributed by MLS Grid
- 2010-05-06 Listed $43,000 NORTHSTARMLS as Distributed by MLS Grid
- 1999-01-26 Sold (Public Records) $65,000 Public Records
- 1998-12-31 Sold (MLS) $65,000 NORTHSTARMLS as Distributed by MLS Grid
- 1998-12-02 Listing Removed — NORTHSTARMLS as Distributed by MLS Grid
- 1998-11-16 Listed $64,900 NORTHSTARMLS as Distributed by MLS Grid
- 1992-11-17 Sold (Public Records) $39,500 Public Records
- 1992-08-29 Sold (MLS) $39,500 NORTHSTARMLS as Distributed by MLS Grid
- 1992-03-10 Listed $40,900 NORTHSTARMLS as Distributed by MLS Grid
Property tax history
+1.3%/yrLatest (2025): $1,263 · -12.8% YoY. Source: county tax records.
Cash-flow waterfall
monthlySold comps — $/sqft
last 12 mo · ≤1 miLoading sold comps…