415 Baytree Dr · Rotonda, FL
Flood risk 9/10 · Severe
- FEMA flood zone
- X (shaded)
- Chance of flooding over 30 yrs
- 0.99%
- Est. flood insurance / yr
- $507 – $1,088
Fire risk 4/10 · Minor
- Est. fire insurance / yr
- $947 – $1,759
Heat risk 10/10 · Severe
- Hot days now (above 107°F)
- 6 days/yr
- Hot days in 30 yrs
- 22 days/yr
Wind risk 10/10 · Severe
- Chance of severe wind over 30 yrs
- 99.0%
Air-quality risk 2/10 · Minimal
- Unhealthy air days now
- 1 days/yr
- Unhealthy air days in 30 yrs
- 1 days/yr
Risk factors via First Street. Map © Google.
Why this score? — see what drove the D grade
The composite is a weighted blend of 9 inputs, each scored 0–100. Each bar is that input's sub-score; the figure is the points it added to the 100-point composite (weight × sub-score).
- Cash flow +10.3/30.0
- ARV discount +7.5/15.0
- Appreciation +5.6/10.0
- Schools +4.6/10.0
- Livability +3.4/5.0
- 1% rule +3.2/10.0
- DSCR +3.0/10.0
- Condition / age +2.5/5.0
- Rent growth +2.4/5.0
$289,900
🖨 Deal sheet 📄 Offer letter ✓ Due diligence
Listing remarks MLS
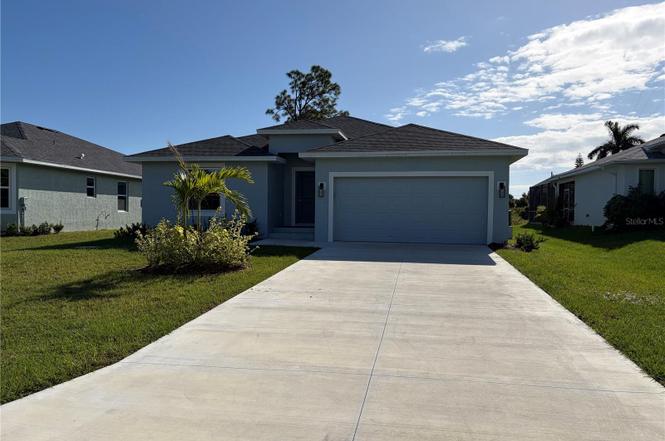
Large corner facing lot with southeast exposure or choice to orient for differnet exposures. Easy drive to beaches, shopping , restaurants and Charlotte Sports Park, home of Rays Spring Training and Stone Crabs minor league baseball. THIS LOT IS IN A SCRUBJAY HAZARD ZONE ACCORDING TO THE COUNTY WEBSITE AT LISTING.
Key facts
- Spacious island
- Walk-in closet
- French doors
Tags
Property features AI
Finance
- Other: Total acreage: 0.23 acres; Living area reported by builder: 1,606 sq ft (building area 2,227 sq ft); Lot size approximately 0.23 acres (912 m²)
- HOA & community: HOA managed by Precedent Hospitality Management; HOA required; $270 annually ($22.50 monthly); Pets allowed
Exterior
- Parking: Attached 2-car garage
- Utilities: Public water; Public sewer; Electricity connected
- Home design: Single family residence; One story; Southeast facing; Residential property, completed; Projected completion April 27, 2026
- Construction: Block and stucco construction; Shingle roof; Block foundation; Slab foundation; New construction (builder: Snyder Construction, model: Seabreeze 1, permit 20231278470); Built/finished by builder
- Exterior features: French doors; Hurricane shutters; Asphalt roadway
Interior
- Kitchen: Dishwasher; Disposal; Microwave; Range; Refrigerator
- Bedrooms: 3 bedrooms
- Flooring: Tile flooring
- Bathrooms: 2 full bathrooms
- Heating & cooling: Electric heating; Central air conditioning
- Interior features: Ceiling fans; Living room/dining room combo; Open floorplan; Stone countertops; Walk-in closets
- Laundry & utility: Dedicated laundry room; Washer hookup
Neighborhood map
What this means for you Summary
Snapshot
- This is a 3-bed/2.0-bath land listed at $290k.
Deal economics
- At list price, monthly cash flow is $-223 ($-3k/yr) — negative.
- To cash-flow at today's rent, offer at most $258k (11.1% below list).
- To meet the 1% rule (rent ≥ 1% of price), the offer needs to be $237k (18.4% below list).
- Recommended offer: $237k (18.4% below list) — sets the bar for 1% rule.
- Cap rate 5.6% vs local median 3.1% in Rotonda — top-decile yield for the area; either an underpriced asset or a hidden risk that comps aren't pricing in. Stress-test before assuming the spread holds.
Location & tenants
- Location reads 67/100 on livability (#548 in FL) — a middle-class / working-renter tenant base. Strengths: crime A+, housing A-, cost of living B+; Watch: schools D, amenities F, commute F.
- Charlotte (suburban): math 54% / reading 54% proficiency, ranked #22 of 73 in FL (top 30%) — acceptable for families but not a draw, mixed tenant base, ~2y average lease.
- Market conditions: Rents soft (-0.2%/yr); 863 active listings in the ZIP; 31 comparable units currently listed for rent nearby; rentals at typical pace (median 21d on market — plan ~3-4 weeks tenant-placement turnaround); solid renter incomes; 4,585 units permitted in Charlotte County in 2024 (703 in 5+ unit buildings).
- This rent runs 35% of the median local income ($80k/yr) — at the standard rent-burdened threshold; future hikes will face affordability resistance.
Forward outlook
- In year one you build about $6k of equity ($2k loan paydown + $4k appreciation (1.2% local appreciation)).
- Charlotte County population projected at +24% by 2050 — long-run rental-demand tailwind backs the buy-and-hold thesis.
- By year 6, paydown + projected appreciation supports a ~$31k cash-out refi (75% LTV) — recoverable capital for the next deal without selling this one.
Negotiation context
- It's been on market 140 days — a 12% lower offer ($255k) is reasonable based on typical stale-listing flexibility.
- 2 sale attempts since 14y ago with the ask held roughly flat each time — persistent listings suggest the price (not the market) is what's stuck; bring a comps-based counter.
Risks & watch-outs
- Watch-outs: flood insurance adds $66/mo.
- Climate carrying-cost: severe flood risk; severe wind risk, 99% chance of damaging wind over 30y; extreme-heat days projected 6→22/yr by 2055 (HVAC capex compounding) — expect insurance premiums to compound above CPI over the hold.
Questions for the listing agent
- What do current leases actually rent for vs. the listed asking? Can we see a recent rent roll and the last 12 months of T-12 income?
- It's been on market 140 days. Have you received any prior offers? Is the seller open to a 18% concession, seller financing, or rate buy-down credit?
- What's the actual annual flood-insurance premium (NFIP or private), and is the property in a SFHA with mandatory coverage?
- What does the HOA fee cover, when was the last increase, and are there any pending special assessments or reserve-fund shortfalls?
- Why hasn't it sold? Are there any deal-killer items the seller is aware of (foundation, flood, title, zoning, code violations)?
- Is there a deadline driving the sale (1031 exchange, divorce, estate, relocation)? That informs how much negotiation room exists.
- Schools are D-rated, which usually means shorter tenancies and higher turnover. Who's the typical renter profile here, and what's been the actual vacancy rate?
- The area grade is low — what's the realistic commute time and amenity access for the typical tenant pool here? Any planned neighborhood developments (good or bad) we should know about?
- What's the average days-on-market for RENTAL listings here right now (not sales)? A rising rental-DOM trend means longer vacancies and softer asking-rent achievability than the comps imply.
- What's the recent tenant-quality profile in this submarket — average credit score on applications, eviction rate, late-payment / NSF rate, and stable-employment percentage? A property-management company in the area should have these aggregated.
- How much new for-sale + rental construction is in the pipeline within 1–3 miles? Heavy new supply typically softens prices + rents 12–24 months out; constrained supply supports both.
Investment metrics
- 1% rule
- 0.82% ✗
- Cap rate
- 5.64%
- Cash-on-cash
- -2.32%
- DSCR
- 0.90
- GRM
- 10.2
CMA / ARV
No comps found within radius.
Projected returns pro-forma
1.25% appreciation · 0.0% rent growth · sell at horizon
- IRR
- -2.9%
- Equity multiple
- 0.85×
- Total profit
- $-12,083
- Equity at exit
- $102,757
- IRR
- 0.4%
- Equity multiple
- 1.04×
- Total profit
- $3,611
- Equity at exit
- $139,535
Cash invested: $81,172 (down + closing). Projections, not guarantees.
Landlord ↔ Tenant lean methodology
- Overall (STATE)
- 87 Strongly Landlord-Friendly
- State Florida
- 87 Strongly Landlord-Friendly · R+3
- County
- — inherits STATE
- City
- — inherits STATE
ZIP-level market 33947
- Home prices YoY
- 0.4%
- Rents YoY
- -0.2%
- Active inventory
- 863
- Price-to-rent
- 10.2×
Monthly cashflow live
- Estimated rent
- $2,365 high interval (Pro) →
- Mortgage (P&I)
- −$1,520
- Tax est. 1.5%
- −$362 /mo · $4,348/yr
- Insurance
- −$121
- Flood insurance flood zone
- −$66 /mo · $798/yr
- HOA
- −$22
- Vacancy / Maint / Mgmt
- −$497
- Net cashflow
- $-223
Break-even live
UW: 25.0% down · 7.5% · 30yr · 1.5% tax · 5.0% vac · 8.0% maint · 8.0% mgmt
Financing live
Cash to close
- Down payment
- $72,475
- Closing costs
- $8,697
- Reserves months
- —
- Total cash needed
- —
Loan-product check · same deal, 3 products live
Conventional
25% down · 7.5% · 30yr
- Down + closing
- —
- Monthly P&I
- —
- Monthly cashflow
- —
- DSCR
- —
- Eligible?
- —
Personal DTI + credit; lowest rate.
DSCR
20% down · 8.5% · 30yr
- Down + closing
- —
- Monthly P&I
- —
- Monthly cashflow
- —
- DSCR
- —
- Eligible?
- —
No personal income docs; deal must DSCR.
Hard money
10% down · 12.0% · 12mo
- Down + closing
- —
- Monthly P&I
- —
- Monthly cashflow
- —
- DSCR
- —
- Eligible?
- —
Short-term bridge; refi at stabilization.
Rent comps 31 comps
| Address | Beds | Baths | Sqft | Rent | $/sqft | DOM | Units | Dist |
|---|---|---|---|---|---|---|---|---|
| 203 Wright Dr Rotonda West, FL | 4.0 | 3.0 | 2092 | $2,400 | $1.15 | 20d | 1 | 0.11mi |
| 431 Albatross Rd Rotonda West, FL | 2.0 | 2.0 | 1857 | $4,800 | $2.58 | 20d | 1 | 0.19mi |
| 8249 Dimstead St Port Charlotte, FL | 3.0 | 2.0 | 1202 | $1,675 | $1.39 | 20d | 1 | 0.53mi |
| 8373 Agate St Unit 8375 Port Charlotte, FL | 3.0 | 2.0 | 1379 | $1,747 | $1.27 | 20d | 1 | 0.55mi |
| 8479 Agate St Port Charlotte, FL | 3.0 | 2.0 | 1379 | $2,495 | $1.81 | 20d | 1 | 0.58mi |
| 358 Albatross Rd Rotonda West, FL | 4.0 | 2.0 | 1664 | $2,100 | $1.26 | 20d | 1 | 0.60mi |
| 8519 Agate St Unit 8521 Port Charlotte, FL | 3.0 | 2.0 | 1379 | $1,697 | $1.23 | 20d | 1 | 0.61mi |
| 135 David Blvd Rotonda West, FL | 3.0 | 2.0 | 1880 | $2,695 | $1.43 | 13d | 1 | 0.74mi |
| 13376 Yager Ln Port Charlotte, FL | 3.0 | 2.0 | 2002 | $3,500 | $1.75 | 13d | 1 | 0.76mi |
| 9116 Agate St #9118 Port Charlotte, FL | 3.0 | 2.0 | 1429 | $1,750 | $1.22 | 20d | 1 | 0.85mi |
| 289 Antis Dr Rotonda West, FL | 3.0 | 2.0 | 1648 | $2,150 | $1.30 | 20d | 1 | 0.88mi |
| 9163 Agate St Unit 9165 Port Charlotte, FL | 3.0 | 2.0 | 1379 | $1,697 | $1.23 | 20d | 1 | 0.90mi |
| 9163 Agate St Unit 9163 Port Charlotte, FL | 3.0 | 2.0 | 1379 | $1,747 | $1.27 | 20d | 1 | 0.90mi |
| 9156 Agate St Unit 9156 Port Charlotte, FL | 3.0 | 2.0 | 1379 | $1,747 | $1.27 | 20d | 1 | 0.91mi |
| 138 Jade St Rotonda West, FL | 3.0 | 2.0 | 1564 | $1,869 | $1.20 | 20d | 1 | 0.95mi |
| 14073 Naylor Ave Port Charlotte, FL | 3.0 | 2.0 | 1818 | $2,250 | $1.24 | 20d | 1 | 0.95mi |
| 9195 Agate St Port Charlotte, FL | 3.0 | 2.0 | 1200 | $1,650 | $1.38 | 13d | 1 | 0.95mi |
| 108 Boxwood Ln Rotonda West, FL | 3.0 | 2.0 | 1647 | $1,775 | $1.08 | 13d | 1 | 1.00mi |
| 9251 Agate St Port Charlotte, FL | 3.0 | 2.0 | 1237 | $1,565 | $1.27 | 20d | 1 | 1.04mi |
| 9108 Santa Lucia Dr Port Charlotte, FL | 4.0 | 2.0 | 1917 | $3,100 | $1.62 | 13d | 1 | 1.11mi |
| 12114 Clarendon Ave Port Charlotte, FL | 3.0 | 2.0 | 1270 | $2,400 | $1.89 | 20d | 1 | 1.11mi |
| 9317 Agate St Unit 9317 Port Charlotte, FL | 3.0 | 2.0 | 1379 | $1,747 | $1.27 | 20d | 1 | 1.16mi |
| 8362 Santa Cruz Dr Port Charlotte, FL | 3.0 | 2.5 | 2016 | $3,500 | $1.74 | 20d | 1 | 1.21mi |
| 13180 Amaryllis Cir Port Charlotte, FL | 3.0 | 2.0 | 1704 | $2,950 | $1.73 | 13d | 1 | 1.28mi |
| 108 Crevalle Rd Rotonda West, FL | 3.0 | 2.0 | 1946 | $3,000 | $1.54 | 20d | 1 | 1.29mi |
| 9400 Agate St Pt Charlotte, FL | 3.0 | 2.0 | 1429 | $1,795 | $1.26 | 20d | 1 | 1.32mi |
| 14295 Overlook Ave Port Charlotte, FL | 3.0 | 2.0 | 1450 | $1,700 | $1.17 | 20d | 1 | 1.36mi |
| 9425 Agate St Unit 9425 Port Charlotte, FL | 3.0 | 2.0 | 1379 | $1,700 | $1.23 | 20d | 1 | 1.37mi |
| 48 Par View Ct Rotonda West, FL | 3.0 | 2.0 | 2000 | $3,500 | $1.75 | 20d | 1 | 1.40mi |
| 9550 Fiddlers Green Cir #105 Rotonda West, FL | 2.0 | 2.0 | 1230 | $2,900 | $2.36 | 20d | 1 | 1.41mi |
| 7415 Beckley St Port Charlotte, FL | 3.0 | 2.0 | 1405 | $1,400 | $1.00 | 20d | 1 | 1.46mi |
HOA detail
- Monthly dues
- $22 · $264/yr
Listing history 22 events
-
2026-06-18days on market $289,900 Active 140 DOM
-
2026-06-17days on market $289,900 Active 139 DOM
-
2026-06-16days on market $289,900 Active 138 DOM
-
2026-06-15days on market $289,900 Active 137 DOM
-
2026-06-14days on market $289,900 Active 135 DOM
-
2026-06-13days on market $289,900 Active 134 DOM
-
2026-06-10days on market $289,900 Active 132 DOM
-
2026-06-09days on market $289,900 Active 131 DOM
-
2026-06-08days on market $289,900 Active 130 DOM
-
2026-06-05days on market $289,900 Active 126 DOM
-
2026-06-03days on market $289,900 Active 125 DOM
-
2026-06-02days on market $289,900 Active 124 DOM
-
2026-06-01days on market $289,900 Active 123 DOM
-
2026-05-31days on market $289,900 Active 122 DOM
-
2026-05-30days on market $289,900 Active 121 DOM
-
2026-03-24price $289,900
-
2026-01-29$294,900 Active
-
2022-09-02soldstatus $276,000
-
2021-11-29soldstatus $267,000
-
2012-11-26soldstatus $85,800
-
2012-08-31soldstatus $3,900 315-char remark
Show marketing remark (315 chars)
Large corner facing lot with southeast exposure or choice to orient for differnet exposures. Easy drive to beaches, shopping , restaurants and Charlotte Sports Park, home of Rays Spring Training and Stone Crabs minor league baseball. THIS LOT IS IN A SCRUBJAY HAZARD ZONE ACCORDING TO THE COUNTY WEBSITE AT LISTING.
-
2012-06-06$3,500 315-char remark
Show marketing remark (315 chars)
Large corner facing lot with southeast exposure or choice to orient for differnet exposures. Easy drive to beaches, shopping , restaurants and Charlotte Sports Park, home of Rays Spring Training and Stone Crabs minor league baseball. THIS LOT IS IN A SCRUBJAY HAZARD ZONE ACCORDING TO THE COUNTY WEBSITE AT LISTING.
ⓘ Source: listings_history table (triggers on properties + properties_extension) + one-shot
backfill from property_details.listing_events for pre-trigger history.
Climate risk First Street
- Flood 9/10 Extreme FEMA zone X (shaded) · 99% chance over 30 yrs
- Wildfire 4/10 Moderate
- Heat 10/10 Extreme 6 d/yr ≥107°F today · 22 d/yr by 30 yrs out
- Wind 10/10 Extreme 99% chance of damaging wind over 30 yrs
- Air quality 2/10 Low 1 unhealthy d/yr today · 1 by 30 yrs out
Nearby sold comps map
Loading sold comps map…
Walkable amenities ~0.75 mi
Loading nearby amenities…
Taxation est. · year 1
- Rental income
- $28,383
- − Mortgage interest
- −$16,239
- − Property taxes
- −$4,348
- − Insurance
- −$2,247
- − Repairs & maintenance
- −$2,271
- − Management
- −$2,271
- − HOA
- −$264
- − Depreciation
- −$8,433
- Taxable loss
- −$7,690
- Est. tax savings @ 24.0%
- +$1,846
- After-tax cash flow
- $-835/yr
For passive investors: Depreciation is non-cash, so a rental often shows a tax loss while cash-flowing — sheltering income. Rental losses are passive: they offset passive income freely, and up to $25,000/yr can offset ordinary (W-2) income if you actively participate and your MAGI is under $100k (phasing out to $0 by $150k); unused losses carry forward. On sale, claimed depreciation is recaptured at up to 25%, and gains may owe capital-gains tax (a 1031 exchange can defer both). Figures are a year-1 estimate at your 24.0% rate — not tax advice; consult a CPA.
Schools (NCES district)
- District
- Charlotte
- NCES district ID
- 1200240
- Math proficiency
- 54% ▼ -6.00%
- Reading proficiency
- 54% ▼ -1.00%
- Median HH income
- $44,864
- Composite
- 45.62/100
- National rank
- #2586
- State rank
- #22 of 73 in FL
Livability — Rotonda
- Score
- 67/100
- State rank
- #548
- US rank
- #10359
Category grades
Schools grade is shown separately in the Schools card above.
Census & demographics
- County
- Charlotte County · 196,994 people
- City population
- 10,490
- Metro
- Punta Gorda, FL
- Population (ZIP)
- 10,447
- Household income
- $80,091
- Rent vs Own
- Severe rent burden
- 91.0
Population outlook (Charlotte County) Hauer SSP2
- Today (2025)
- 198,646 people
- By 2030
- 210,507 · +6.0%
- By 2040
- 230,857 · +16.2%
- By 2050
- 247,148 · +24.4%
- By 2075
- 281,777 · +41.8%
- By 2100
- 293,609 · +47.8%
Race, ethnicity, and origin ACS 2023
- Neighborhood character
- Predominantly White (96%)
- Race & ethnicity
- White 96% Hispanic / Latino 2% Two or more races 2%
- Common ancestry
- Romanian 5% Lithuanian 4% Slovak 4%
- Foreign-born
- 8% · Canada, Vietnam
- Languages at home
- 93% English-only · Russian/Polish/Slavic 3% Spanish 2% German/W. Germanic 1%
Political lean MEDSL · Charlotte
- 2024 margin
- Solid R (+34.0) · D 32.7% · R 66.7%
- 2008→2024 swing
- -26.7pp toward R · 2008: -7.2pp · 2024: -34.0pp
- All cycles
- 2024: R+34.0 2020: R+26.6 2016: R+27.8 2012: R+14.3 2008: R+7.2
Not yet ingested
- Civics
- —
Market trends
- HPI YoY
- ▲ 1.25%
- Current HPI
- 311.3231
- Rent YoY
- ▼ -0.22%
- Metro
- Punta Gorda, FL
- State GDP YoY
- ▲ 3.28%
- F500 in state
- 36
Industry mix (Fortune 500 HQ in FL)
| Industry | F500 HQs | Revenue |
|---|---|---|
| Industrial Technology | 2 | $29B |
|
||
| Insurance | 2 | $17B |
|
||
| Retail | 1 | $60B |
|
||
| Technology Distribution | 1 | $58B |
|
||
| Homebuilding | 1 | $35B |
|
||
| Technology Manufacturing | 1 | $35B |
|
||
Price history
+8182.9% since first listed7 events — show timeline
- 2026-03-24 Price Changed $289,900 Stellar MLS as Distributed by MLS Grid
- 2026-01-29 Listed $294,900 Stellar MLS as Distributed by MLS Grid
- 2022-09-02 Sold (Public Records) $276,000 Public Records
- 2021-11-29 Sold (Public Records) $267,000 Public Records
- 2012-11-26 Sold (Public Records) $85,800 Public Records
- 2012-08-31 Sold (MLS) $3,900 Stellar MLS as Distributed by MLS Grid
- 2012-06-06 Listed $3,500 Stellar MLS as Distributed by MLS Grid
Property tax history
+7.6%/yrLatest (2025): $536 · +0.9% YoY. Source: county tax records.
Cash-flow waterfall
monthlySold comps — $/sqft
last 12 mo · ≤1 miLoading sold comps…