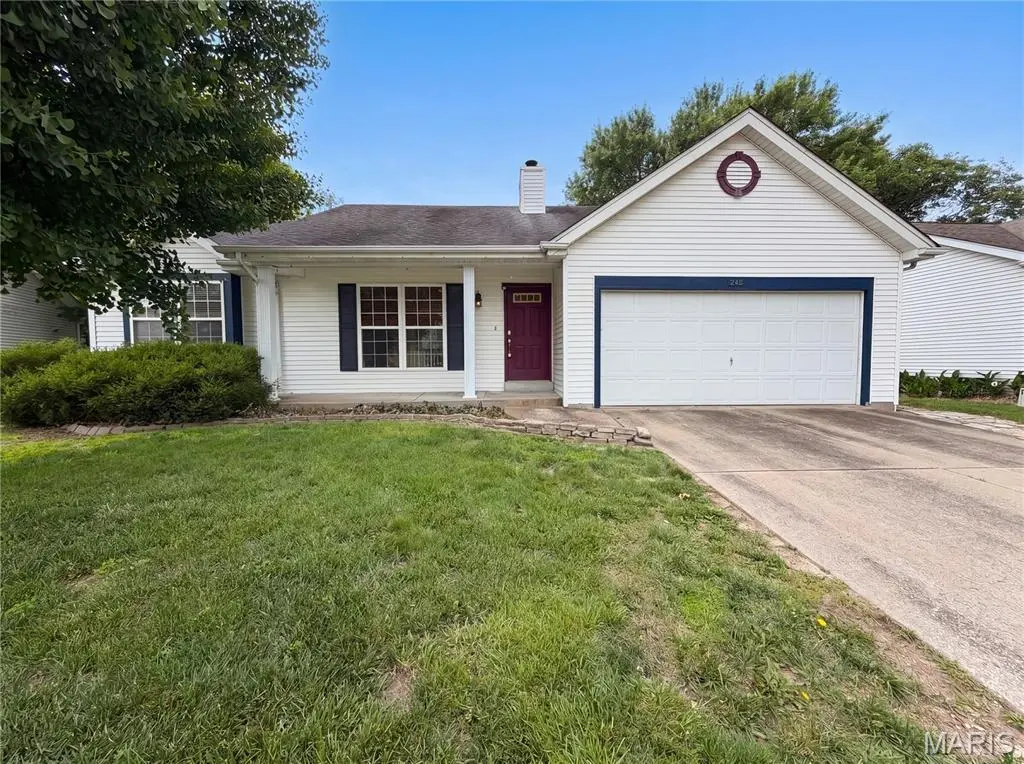
246 Royalltrail Ln · O'Fallon, MO
Flood risk 4/10 · Minor
- FEMA flood zone
- X (unshaded)
- Chance of flooding over 30 yrs
- 0.22%
- Est. flood insurance / yr
- $473 – $860
Fire risk 1/10 · Minimal
- Est. fire insurance / yr
- $1,054 – $1,958
Heat risk 5/10 · Moderate
- Hot days now (above 107°F)
- 7 days/yr
- Hot days in 30 yrs
- 20 days/yr
Wind risk 2/10 · Minimal
- Chance of severe wind over 30 yrs
- 1.0%
Air-quality risk 2/10 · Minimal
- Unhealthy air days now
- 1 days/yr
- Unhealthy air days in 30 yrs
- 1 days/yr
Risk factors via First Street. Map © Google.
Why this score? — see what drove the D- grade
The composite is a weighted blend of 9 inputs, each scored 0–100. Each bar is that input's sub-score; the figure is the points it added to the 100-point composite (weight × sub-score).
- ARV discount +11.5/15.0
- Cash flow +8.9/30.0
- Schools +5.1/10.0
- Rent growth +2.9/5.0
- DSCR +2.5/10.0
- Livability +2.5/5.0
- Condition / age +2.5/5.0
- 1% rule +2.4/10.0
- Appreciation +0.0/10.0
$298,000
🖨 Deal sheet (PDF) 📄 Offer letter ✓ Due diligence
Listing remarks
Picture yourself at 246 Royalltrail Ln, a residence thoroughly refreshed with fresh interior paint and thoughtful upgrades. The kitchen is equipped with all stainless steel appliances, complemented by an accent backsplash that adds a subtle design element. Enjoy evenings by the comforting fireplace, or step outside to the spacious deck for outdoor gatherings. A perfect blend of modern updates, comfort, and outdoor enjoyment. . Included 100-Day Home Warranty with buyer activation
Key facts
- Spacious deck
- Accent backsplash
- Fireplace
Tags
Property features AI
Finance
- Other: Home warranty included
- HOA & community: Royallsprings HOA with an annual fee of $235 (includes other HOA amenities)
Exterior
- Parking: Detached 2-car garage
- Utilities: Public water; Public sewer; Electric service (other)
- Home design: Single-family residence; One level (living area spans one level with additional below-grade finished area)
- Construction: Construction materials listed as 'Other'; Partial below-grade finished area
- Exterior features: Private ownership; Lot features noted as 'Other'; Lot dimensions approximately 64 x 125
Interior
- Bedrooms: 3 bedrooms total — 2 on the main level, 1 on the lower level
- Bathrooms: 2 full bathrooms (both on the main level)
- Heating & cooling: Forced air heating (natural gas); Electric cooling
- Interior features: Partial finished basement; One fireplace (wood burning or other)
Neighborhood map
What this means for you Summary
Snapshot
- This is a 2-bed/2.0-bath single-family listed at $298k.
Deal economics
- At list price, monthly cash flow is $-240 ($-3k/yr) — negative.
- To cash-flow at today's rent, offer at most $256k (14.2% below list).
- To meet the 1% rule (rent ≥ 1% of price), the offer needs to be $222k (25.7% below list).
- Recommended offer: $222k (25.7% below list) — sets the bar for 1% rule.
- Cap rate 5.3% vs local median 3.2% in O'Fallon — top-decile yield for the area; either an underpriced asset or a hidden risk that comps aren't pricing in. Stress-test before assuming the spread holds.
Location & tenants
- Location reads: area grade D — affects rentability + tenant quality, not the cash-flow math above.
- Ft. Zumwalt R-II (suburban): math 54% / reading 60% proficiency, ranked #14 of 324 in MO (top 4%) — acceptable for families but not a draw, mixed tenant base, ~2y average lease; only 18% free/reduced lunch — higher-income household profile.
- Zoned schools: Pheasant Point Elem. (math 56% / reading 65%, grade B-, #118 of 1,115 statewide, top 11%, 436 students, 11% FRL); Ft. Zumwalt West High (math 64% / reading 72%, grade B, #13 of 521 statewide, top 2%, 1,778 students, 17% FRL) — zoned schools at 14% FRL track the district average.
- Market conditions: Rents rising (+1.6%/yr); 376 active listings in the ZIP; 3 comparable units currently listed for rent nearby; rentals leasing fast (median 6d on market — plan ~1-2 weeks tenant-placement turnaround); high-income renter base; 2,021 units permitted in St. Charles County in 2024 (568 in 5+ unit buildings).
Forward outlook
- Local home prices are declining (-3.0%/yr); year-one equity from $2k of loan paydown is wiped out by about $9k of value loss. Plan a longer hold.
- St. Charles County population projected at +22% by 2050 — long-run rental-demand tailwind backs the buy-and-hold thesis.
Negotiation context
- Only 4 days on market — expect competitive offers; lowballing is unlikely to land.
- Current owner paid $200k; 49% above their basis — modest negotiation headroom, anchor on the comps not their cost.
Risks & watch-outs
- Climate carrying-cost: extreme-heat days projected 7→20/yr by 2055 (HVAC capex compounding) — expect insurance premiums to compound above CPI over the hold.
Questions for the listing agent
- What do current leases actually rent for vs. the listed asking? Can we see a recent rent roll and the last 12 months of T-12 income?
- What does the HOA fee cover, when was the last increase, and are there any pending special assessments or reserve-fund shortfalls?
- Is there a deadline driving the sale (1031 exchange, divorce, estate, relocation)? That informs how much negotiation room exists.
- The area grade is low — what's the realistic commute time and amenity access for the typical tenant pool here? Any planned neighborhood developments (good or bad) we should know about?
- What's the average days-on-market for RENTAL listings here right now (not sales)? A rising rental-DOM trend means longer vacancies and softer asking-rent achievability than the comps imply.
- What's the recent tenant-quality profile in this submarket — average credit score on applications, eviction rate, late-payment / NSF rate, and stable-employment percentage? A property-management company in the area should have these aggregated.
- How much new for-sale + rental construction is in the pipeline within 1–3 miles? Heavy new supply typically softens prices + rents 12–24 months out; constrained supply supports both.
Investment metrics
- 1% rule
- 0.74% ✗
- Cap rate
- 5.33%
- Cash-on-cash
- -3.45%
- DSCR
- 0.85
- GRM
- 11.2
CMA / ARV
- ARV (on-the-fly)
- $326,802
- Comps found
- 12
Show comp detail 12 sales within ~0.75 mi
| Address | Dist | Beds/Ba | Sqft | Sold | Price | $/sf | Match |
|---|---|---|---|---|---|---|---|
| 1 Royallprairie Ct | 0.22mi | 3/2.5 (+1) | 1,753 (-0%) | 8mo | $299,900 | $171 | 75 |
| 1 Royalltrail Ct | 0.11mi | 3/3.5 (+1) | 1,841 (+5%) | 2mo | $350,000 | $190 | 75 |
| 4 Royallbridge Ct | 0.25mi | 3/2.0 (+1) | 1,802 (+3%) | 9mo | $375,000 | $208 | 72 |
| 2532 Stillwater Dr | 0.41mi | 3/2.5 (+1) | 1,746 (-1%) | 8mo | $289,000 | $166 | 66 |
| 2535 Stillwater Dr | 0.39mi | 3/2.0 (+1) | 1,720 (-2%) | 10mo | $319,900 | $186 | 65 |
| 10 Royallridge Ct | 0.40mi | 3/2.0 (+1) | 1,730 (-2%) | 13mo | $359,900 | $208 | 63 |
| 2121 Mcgregor Cir | 0.73mi | 2/2.0 | 1,750 (-0%) | 5mo | $350,000 | $200 | 61 |
| 11 Saddleback Ct | 0.52mi | 3/1.5 (+1) | 1,808 (+3%) | 8mo | $275,000 | $152 | 57 |
| 2849 Royallvalley Way | 0.29mi | 3/3.5 (+1) | 1,978 (+13%) | 1mo | $400,000 | $202 | 54 |
| 2625 Breezy Point Ln | 0.42mi | 3/2.5 (+1) | 1,912 (+9%) | 6mo | $300,000 | $157 | 53 |
| 520 Durango Dr | 0.38mi | 3/2.0 (+1) | 1,539 (-12%) | 6mo | $250,000 | $162 | 51 |
| 2422 Sundance Dr | 0.59mi | 3/2.0 (+1) | 1,531 (-13%) | 10mo | $249,900 | $163 | 38 |
Match score weights: distance 35% · size 25% · config 20% · recency 20%. Top-matched comps best support the ARV.
Projected returns pro-forma
-3.0% appreciation · 1.59% rent growth · sell at horizon
- IRR
- -23.6%
- Equity multiple
- 0.20×
- Total profit
- $-66,697
- Equity at exit
- $44,433
- IRR
- -22.7%
- Equity multiple
- -0.08×
- Total profit
- $-90,180
- Equity at exit
- $25,766
Cash invested: $83,440 (down + closing). Projections, not guarantees.
Landlord ↔ Tenant lean methodology
- Overall (STATE)
- 81 Strongly Landlord-Friendly
- State Missouri
- 81 Strongly Landlord-Friendly · R+10
- County
- — inherits STATE
- City
- — inherits STATE
ZIP-level market 63368
- Home prices YoY
- -20.7%
- Rents YoY
- 1.6%
- Active inventory
- 376
- Price-to-rent
- 11.2×
Monthly cashflow live
- Estimated rent
- $2,215 medium interval (Pro) →
- Mortgage (P&I)
- −$1,563
- Tax from tax record
- −$284 /mo · $3,402/yr
- Insurance
- −$124
- HOA
- −$20
- Vacancy / Maint / Mgmt
- −$465
- Net cashflow
- $-240
Break-even live
Sensitivity live
| Price | -10% $-72 | -5% $-156 | +0% $-240 | +5% $-325 | +10% $-409 |
|---|---|---|---|---|---|
| Rent | -10% $-415 | -5% $-328 | +0% $-240 | +5% $-153 | +10% $-65 |
| Rate | -1.0pp $-90 | -0.5pp $-164 | base $-240 | +0.5pp $-317 | +1.0pp $-396 |
UW: 25.0% down · 7.5% · 30yr · 1.5% tax · 5.0% vac · 8.0% maint · 8.0% mgmt
Financing live
Cash to close
- Down payment
- $74,500
- Closing costs
- $8,940
- Reserves months
- —
- Total cash needed
- —
Loan-product check · same deal, 3 products live
Conventional
25% down · 7.5% · 30yr
- Down + closing
- —
- Monthly P&I
- —
- Monthly cashflow
- —
- DSCR
- —
- Eligible?
- —
Personal DTI + credit; lowest rate.
DSCR
20% down · 8.5% · 30yr
- Down + closing
- —
- Monthly P&I
- —
- Monthly cashflow
- —
- DSCR
- —
- Eligible?
- —
No personal income docs; deal must DSCR.
Hard money
10% down · 12.0% · 12mo
- Down + closing
- —
- Monthly P&I
- —
- Monthly cashflow
- —
- DSCR
- —
- Eligible?
- —
Short-term bridge; refi at stabilization.
Rent comps 3 comps
| Address | Beds | Baths | Sqft | Rent | $/sqft | DOM | Units | Dist |
|---|---|---|---|---|---|---|---|---|
| 209 Royallsprings Pkwy O Fallon, MO | 3.0 | 2.5 | 1512 | $2,431 | $1.61 | 0d | 1 | 0.16mi |
| 256 Cherrywood Parc Dr O Fallon, MO | 3.0 | 2.5 | 1590 | $2,276 | $1.43 | 5d | 1 | 1.01mi |
| 381 Erin Dr Saint Peters, MO | 3.0 | 2.5 | 1288 | $2,500 | $1.94 | 25d | 1 | 1.17mi |
HOA detail
- Monthly dues
- $20 · $240/yr
Listing history 3 events
-
2026-06-13statusdays on market $298,000 Pending 4 DOM
-
2026-06-08remarks 483-char remark
-
2026-06-08$298,000 Active 1 DOM
ⓘ Source: listings_history table (triggers on properties + properties_extension) + one-shot
backfill from property_details.listing_events for pre-trigger history.
Tax reassessment forecast MO · Resets to sale price
- Current annual tax
- $3,402 · $284/mo
- Projected year-2 tax
- $3,402 · $284/mo
- Expected delta
- $0/yr ($0/mo · 0.0%)
ⓘ Screening estimate from a state-policy table — verify with the county assessor before closing.
Climate risk First Street
- Flood 4/10 Moderate FEMA zone X (unshaded) · 22% chance over 30 yrs
- Wildfire 1/10 Low
- Heat 5/10 Major 7 d/yr ≥107°F today · 20 d/yr by 30 yrs out
- Wind 2/10 Low 100% chance of damaging wind over 30 yrs
- Air quality 2/10 Low 1 unhealthy d/yr today · 1 by 30 yrs out
Nearby sold comps map
Loading sold comps map…
Walkable amenities ~0.75 mi
Loading nearby amenities…
Taxation est. · year 1
- Rental income
- $26,586
- − Mortgage interest
- −$16,693
- − Property taxes
- −$3,402
- − Insurance
- −$1,490
- − Repairs & maintenance
- −$2,127
- − Management
- −$2,127
- − HOA
- −$240
- − Depreciation
- −$8,669
- Taxable loss
- −$8,162
- Est. tax savings @ 24.0%
- +$1,959
- After-tax cash flow
- $-924/yr
For passive investors: Depreciation is non-cash, so a rental often shows a tax loss while cash-flowing — sheltering income. Rental losses are passive: they offset passive income freely, and up to $25,000/yr can offset ordinary (W-2) income if you actively participate and your MAGI is under $100k (phasing out to $0 by $150k); unused losses carry forward. On sale, claimed depreciation is recaptured at up to 25%, and gains may owe capital-gains tax (a 1031 exchange can defer both). Figures are a year-1 estimate at your 24.0% rate — not tax advice; consult a CPA.
Schools (NCES district)
- District
- Ft. Zumwalt R-II
- NCES district ID
- 2908370
- Math proficiency
- 54% ▼ -7.00%
- Reading proficiency
- 60% ▼ -4.00%
- Median HH income
- $75,817
- Composite
- 51.04/100
- National rank
- #1772
- State rank
- #14 of 324 in MO
Livability — O'Fallon
No livability data for this city. (Only ~50 U.S. cities are tracked.)
Census & demographics
- Census place
- O'Fallon, MO
- County
- Saint Charles County · 399,703 people
- City population
- 45,862
- Metro
- St. Louis, MO-IL
- Population (ZIP)
- 46,966
- Household income
- $124,297
- Rent vs Own
- Severe rent burden
- 538.0
Population outlook (St. Charles County) Hauer SSP2
- Today (2025)
- 437,857 people
- By 2030
- 461,707 · +5.4%
- By 2040
- 503,222 · +14.9%
- By 2050
- 534,684 · +22.1%
- By 2075
- 597,047 · +36.4%
- By 2100
- 609,682 · +39.2%
Race, ethnicity, and origin ACS 2023
- Neighborhood character
- Predominantly White (84%)
- Race & ethnicity
- White 84% Asian 5% Two or more races 5% Black 4% Hispanic / Latino 3%
- Common ancestry
- Romanian 4% Lithuanian 3% Italian 2%
- Foreign-born
- 6% · Canada, China
- Languages at home
- 93% English-only · Other Asian/Pacific 2% Spanish 2% Other Indo-European 2%
Political lean MEDSL · St. Charles
- 2024 margin
- R (+17.0) · D 40.8% · R 57.8% · Other 1.4%
- 2008→2024 swing
- -7.2pp toward R · 2008: -9.7pp · 2024: -17.0pp
- All cycles
- 2024: R+17.0 2020: R+17.5 2016: R+26.4 2012: R+21.0 2008: R+9.7
Not yet ingested
- Civics
- —
Market trends
- HPI YoY
- ▼ -57.32%
- Current HPI
- 219.7731
- Rent YoY
- ▲ 1.59%
- Metro
- St. Louis, MO-IL
- State GDP YoY
- ▲ 1.84%
- F500 in state
- 20
Industry mix (Fortune 500 HQ in MO)
| Industry | F500 HQs | Revenue |
|---|---|---|
| Healthcare | 1 | $163B |
|
||
| Insurance | 1 | $21B |
|
||
| Industrial Technology | 1 | $17B |
|
||
| Retail | 1 | $16B |
|
||
| Industrial Distribution | 1 | $10B |
|
||
| Utilities | 1 | $9B |
|
||
Price history
+188.4% since first listed5 events — show timeline
- 2026-06-08 Listed $298,000 MARIS as Distributed by MLS Grid
- 2026-04-30 Sold (Public Records) — Public Records
- 2007-05-09 Sold (Public Records) $199,900 Public Records
- 2001-10-23 Sold (Public Records) $147,500 Public Records
- 1994-09-01 Sold (Public Records) $103,325 Public Records
Property tax history
+4.4%/yrLatest (2025): $3,402 · +3.8% YoY. Source: county tax records.
Cash-flow waterfall
monthlySold comps — $/sqft
last 12 mo · ≤1 miLoading sold comps…