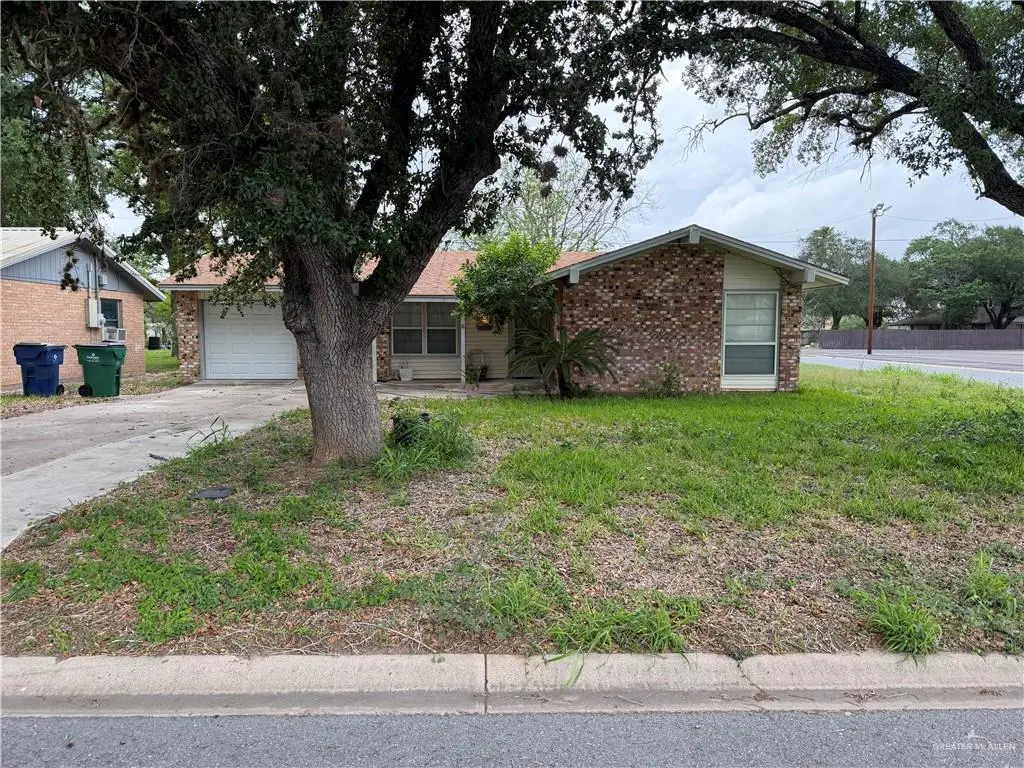
200 W Potts St · Falfurrias, TX
Flood risk No data
- FEMA flood zone
- —
- Chance of flooding over 30 yrs
- —
- Est. flood insurance / yr
- —
Fire risk No data
- Est. fire insurance / yr
- —
Heat risk No data
- Hot days now (above threshold)
- —
- Hot days in 30 yrs
- —
Wind risk No data
- Chance of severe wind over 30 yrs
- —
Air-quality risk No data
- Unhealthy air days now
- —
- Unhealthy air days in 30 yrs
- —
Risk factors via First Street. Map © Google.
Why this score? — see what drove the D grade
The composite is a weighted blend of 9 inputs, each scored 0–100. Each bar is that input's sub-score; the figure is the points it added to the 100-point composite (weight × sub-score).
- Cash flow +16.9/30.0
- DSCR +5.2/10.0
- Appreciation +5.2/10.0
- 1% rule +4.7/10.0
- Livability +3.6/5.0
- Rent growth +2.5/5.0
- Condition / age +2.5/5.0
- Schools +1.7/10.0
- ARV discount +0.0/15.0
$125,000
🖨 Deal sheet (PDF) 📄 Offer letter ✓ Due diligence
Listing remarks
Opportunity is knocking with this 3-bedroom, 1-bath home featuring a 1-car garage—perfect for first-time buyers, investors, or anyone looking to add their personal touch. Situated on a spacious lot with mature shade trees, this property offers great curb appeal and plenty of outdoor potential. Inside, you’ll find a functional layout with a comfortable living area, tile flooring throughout for easy maintenance, and a practical kitchen ready for your updates. The bathroom has been modified with a walk-in shower for added accessibility. Whether you’re looking for a starter home or your next investment project, this property provides solid value and endless possibilities.
Key facts
- Curb appeal
- Tile flooring
- Walk-in shower
Tags
Property features AI
Finance
- HOA & community: No homeowners association
Exterior
- Parking: Attached 1-car garage; 1 total covered parking space
- Utilities: City sewer
- Home design: Single-family property
- Construction: Brick and vinyl siding exterior; Composition shingle roof; Slab foundation; Built on a 0.2066-acre (approx. 8,999.9 sq ft) lot
- Exterior features: Mature trees; Paved road access; Corner lot
Interior
- Kitchen: Microwave; Refrigerator; Electric stove/range (electric coil)
- Flooring: Tile
- Bathrooms: 1 full bathroom
- Heating & cooling: Central heating; Central air; Wall unit(s) for cooling
- Interior features: Entrance foyer; Tile countertops; Ceiling fan(s); Crown/cove molding; Double pane windows; Mini blinds
- Laundry & utility: Washer/dryer connection; Laundry area in garage; Electric water heater
Neighborhood map
What this means for you Summary
Snapshot
- This is a 3-bed/1.0-bath single-family listed at $125k.
Deal economics
- At list price, monthly cash flow is $81 ($977/yr) — positive.
- The deal already cash-flows at list — no discount required.
- To meet the 1% rule (rent ≥ 1% of price), the offer needs to be $122k (2.8% below list).
- Recommended offer: $118k (6.0% below list) — sets the bar for market timing.
Location & tenants
- Location reads 72/100 on livability (#242 in TX) — a middle-class / working-renter tenant base. Strengths: cost of living A+, housing A+, health & safety A+; Watch: amenities F, commute F, employment F.
- Brooks County ISD (town): math 19% / reading 26% proficiency, ranked #776 of 826 in TX (top 94%) — low school quality limits family demand, transient renter base, plan for 1-2y turnover; only 19% free/reduced lunch — higher-income household profile.
- Zoned schools: Lasater El (168 students, 98% FRL); Falfurrias J H (math 17% / reading 30%, grade F, #1,317 of 1,662 statewide, top 80%, 274 students, 87% FRL); Falfurrias H S (math 42% / reading 42%, grade F, #730 of 1,632 statewide, top 47%, 401 students, 92% FRL) — zoned schools average 92% FRL vs 19% district-wide (73 pts higher); higher-poverty schools than district average — tighter screening recommended.
- Market conditions: 43 active listings in the ZIP.
Forward outlook
- In year one you build about $1k of equity ($864 loan paydown + $611 appreciation (0.5% local appreciation)).
- At projected returns (0.5% appreciation + 3.0% rent growth), your $35k cash investment doubles in ~9 years — after that, you're playing with house money.
Negotiation context
- It's been on market 61 days — a 6% lower offer ($118k) is reasonable based on typical stale-listing flexibility.
Questions for the listing agent
- It's been on market 61 days. Have you received any prior offers? Is the seller open to a 6% concession, seller financing, or rate buy-down credit?
- Built in 1969 — when were the roof, HVAC, electrical panel, plumbing, and water heater last replaced?
- Why hasn't it sold? Are there any deal-killer items the seller is aware of (foundation, flood, title, zoning, code violations)?
- Is there a deadline driving the sale (1031 exchange, divorce, estate, relocation)? That informs how much negotiation room exists.
- Schools are D-rated, which usually means shorter tenancies and higher turnover. Who's the typical renter profile here, and what's been the actual vacancy rate?
- The area grade is low — what's the realistic commute time and amenity access for the typical tenant pool here? Any planned neighborhood developments (good or bad) we should know about?
- What's the average days-on-market for RENTAL listings here right now (not sales)? A rising rental-DOM trend means longer vacancies and softer asking-rent achievability than the comps imply.
- What's the recent tenant-quality profile in this submarket — average credit score on applications, eviction rate, late-payment / NSF rate, and stable-employment percentage? A property-management company in the area should have these aggregated.
- How much new for-sale + rental construction is in the pipeline within 1–3 miles? Heavy new supply typically softens prices + rents 12–24 months out; constrained supply supports both.
Investment metrics
- 1% rule
- 0.97% ✗
- Cap rate
- 7.07%
- Cash-on-cash
- 2.79%
- DSCR
- 1.12
- GRM
- 8.6
CMA / ARV
- ARV (median comp)
- $105,146
- List price
- $125,000
- Delta
- 18.88%
- Verdict
- OVERPRICED
- Comps
- 16 within 1.0 mi
Show comp detail 2 sales within ~0.75 mi
| Address | Dist | Beds/Ba | Sqft | Sold | Price | $/sf | Match |
|---|---|---|---|---|---|---|---|
| 332 W Potts St | 0.22mi | 3/2.0 | 1,394 (-7%) | 2mo | $125,000 | $90 | 72 |
| 413 W Bennett St | 0.53mi | 4/1.0 (+1) | 1,376 (-8%) | 7mo | $59,900 | $44 | 50 |
Match score weights: distance 35% · size 25% · config 20% · recency 20%. Top-matched comps best support the ARV.
Projected returns pro-forma
0.49% appreciation · 3.0% rent growth · sell at horizon
- IRR
- 2.6%
- Equity multiple
- 1.13×
- Total profit
- $4,456
- Equity at exit
- $39,380
- IRR
- 7.6%
- Equity multiple
- 1.87×
- Total profit
- $30,413
- Equity at exit
- $49,873
Cash invested: $35,000 (down + closing). Projections, not guarantees.
Landlord ↔ Tenant lean methodology
- Overall (STATE)
- 87 Strongly Landlord-Friendly
- State Texas
- 87 Strongly Landlord-Friendly · R+5
- County
- — inherits STATE
- City
- — inherits STATE
ZIP-level market 78355
- Home prices YoY
- 0.6%
- Active inventory
- 43
- Price-to-rent
- 8.6×
Monthly cashflow live
- Estimated rent
- $1,215 medium interval (Pro) →
- Mortgage (P&I)
- −$656
- Tax from tax record
- −$171 /mo · $2,052/yr
- Insurance
- −$52
- HOA
- −$0
- Vacancy / Maint / Mgmt
- −$255
- Net cashflow
- $81
Break-even live
Sensitivity live
| Price | -10% $152 | -5% $117 | +0% $81 | +5% $46 | +10% $11 |
|---|---|---|---|---|---|
| Rent | -10% $-15 | -5% $33 | +0% $81 | +5% $129 | +10% $177 |
| Rate | -1.0pp $144 | -0.5pp $113 | base $81 | +0.5pp $49 | +1.0pp $16 |
UW: 25.0% down · 7.5% · 30yr · 1.5% tax · 5.0% vac · 8.0% maint · 8.0% mgmt
Financing live
Cash to close
- Down payment
- $31,250
- Closing costs
- $3,750
- Reserves months
- —
- Total cash needed
- —
Loan-product check · same deal, 3 products live
Conventional
25% down · 7.5% · 30yr
- Down + closing
- —
- Monthly P&I
- —
- Monthly cashflow
- —
- DSCR
- —
- Eligible?
- —
Personal DTI + credit; lowest rate.
DSCR
20% down · 8.5% · 30yr
- Down + closing
- —
- Monthly P&I
- —
- Monthly cashflow
- —
- DSCR
- —
- Eligible?
- —
No personal income docs; deal must DSCR.
Hard money
10% down · 12.0% · 12mo
- Down + closing
- —
- Monthly P&I
- —
- Monthly cashflow
- —
- DSCR
- —
- Eligible?
- —
Short-term bridge; refi at stabilization.
Listing history 17 events
-
2026-06-21days on market $125,000 Active 61 DOM
-
2026-06-21days on market $125,000 Active 60 DOM
-
2026-06-18days on market $125,000 Active 58 DOM
-
2026-06-17days on market $125,000 Active 57 DOM
-
2026-06-16days on market $125,000 Active 56 DOM
-
2026-06-15days on market $125,000 Active 55 DOM
-
2026-06-13days on market $125,000 Active 53 DOM
-
2026-06-12days on market $125,000 Active 52 DOM
-
2026-06-09days on market $125,000 Active 49 DOM
-
2026-06-08days on market $125,000 Active 48 DOM
-
2026-06-08days on market $125,000 Active 47 DOM
-
2026-06-07days on market $125,000 Active 46 DOM
-
2026-06-03days on market $125,000 Active 43 DOM
-
2026-06-02days on market $125,000 Active 42 DOM
-
2026-06-01days on market $125,000 Active 41 DOM
-
2026-05-31days on market $125,000 Active 40 DOM
-
2026-04-17$125,000 Active 700-char remark
ⓘ Source: listings_history table (triggers on properties + properties_extension) + one-shot
backfill from property_details.listing_events for pre-trigger history.
Tax reassessment forecast TX · Resets to sale price
- Current annual tax
- $2,052 · $171/mo
- Projected year-2 tax
- $2,288 · $191/mo
- Expected delta
- +$235/yr (+$20/mo · 11.5%)
ⓘ Screening estimate from a state-policy table — verify with the county assessor before closing.
Nearby sold comps map
Loading sold comps map…
Walkable amenities ~0.75 mi
Loading nearby amenities…
Taxation est. · year 1
- Rental income
- $14,583
- − Mortgage interest
- −$7,002
- − Property taxes
- −$2,052
- − Insurance
- −$625
- − Repairs & maintenance
- −$1,167
- − Management
- −$1,167
- − Depreciation
- −$3,636
- Taxable loss
- −$1,066
- Est. tax savings @ 24.0%
- +$256
- After-tax cash flow
- $1,233/yr
For passive investors: Depreciation is non-cash, so a rental often shows a tax loss while cash-flowing — sheltering income. Rental losses are passive: they offset passive income freely, and up to $25,000/yr can offset ordinary (W-2) income if you actively participate and your MAGI is under $100k (phasing out to $0 by $150k); unused losses carry forward. On sale, claimed depreciation is recaptured at up to 25%, and gains may owe capital-gains tax (a 1031 exchange can defer both). Figures are a year-1 estimate at your 24.0% rate — not tax advice; consult a CPA.
Schools (NCES district)
- District
- Brooks County ISD
- NCES district ID
- 4811580
- Math proficiency
- 19% ▼ -16.00%
- Reading proficiency
- 26% ▼ -6.00%
- Median HH income
- $23,562
- Composite
- 17.44/100
- National rank
- #9064
- State rank
- #776 of 826 in TX
Livability — Falfurrias
- Score
- 72/100
- State rank
- #242
- US rank
- #5822
Category grades
Schools grade is shown separately in the Schools card above.
Census & demographics
- Census place
- Falfurrias, TX
- Population (ZIP)
- 6,843
Population outlook (Brooks County) Hauer SSP2
- Today (2025)
- 7,122 people
- By 2030
- 7,090 · -0.4%
- By 2040
- 7,023 · -1.4%
- By 2050
- 6,954 · -2.4%
- By 2075
- 6,413 · -10.0%
- By 2100
- 5,296 · -25.6%
Race, ethnicity, and origin ACS 2023
- Neighborhood character
- Predominantly Hispanic (91%)
- Race & ethnicity
- Hispanic / Latino 91% Two or more races 38% White 8%
- Hispanic origin (detail)
- Mexican 82%
- Common ancestry
- Lithuanian 5% Iranian 1%
- Foreign-born
- 7% · Canada
- Languages at home
- 30% English-only · Spanish 70%
Political lean MEDSL · Brooks
- 2024 margin
- Lean D (+9.6) · D 54.5% · R 44.8%
- 2008→2024 swing
- -42.0pp toward R · 2008: 51.6pp · 2024: 9.6pp
- All cycles
- 2024: D+9.6 2020: D+19.0 2016: D+51.0 2012: D+57.4 2008: D+51.6
Not yet ingested
- Civics
- —
Market trends
- HPI YoY
- ▲ 0.49%
- Current HPI
- 78.6241
- Rent YoY
- —
- Metro
- —
- State GDP YoY
- ▲ 3.95%
- F500 in state
- 110
Industry mix (Fortune 500 HQ in TX)
| Industry | F500 HQs | Revenue |
|---|---|---|
| Energy | 16 | $1,198B |
|
||
| Technology | 5 | $198B |
|
||
| Engineering / Construction | 4 | $72B |
|
||
| Energy Services | 3 | $60B |
|
||
| Utilities | 3 | $41B |
|
||
| Healthcare | 2 | $330B |
|
||
Price history
1 event — show timeline
- 2026-04-17 Listed $125,000 MCALLENMLS
Property tax history
+5.3%/yrLatest (2025): $2,052 · -4.1% YoY. Source: county tax records.
Cash-flow waterfall
monthlySold comps — $/sqft
last 12 mo · ≤1 miLoading sold comps…