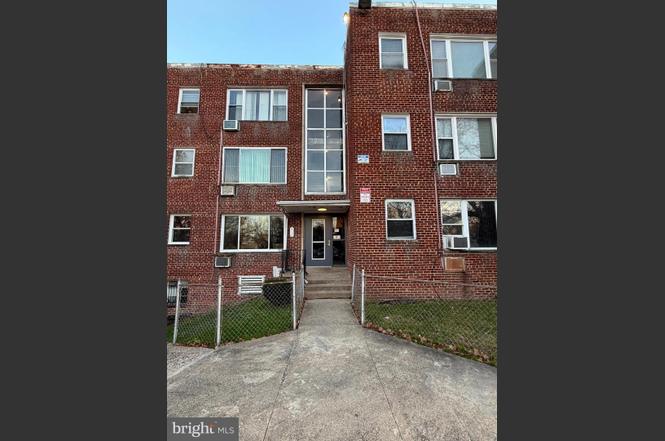
428 Ridge Rd SE #205 · Washington, DC
Flood risk 1/10 · Minimal
- FEMA flood zone
- X (unshaded)
- Chance of flooding over 30 yrs
- 0.0%
- Est. flood insurance / yr
- $507 – $1,088
Fire risk 2/10 · Minimal
- Est. fire insurance / yr
- $631 – $1,173
Heat risk 8/10 · Major
- Hot days now (above 104°F)
- 7 days/yr
- Hot days in 30 yrs
- 15 days/yr
Wind risk 4/10 · Minor
- Chance of severe wind over 30 yrs
- 20.0%
Air-quality risk 4/10 · Minor
- Unhealthy air days now
- 4 days/yr
- Unhealthy air days in 30 yrs
- 5 days/yr
Risk factors via First Street. Map © Google.
Why this score? — see what drove the B grade
The composite is a weighted blend of 9 inputs, each scored 0–100. Each bar is that input's sub-score; the figure is the points it added to the 100-point composite (weight × sub-score).
- Cash flow +30.0/30.0
- 1% rule +10.0/10.0
- DSCR +10.0/10.0
- ARV discount +7.5/15.0
- Rent growth +4.0/5.0
- Livability +3.7/5.0
- Schools +3.6/10.0
- Condition / age +2.5/5.0
- Appreciation +0.0/10.0
$64,999
🖨 Deal sheet (PDF) 📄 Offer letter ✓ Due diligence
Listing remarks MLS
Great Condo for the money. Move right in and start living.
Key facts
- Investment potential
- Steady rental income
- $374 HOA
Tags
Property features AI
Finance
- HOA & community: Condo fee of $374 per month; Professionally managed off-site; Condo fee includes trash, water, sewer, lawn maintenance and heat; Property manager present; Pets allowed (cats, dogs; case-by-case)
Exterior
- Parking: On-street parking
- Utilities: Public water; Public sewer; Natural gas for heating and hot water; Electric for cooling
- Home design: Condominium penthouse in a garden-style building (1–4 stories); Entry on level 1; Estimated year built
- Construction: Brick construction; Above grade and below grade structures
- Exterior features: Not located in a federal flood zone; In city limits
Interior
- Bedrooms: 1 bedroom on main level
- Bathrooms: 1 full bathroom on main level
- Heating & cooling: Radiator heating (natural gas hot water); Window air conditioning units (electric)
- Interior features: No basement; Assessor-reported living area
- Laundry & utility: No in-unit washer/dryer hookup
Neighborhood map
What this means for you Summary
Snapshot
- This is a 2-bed/1.0-bath condo listed at $65k.
Deal economics
- At list price, monthly cash flow is $507 ($6k/yr) — positive.
- The deal already cash-flows at list — no discount required.
- Meets the 1% rule at list price ($2k rent vs $65k).
- Recommended offer: $57k (12.0% below list) — sets the bar for market timing.
- Cap rate 15.7% vs local median 2.5% in Washington — top-decile yield for the area; either an underpriced asset or a hidden risk that comps aren't pricing in. Stress-test before assuming the spread holds.
Location & tenants
- Location reads 73/100 on livability (#1 in DC) — a middle-class / working-renter tenant base. Strengths: amenities A+, commute A+, employment A+; Watch: crime F, cost of living F.
- District Of Columbia Public Schools (urban): math 33% / reading 40% proficiency, ranked #8 of 32 in DC (top 25%) — families likely to look elsewhere, expect single-tenant / working-renter base with shorter leases; 65% free/reduced lunch — lower-income household profile, screen leases tightly.
- Market conditions: Rents rising fast (+6.1%/yr); 281 active listings in the ZIP; 40 comparable units currently listed for rent nearby; rentals at typical pace (median 25d on market — plan ~3-4 weeks tenant-placement turnaround); 1,737 units permitted in District of Columbia in 2024 (1,506 in 5+ unit buildings).
- This rent runs 34% of the median local income ($58k/yr) — at the standard rent-burdened threshold; future hikes will face affordability resistance.
Forward outlook
- Local home prices are declining (-3.0%/yr); year-one equity from $449 of loan paydown is wiped out by about $2k of value loss. Plan a longer hold.
- District of Columbia County population projected at +50% by 2050 — long-run rental-demand tailwind backs the buy-and-hold thesis.
- At projected returns (-3.0% appreciation + 6.1% rent growth), your $18k cash investment doubles in ~4 years — after that, you're playing with house money.
Negotiation context
- It's been on market 173 days — a 12% lower offer ($57k) is reasonable based on typical stale-listing flexibility.
- 3 sale attempts since 14y ago with the ask held roughly flat each time — persistent listings suggest the price (not the market) is what's stuck; bring a comps-based counter.
- Current owner paid $40k; list at $65k implies a 65% gain — meaningful room to come down on a strong offer.
Risks & watch-outs
- Watch-outs: HOA is 23% of rent; built in 1958 — expect roof / HVAC / electrical / plumbing capex.
- Climate carrying-cost: extreme-heat days projected 7→15/yr by 2055 (HVAC capex compounding) — expect insurance premiums to compound above CPI over the hold.
Questions for the listing agent
- It's been on market 173 days. Have you received any prior offers? Is the seller open to a 12% concession, seller financing, or rate buy-down credit?
- Built in 1958 — when were the roof, HVAC, electrical panel, plumbing, and water heater last replaced?
- What does the HOA fee cover, when was the last increase, and are there any pending special assessments or reserve-fund shortfalls?
- Any open or pending special assessments — roof, HVAC, plumbing, elevator, façade? What's the per-unit balance and payoff schedule, and is the seller paying it off at close or rolling it to the buyer?
- Why hasn't it sold? Are there any deal-killer items the seller is aware of (foundation, flood, title, zoning, code violations)?
- Is there a deadline driving the sale (1031 exchange, divorce, estate, relocation)? That informs how much negotiation room exists.
- Crime grade is F in this area — have there been break-ins, vandalism, or insurance claims at this property in the last 3 years? What carrier currently insures it and at what premium?
- What's the average days-on-market for RENTAL listings here right now (not sales)? A rising rental-DOM trend means longer vacancies and softer asking-rent achievability than the comps imply.
- What's the recent tenant-quality profile in this submarket — average credit score on applications, eviction rate, late-payment / NSF rate, and stable-employment percentage? A property-management company in the area should have these aggregated.
- How much new apartment / multifamily construction is in the pipeline within 1–3 miles? Heavy new supply (>2% of stock underway) typically softens rents 12–24 months out; light construction supports rent growth.
Investment metrics
- 1% rule
- 2.52% ✓
- Cap rate
- 15.66%
- Cash-on-cash
- 33.45%
- DSCR
- 2.49
- GRM
- 3.3
CMA / ARV
No comps found within radius.
Projected returns pro-forma
-3.0% appreciation · 6.06% rent growth · sell at horizon
- IRR
- 33.5%
- Equity multiple
- 2.49×
- Total profit
- $27,198
- Equity at exit
- $9,692
- IRR
- 42.6%
- Equity multiple
- 5.89×
- Total profit
- $88,913
- Equity at exit
- $5,620
Cash invested: $18,200 (down + closing). Projections, not guarantees.
Landlord ↔ Tenant lean methodology
- Overall (CITY)
- 0 Strongly Tenant-Friendly
- State District of Columbia
- 12 Strongly Tenant-Friendly · D+43
- County
- — inherits STATE
- City Washington
- 0 Strongly Tenant-Friendly · D+43
ZIP-level market 20019
- Rents YoY
- 6.1%
- Active inventory
- 281
- Price-to-rent
- 3.3×
Monthly cashflow live
- Estimated rent
- $1,636 high interval (Pro) →
- Mortgage (P&I)
- −$341
- Tax from tax record
- −$44 /mo · $523/yr
- Insurance
- −$27
- HOA
- −$374
- Vacancy / Maint / Mgmt
- −$344
- Net cashflow
- $507
Break-even live
Sensitivity live
| Price | -10% $544 | -5% $526 | +0% $507 | +5% $489 | +10% $470 |
|---|---|---|---|---|---|
| Rent | -10% $378 | -5% $443 | +0% $507 | +5% $572 | +10% $637 |
| Rate | -1.0pp $540 | -0.5pp $524 | base $507 | +0.5pp $490 | +1.0pp $473 |
UW: 25.0% down · 7.5% · 30yr · 1.5% tax · 5.0% vac · 8.0% maint · 8.0% mgmt
Financing live
Cash to close
- Down payment
- $16,250
- Closing costs
- $1,950
- Reserves months
- —
- Total cash needed
- —
Loan-product check · same deal, 3 products live
Conventional
25% down · 7.5% · 30yr
- Down + closing
- —
- Monthly P&I
- —
- Monthly cashflow
- —
- DSCR
- —
- Eligible?
- —
Personal DTI + credit; lowest rate.
DSCR
20% down · 8.5% · 30yr
- Down + closing
- —
- Monthly P&I
- —
- Monthly cashflow
- —
- DSCR
- —
- Eligible?
- —
No personal income docs; deal must DSCR.
Hard money
10% down · 12.0% · 12mo
- Down + closing
- —
- Monthly P&I
- —
- Monthly cashflow
- —
- DSCR
- —
- Eligible?
- —
Short-term bridge; refi at stabilization.
Rent comps 40 comps
| Address | Beds | Baths | Sqft | Rent | $/sqft | DOM | Units | Dist |
|---|---|---|---|---|---|---|---|---|
| 3738 D St SE Washington, DC | 1.0–2.0 | 1.0 | 542 | $1,549 | $2.86 | 8d | 12 | 0.12mi |
| 429 Burbank St SE Apt 4 Washington, DC | 1.0 | 1.0 | 594 | $1,235 | $2.08 | 25d | 1 | 0.20mi |
| 305 37th St SE Washington, DC | 1.0–2.0 | 1.0–1.5 | 787 | $1,550 | $1.97 | 25d | 1 | 0.36mi |
| 3600 Ely Pl SE Washington, DC | 1.0–3.0 | 1.0 | 719 | $2,088 | $2.90 | 3d | 10 | 0.40mi |
| 301 Anacostia Rd SE Unit 2 BEDROOM Washington, DC | 2.0 | 1.0 | 600 | $1,300 | $2.17 | 25d | 1 | 0.42mi |
| 4040 E Capitol St NE Washington, DC | 1.0–2.0 | 1.0–1.5 | 716 | $1,608 | $2.24 | 8d | 1 | 0.44mi |
| 3516 Ely Pl SE Unit 4 Washington, DC | 1.0 | 1.0 | 700 | $1,450 | $2.07 | 25d | 1 | 0.44mi |
| 319 Anacostia Rd SE Unit 1 Washington, DC | 2.0 | 1.0 | 724 | $1,035 | $1.43 | 25d | 1 | 0.45mi |
| 3539 A St SE Washington, DC | 1.0–2.0 | 1.0–2.0 | 807 | $1,403 | $1.74 | 18d | 1 | 0.51mi |
| 4805 Texas Ave SE Washington, DC | 1.0–2.0 | 1.0 | 775 | $1,400 | $1.81 | 25d | 1 | 0.55mi |
| 3427 B St SE Unit 4 Washington, DC | 1.0 | 1.0 | 558 | $1,300 | $2.33 | 25d | 1 | 0.56mi |
| 3315 Dubois Pl SE Washington, DC | 1.0 | 1.0 | 650 | $1,000 | $1.54 | 25d | 1 | 0.65mi |
| 4511 B St SE Washington, DC | 1.0–2.0 | 1.0 | 675 | $1,650 | $2.44 | 25d | 2 | 0.65mi |
| 165 35th St NE Unit 2 Washington, DC | 1.0 | 1.0 | 700 | $1,495 | $2.14 | 25d | 1 | 0.66mi |
| 165 35th St NE Unit 3 Washington, DC | 1.0 | 1.0 | 750 | $1,625 | $2.17 | 25d | 1 | 0.66mi |
| 3313 C St SE Washington, DC | 1.0–2.0 | 1.0 | 750 | $1,343 | $1.79 | 2d | 2 | 0.66mi |
| 4701 Benning Rd SE Washington, DC | 1.0 | 1.0 | 600 | $1,100 | $1.83 | 25d | 1 | 0.66mi |
| 195 35th St NE Unit 1 Washington, DC | 2.0 | 1.0 | 716 | $1,800 | $2.51 | 25d | 1 | 0.67mi |
| 4236 Benning Rd NE Washington, DC | 1.0 | 1.0 | 700 | $1,095 | $1.56 | 5d | 1 | 0.68mi |
| 212 36th St NE #1 Washington, DC | 2.0 | 1.0 | 750 | $2,550 | $3.40 | 25d | 1 | 0.68mi |
| 212 36th St NE #3 Washington, DC | 3.0 | 1.0 | 750 | $3,450 | $4.60 | 25d | 1 | 0.68mi |
| 4800 C St SE #302 Washington, DC | 1.0 | 1.0 | 502 | $1,440 | $2.87 | 25d | 1 | 0.72mi |
| 4732 Benning Rd SE #102 Washington, DC | 1.0 | 1.0 | 581 | $1,150 | $1.98 | 25d | 1 | 0.73mi |
| 4820 C St SE #304 Washington, DC | 2.0 | 1.0 | 635 | $1,600 | $2.52 | 25d | 1 | 0.75mi |
| 140 Kenilworth Ave NE Unit 3B Washington, DC | 1.0 | 1.0 | 455 | $1,160 | $2.55 | 25d | 1 | 0.77mi |
| 140 Kenilworth Ave NE Unit 1A Washington, DC | 2.0 | 1.0 | 573 | $1,567 | $2.73 | 25d | 1 | 0.77mi |
| 4601 Blaine St NE Unit 1 Washington, DC | 2.0 | 1.0 | 750 | $1,500 | $2.00 | 25d | 1 | 0.77mi |
| 208 Kenilworth Ave NE Unit 3B Washington, DC | 1.0 | 1.0 | 465 | $1,122 | $2.41 | 25d | 1 | 0.77mi |
| 208 Kenilworth Ave NE Unit 1C Washington, DC | 1.0 | 1.0 | 465 | $1,163 | $2.50 | 25d | 1 | 0.77mi |
| 324 Saint Louis St SE Washington, DC | 2.0 | 1.0 | 640 | $1,750 | $2.73 | 8d | 1 | 0.79mi |
| 3306 E Capitol St NE Unit C Washington, DC | 1.0 | 1.0 | 525 | $1,175 | $2.24 | 4d | 1 | 0.80mi |
| 3208 E Capitol St NE Unit C Washington, DC | 1.0 | 1.0 | 510 | $1,175 | $2.30 | 4d | 1 | 0.84mi |
| 3206 E Capitol St NE Apt D Washington, DC | 1.0 | 1.0 | 510 | $1,291 | $2.53 | 25d | 1 | 0.85mi |
| 4255 Eads St NE Unit 3 Washington, DC | 2.0 | 1.0 | 610 | $1,750 | $2.87 | 23d | 1 | 0.88mi |
| 4919 A St SE Unit 202 Washington, DC | 2.0 | 1.0 | 625 | $1,900 | $3.04 | 25d | 1 | 0.90mi |
| 4930 A St SE Unit 203 Washington, DC | 3.0 | 1.0 | 750 | $2,815 | $3.75 | 25d | 1 | 0.91mi |
| 3311 Clay Pl NE Washington, DC | 2.0 | 1.0 | 709 | $1,995 | $2.81 | 25d | 1 | 0.96mi |
| 3022 K St SE Washington, DC | 1.0 | 1.0 | 675 | $1,348 | $2.00 | 6d | 2 | 0.97mi |
| 5045 Call Pl SE #203 Washington, DC | 1.0 | 1.0 | 693 | $2,000 | $2.89 | 25d | 1 | 0.98mi |
| 819 51st St SE Unit 5 Washington, DC | 1.0 | 1.0 | 650 | $1,000 | $1.54 | 8d | 1 | 0.98mi |
HOA detail condo
- Monthly dues
- $374 · $4,488/yr
- Assessments
- None detected in remarks — confirm with the listing agent.
Listing history 22 events
-
2026-06-21days on market $64,999 Active 173 DOM
-
2026-06-18days on market $64,999 Active 170 DOM
-
2026-06-17days on market $64,999 Active 169 DOM
-
2026-06-16days on market $64,999 Active 168 DOM
-
2026-06-15days on market $64,999 Active 167 DOM
-
2026-06-13days on market $64,999 Active 165 DOM
-
2026-06-09days on market $64,999 Active 161 DOM
-
2026-06-08days on market $64,999 Active 160 DOM
-
2026-06-07days on market $64,999 Active 159 DOM
-
2026-06-04days on market $64,999 Active 156 DOM
-
2026-06-03days on market $64,999 Active 155 DOM
-
2026-06-02days on market $64,999 Active 154 DOM
-
2026-06-01days on market $64,999 Active 153 DOM
-
2026-05-31days on market $64,999 Active 152 DOM
-
2025-12-30$64,999 Active
-
2012-07-31soldstatus $39,500 Sold 58-char remark
Show marketing remark (58 chars)
Great Condo for the money. Move right in and start living.
-
2012-07-31soldstatus $39,500 58-char remark
Show marketing remark (58 chars)
Great Condo for the money. Move right in and start living.
-
2012-07-08status Contract 58-char remark
Show marketing remark (58 chars)
Great Condo for the money. Move right in and start living.
-
2012-07-07historical 58-char remark
Show marketing remark (58 chars)
Great Condo for the money. Move right in and start living.
-
2012-06-22$40,000 Active 58-char remark
Show marketing remark (58 chars)
Great Condo for the money. Move right in and start living.
-
2012-06-22$40,000 58-char remark
Show marketing remark (58 chars)
Great Condo for the money. Move right in and start living.
-
1984-06-07soldstatus $25,000
ⓘ Source: listings_history table (triggers on properties + properties_extension) + one-shot
backfill from property_details.listing_events for pre-trigger history.
Tax reassessment forecast DC · Partial reset (capped growth)
- Current annual tax
- $523 · $44/mo
- Projected year-2 tax
- $523 · $44/mo
- Expected delta
- $0/yr ($0/mo · 0.0%)
ⓘ Screening estimate from a state-policy table — verify with the county assessor before closing.
Climate risk First Street
- Flood 1/10 Low FEMA zone X (unshaded) · 0% chance over 30 yrs
- Wildfire 2/10 Low
- Heat 8/10 Severe 7 d/yr ≥104°F today · 15 d/yr by 30 yrs out
- Wind 4/10 Moderate 20% chance of damaging wind over 30 yrs
- Air quality 4/10 Moderate 4 unhealthy d/yr today · 5 by 30 yrs out
Nearby sold comps map
Loading sold comps map…
Walkable amenities ~0.75 mi
Loading nearby amenities…
Taxation est. · year 1
- Rental income
- $19,637
- − Mortgage interest
- −$3,641
- − Property taxes
- −$523
- − Insurance
- −$325
- − Repairs & maintenance
- −$1,571
- − Management
- −$1,571
- − HOA
- −$4,488
- − Depreciation
- −$1,891
- Taxable income
- $5,627
- Est. tax owed @ 24.0%
- −$1,351
- After-tax cash flow
- $4,736/yr
For passive investors: Depreciation is non-cash, so a rental often shows a tax loss while cash-flowing — sheltering income. Rental losses are passive: they offset passive income freely, and up to $25,000/yr can offset ordinary (W-2) income if you actively participate and your MAGI is under $100k (phasing out to $0 by $150k); unused losses carry forward. On sale, claimed depreciation is recaptured at up to 25%, and gains may owe capital-gains tax (a 1031 exchange can defer both). Figures are a year-1 estimate at your 24.0% rate — not tax advice; consult a CPA.
Schools (NCES district)
- District
- District Of Columbia Public Schools
- NCES district ID
- 1100030
- Math proficiency
- 33% ▲ 3.00%
- Reading proficiency
- 40% ▲ 5.00%
- Median HH income
- $67,671
- Composite
- 35.84/100
- National rank
- #9606
- State rank
- #8 of 32 in DC
Livability — Washington
- Score
- 73/100
- State rank
- #1
- US rank
- #5327
Category grades
Schools grade is shown separately in the Schools card above.
Census & demographics
- Census place
- Washington, DC
- County
- District of Columbia · 671,873 people
- City population
- 671,873
- Metro
- Washington-Arlington-Alexandria, DC-VA-MD-WV
- Population (ZIP)
- 63,380
- Household income
- $58,296
- Rent vs Own
- Severe rent burden
- 5115.0
Population outlook (District of Columbia County) Hauer SSP2
- Today (2025)
- 821,926 people
- By 2030
- 899,517 · +9.4%
- By 2040
- 1,061,162 · +29.1%
- By 2050
- 1,231,493 · +49.8%
- By 2075
- 1,603,312 · +95.1%
- By 2100
- 1,847,141 · +124.7%
Race, ethnicity, and origin ACS 2023
- Neighborhood character
- Predominantly Black (87%)
- Race & ethnicity
- Black 87% Hispanic / Latino 7% Two or more races 4% White 2%
- Hispanic origin (detail)
- Mexican 1% Dominican 1%
- Foreign-born
- 6% · Canada
- Languages at home
- 91% English-only · Spanish 6% French/Haitian/Cajun 1%
Political lean MEDSL · District of Columbia
- 2024 margin
- Solid D (+86.1) · D 91.2% · R 5.1% · Other 3.8%
- 2008→2024 swing
- +0.1pp no change · 2008: 85.9pp · 2024: 86.1pp
- All cycles
- 2024: D+86.1 2020: D+86.8 2016: D+88.7 2012: D+84.2 2008: D+85.9
Not yet ingested
- Civics
- —
Market trends
- HPI YoY
- ▼ -416.91%
- Current HPI
- 326.4481
- Rent YoY
- ▲ 6.06%
- Metro
- Washington-Arlington-Alexandria, DC-VA-MD-WV
- State GDP YoY
- ▲ 1.33%
- F500 in state
- 6
Industry mix (Fortune 500 HQ in DC)
| Industry | F500 HQs | Revenue |
|---|---|---|
| Financial Services | 1 | $153B |
|
||
| Life Sciences / Industrials | 1 | $25B |
|
||
| Industrial Machinery | 1 | $8B |
|
||
Price history
+160.0% since first listed8 events — show timeline
- 2025-12-30 Listed $64,999 BRIGHT MLS
- 2012-07-31 Sold (MLS) $39,500 BRIGHT MLS
- 2012-07-31 Sold (MLS) $39,500 MRIS
- 2012-07-08 Pending — MRIS
- 2012-07-07 Listing Removed — BRIGHT MLS
- 2012-06-22 Listed $40,000 MRIS
- 2012-06-22 Listed $40,000 BRIGHT MLS
- 1984-06-07 Sold (Public Records) $25,000 Public Records
Property tax history
+7.6%/yrLatest (2025): $523 · -0.7% YoY. Source: county tax records.
Cash-flow waterfall
monthlySold comps — $/sqft
last 12 mo · ≤1 miLoading sold comps…