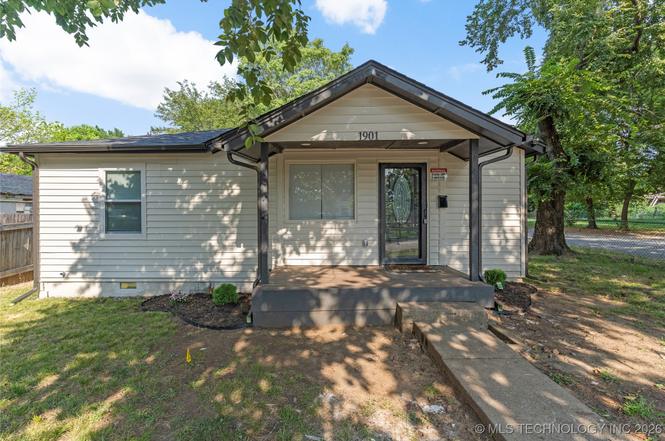
1901 N Atlanta Ave · Tulsa, OK
Flood risk 1/10 · Minimal
- FEMA flood zone
- X (unshaded)
- Chance of flooding over 30 yrs
- 0.0%
- Est. flood insurance / yr
- $507 – $1,088
Fire risk 2/10 · Minimal
- Est. fire insurance / yr
- $2,463 – $4,575
Heat risk 6/10 · Moderate
- Hot days now (above 110°F)
- 7 days/yr
- Hot days in 30 yrs
- 18 days/yr
Wind risk 2/10 · Minimal
- Chance of severe wind over 30 yrs
- 4.0%
Air-quality risk 2/10 · Minimal
- Unhealthy air days now
- 2 days/yr
- Unhealthy air days in 30 yrs
- 2 days/yr
Risk factors via First Street. Map © Google.
Why this score? — see what drove the C- grade
The composite is a weighted blend of 9 inputs, each scored 0–100. Each bar is that input's sub-score; the figure is the points it added to the 100-point composite (weight × sub-score).
- Cash flow +17.9/30.0
- Appreciation +9.3/10.0
- ARV discount +7.5/15.0
- DSCR +5.6/10.0
- Livability +3.8/5.0
- 1% rule +3.6/10.0
- Rent growth +2.9/5.0
- Condition / age +2.5/5.0
- Schools +0.8/10.0
$128,000
🖨 Deal sheet (PDF) 📄 Offer letter ✓ Due diligence
Listing remarks
Owner to Owner financing Available! Step into this beautifully updated 3-bedroom, 1-bath home situated on a spacious corner lot! Perfect for a first-time buyer or a savvy investor, this home offers fresh upgrades throughout. Whether you're looking for a move-in ready home or a turnkey rental, this property checks all the boxes. New roof, new windows, new appliances are just some of the many upgrades this house has to offer. Conveniently located with quick access to downtown Tulsa, highways, and local schools. Don't miss this versatile opportunity! Owner/Agent
Key facts
- New appliances
- Local schools
- Corner lot
Tags
Property features AI
Finance
- HOA & community: Gutter(s) listed as community/maintenance feature
Exterior
- Parking: Detached garage (1 car)
- Security: Smoke detector(s); No safety shelter
- Utilities: Electricity available; Natural gas available; Public water; Public sewer
- Home design: Single-story home; Faces west; Entry on first level
- Construction: Wood siding; Wood frame construction; Asphalt/fiberglass roof; Crawlspace foundation; Year built (source: appraiser)
- Exterior features: Concrete driveway; Rain gutters; Patio; Full fence; Corner lot
Interior
- Kitchen: Dishwasher; Disposal; Microwave; Oven; Range/Stove
- Flooring: Carpet; Laminate; Tile
- Bathrooms: One full bathroom (hall bath with bathtub)
- Heating & cooling: Central heating (electric and gas); Central air conditioning
- Interior features: Butcher block counters; Ceiling fan(s); Gas range connection; Gas oven connection; Vinyl windows
- Laundry & utility: Washer hookup; Gas dryer hookup; Utility room (garage)
Neighborhood map
What this means for you Summary
Snapshot
- This is a 3-bed/1.0-bath single-family listed at $128k.
Deal economics
- At list price, monthly cash flow is $107 ($1k/yr) — positive.
- The deal already cash-flows at list — no discount required.
- To meet the 1% rule (rent ≥ 1% of price), the offer needs to be $111k (13.6% below list).
- Recommended offer: $111k (13.6% below list) — sets the bar for 1% rule.
Location & tenants
- Location reads 75/100 on livability (#13 in OK, #4,058 nationally) — a middle-class / working-renter tenant base. Strengths: amenities A+, commute A+, cost of living A+; Watch: crime F, employment D-.
- Tulsa (urban): math 7% / reading 12% proficiency, ranked #250 of 270 in OK (top 93%) — low school quality limits family demand, transient renter base, plan for 1-2y turnover; 76% free/reduced lunch — lower-income household profile, screen leases tightly.
- Zoned schools: Project Accept Traice Es (math 10% / reading 10%, grade F, #695 of 845 statewide, top 84%, 558 students, 0% FRL); Monroe Demonstration Ms (math 0% / reading 2%, grade F, #344 of 345 statewide, top 100%, 688 students, 0% FRL); Booker T. Washington Hs (math 41% / reading 61%, grade D+, #2 of 447 statewide, top 0%, 1,280 students, 0% FRL) — zoned schools average 0% FRL vs 76% district-wide (76 pts lower); this property's tenant base skews higher-income than the district average.
- Market conditions: Rents rising (+1.8%/yr); 58 active listings in the ZIP; 10 comparable units currently listed for rent nearby; rentals at typical pace (median 26d on market — plan ~3-4 weeks tenant-placement turnaround); lower-income renter base — watch delinquency; 2,818 units permitted in Tulsa County in 2024 (518 in 5+ unit buildings).
Forward outlook
- In year one you build about $12k of equity ($885 loan paydown + $11k appreciation (8.7% local appreciation)).
- Tulsa County population projected at +30% by 2050 — long-run rental-demand tailwind backs the buy-and-hold thesis.
- At projected returns (8.7% appreciation + 1.8% rent growth), your $36k cash investment doubles in ~3 years — after that, you're playing with house money.
- By year 3, paydown + projected appreciation supports a ~$30k cash-out refi (75% LTV) — recoverable capital for the next deal without selling this one.
Negotiation context
- It's been on market 75 days — a 6% lower offer ($120k) is reasonable based on typical stale-listing flexibility.
- 5 sale attempts with the ask held roughly flat each time — persistent listings suggest the price (not the market) is what's stuck; bring a comps-based counter.
- Current owner paid $19k; list at $128k implies a 574% gain — meaningful room to come down on a strong offer.
Risks & watch-outs
- Watch-outs: built in 1940 — expect roof / HVAC / electrical / plumbing capex.
- Climate carrying-cost: extreme-heat days projected 7→18/yr by 2055 (HVAC capex compounding) — expect insurance premiums to compound above CPI over the hold.
Questions for the listing agent
- It's been on market 75 days. Have you received any prior offers? Is the seller open to a 14% concession, seller financing, or rate buy-down credit?
- Built in 1940 — when were the roof, HVAC, electrical panel, plumbing, and water heater last replaced?
- Why hasn't it sold? Are there any deal-killer items the seller is aware of (foundation, flood, title, zoning, code violations)?
- Is there a deadline driving the sale (1031 exchange, divorce, estate, relocation)? That informs how much negotiation room exists.
- Schools are F-rated, which usually means shorter tenancies and higher turnover. Who's the typical renter profile here, and what's been the actual vacancy rate?
- Crime grade is F in this area — have there been break-ins, vandalism, or insurance claims at this property in the last 3 years? What carrier currently insures it and at what premium?
- What's the average days-on-market for RENTAL listings here right now (not sales)? A rising rental-DOM trend means longer vacancies and softer asking-rent achievability than the comps imply.
- What's the recent tenant-quality profile in this submarket — average credit score on applications, eviction rate, late-payment / NSF rate, and stable-employment percentage? A property-management company in the area should have these aggregated.
- How much new for-sale + rental construction is in the pipeline within 1–3 miles? Heavy new supply typically softens prices + rents 12–24 months out; constrained supply supports both.
Investment metrics
- 1% rule
- 0.86% ✗
- Cap rate
- 7.30%
- Cash-on-cash
- 3.59%
- DSCR
- 1.16
- GRM
- 9.6
CMA / ARV
- ARV (on-the-fly)
- $83,129
- Comps found
- 12
Show comp detail 12 sales within ~0.75 mi
| Address | Dist | Beds/Ba | Sqft | Sold | Price | $/sf | Match |
|---|---|---|---|---|---|---|---|
| 1901 N Atlanta Ave | 0.00mi | 3/1.0 | 909 (+6%) | 0mo | $131,500 | $145 | 90 |
| 1920 N Lewis Pl | 0.08mi | 2/1.0 (-1) | 928 (+8%) | 6mo | $35,000 | $38 | 73 |
| 2018 N Delaware Pl | 0.43mi | 3/1.0 | 888 (+4%) | 3mo | $153,000 | $172 | 72 |
| 2320 N Atlanta Pl | 0.37mi | 2/1.0 (-1) | 910 (+6%) | 2mo | $119,900 | $132 | 66 |
| 2032 N Evanston Pl | 0.55mi | 3/1.0 | 912 (+6%) | 2mo | $61,000 | $67 | 62 |
| 2918 E Woodrow St | 0.61mi | 2/1.0 (-1) | 876 (+2%) | 2mo | $62,500 | $71 | 62 |
| 1819 N Xanthus Ave | 0.41mi | 2/1.0 (-1) | 914 (+7%) | 15mo | $35,000 | $38 | 52 |
| 1308 N Delaware Pl | 0.71mi | 3/1.0 | 832 (-3%) | 13mo | $136,900 | $165 | 51 |
| 2707 E Marshall St | 0.71mi | 3/1.0 | 965 (+13%) | 2mo | $105,000 | $109 | 45 |
| 3116 E Woodrow St | 0.71mi | 2/1.0 (-1) | 910 (+6%) | 10mo | $88,500 | $97 | 43 |
| 2915 E Virgin St | 0.59mi | 3/2.0 | 984 (+15%) | 13mo | $88,000 | $89 | 32 |
| 3127 E Virgin St | 0.73mi | 2/1.0 (-1) | 941 (+10%) | 15mo | $83,000 | $88 | 32 |
Match score weights: distance 35% · size 25% · config 20% · recency 20%. Top-matched comps best support the ARV.
Projected returns pro-forma
8.69% appreciation · 1.78% rent growth · sell at horizon
- IRR
- 23.8%
- Equity multiple
- 2.78×
- Total profit
- $63,890
- Equity at exit
- $103,334
- IRR
- 21.1%
- Equity multiple
- 5.97×
- Total profit
- $178,015
- Equity at exit
- $211,215
Cash invested: $35,840 (down + closing). Projections, not guarantees.
Landlord ↔ Tenant lean methodology
- Overall (STATE)
- 83 Strongly Landlord-Friendly
- State Oklahoma
- 83 Strongly Landlord-Friendly · R+20
- County
- — inherits STATE
- City
- — inherits STATE
ZIP-level market 74110
- Home prices YoY
- 3.2%
- Rents YoY
- 1.8%
- Active inventory
- 58
- Price-to-rent
- 9.6×
Monthly cashflow live
- Estimated rent
- $1,106 high interval (Pro) →
- Mortgage (P&I)
- −$671
- Tax from tax record
- −$42 /mo · $505/yr
- Insurance
- −$53
- HOA
- −$0
- Vacancy / Maint / Mgmt
- −$232
- Net cashflow
- $107
Break-even live
Sensitivity live
| Price | -10% $180 | -5% $144 | +0% $107 | +5% $71 | +10% $35 |
|---|---|---|---|---|---|
| Rent | -10% $20 | -5% $64 | +0% $107 | +5% $151 | +10% $195 |
| Rate | -1.0pp $172 | -0.5pp $140 | base $107 | +0.5pp $74 | +1.0pp $40 |
UW: 25.0% down · 7.5% · 30yr · 1.5% tax · 5.0% vac · 8.0% maint · 8.0% mgmt
Financing live
Cash to close
- Down payment
- $32,000
- Closing costs
- $3,840
- Reserves months
- —
- Total cash needed
- —
Loan-product check · same deal, 3 products live
Conventional
25% down · 7.5% · 30yr
- Down + closing
- —
- Monthly P&I
- —
- Monthly cashflow
- —
- DSCR
- —
- Eligible?
- —
Personal DTI + credit; lowest rate.
DSCR
20% down · 8.5% · 30yr
- Down + closing
- —
- Monthly P&I
- —
- Monthly cashflow
- —
- DSCR
- —
- Eligible?
- —
No personal income docs; deal must DSCR.
Hard money
10% down · 12.0% · 12mo
- Down + closing
- —
- Monthly P&I
- —
- Monthly cashflow
- —
- DSCR
- —
- Eligible?
- —
Short-term bridge; refi at stabilization.
Rent comps 10 comps
| Address | Beds | Baths | Sqft | Rent | $/sqft | DOM | Units | Dist |
|---|---|---|---|---|---|---|---|---|
| 1807 N Atlanta Ave Tulsa, OK | 3.0 | 1.0 | 812 | $995 | $1.23 | 25d | 1 | 0.07mi |
| 1623 N Atlanta Ave Tulsa, OK | 3.0 | 1.0 | 975 | $1,175 | $1.21 | 5d | 1 | 0.19mi |
| 1928 N Columbia Pl Tulsa, OK | 2.0 | 1.0 | 888 | $1,000 | $1.13 | 17d | 1 | 0.27mi |
| 1816 N Delaware Pl Tulsa, OK | 3.0 | 1.0 | 990 | $950 | $0.96 | 5d | 1 | 0.40mi |
| 1507 N Florence Ave Tulsa, OK | 3.0 | 1.0 | 1000 | $1,100 | $1.10 | 25d | 1 | 0.74mi |
| 3326 E Marshall St Unit 1 Tulsa, OK | 2.0 | 1.0 | 700 | $825 | $1.18 | 25d | 1 | 1.20mi |
| 3326 E Marshall St Apt 4 Tulsa, OK | 2.0 | 1.0 | 750 | $925 | $1.23 | 25d | 1 | 1.20mi |
| 1830 N New Haven Ave Tulsa, OK | 2.0 | 1.0 | 840 | $1,295 | $1.54 | 25d | 1 | 1.21mi |
| 4008 E Virgin St Tulsa, OK | 3.0 | 1.0 | 1125 | $1,400 | $1.24 | 5d | 1 | 1.33mi |
| 2529 E Admiral Pl Unit A Tulsa, OK | 2.0 | 1.0 | 1100 | $1,295 | $1.18 | 25d | 1 | 1.45mi |
Listing history 19 events
-
2026-05-14status Pending
-
2026-04-15status Active
-
2026-04-07status Pending
-
2026-03-16price $128,000
-
2026-03-11status Active
-
2026-02-23status Pending
-
2026-02-04$133,000 Active
-
2026-02-04historical
-
2026-01-28price $133,000
-
2025-12-23status Active
-
2025-12-23price $138,000
-
2025-11-21status Pending
-
2025-11-14price $130,000
-
2025-09-24price $135,000
-
2025-09-03price $138,000
-
2025-08-12price $148,000
-
2025-08-06$155,000 Active
-
1997-08-01soldstatus $19,000
-
1991-04-03soldstatus $9,500
ⓘ Source: listings_history table (triggers on properties + properties_extension) + one-shot
backfill from property_details.listing_events for pre-trigger history.
Tax reassessment forecast OK · Resets to sale price
- Current annual tax
- $505 · $42/mo
- Projected year-2 tax
- $1,152 · $96/mo
- Expected delta
- +$647/yr (+$54/mo · 128.1%)
ⓘ Screening estimate from a state-policy table — verify with the county assessor before closing.
Climate risk First Street
- Flood 1/10 Low FEMA zone X (unshaded) · 0% chance over 30 yrs
- Wildfire 2/10 Low
- Heat 6/10 Major 7 d/yr ≥110°F today · 18 d/yr by 30 yrs out
- Wind 2/10 Low 4% chance of damaging wind over 30 yrs
- Air quality 2/10 Low 2 unhealthy d/yr today · 2 by 30 yrs out
Nearby sold comps map
Loading sold comps map…
Walkable amenities ~0.75 mi
Loading nearby amenities…
Taxation est. · year 1
- Rental income
- $13,276
- − Mortgage interest
- −$7,170
- − Property taxes
- −$505
- − Insurance
- −$640
- − Repairs & maintenance
- −$1,062
- − Management
- −$1,062
- − Depreciation
- −$3,724
- Taxable loss
- −$887
- Est. tax savings @ 24.0%
- +$213
- After-tax cash flow
- $1,501/yr
For passive investors: Depreciation is non-cash, so a rental often shows a tax loss while cash-flowing — sheltering income. Rental losses are passive: they offset passive income freely, and up to $25,000/yr can offset ordinary (W-2) income if you actively participate and your MAGI is under $100k (phasing out to $0 by $150k); unused losses carry forward. On sale, claimed depreciation is recaptured at up to 25%, and gains may owe capital-gains tax (a 1031 exchange can defer both). Figures are a year-1 estimate at your 24.0% rate — not tax advice; consult a CPA.
Schools (NCES district)
- District
- Tulsa
- NCES district ID
- 4030240
- Math proficiency
- 7% ▼ -9.00%
- Reading proficiency
- 12% ▼ -7.00%
- Median HH income
- $37,895
- Composite
- 8.04/100
- National rank
- #9919
- State rank
- #250 of 270 in OK
Livability — Tulsa
- Score
- 75/100
- State rank
- #13
- US rank
- #4058
Category grades
Schools grade is shown separately in the Schools card above.
Census & demographics
- Census place
- Tulsa, OK
- County
- Tulsa County · 640,811 people
- City population
- 389,418
- Metro
- Tulsa, OK
- Population (ZIP)
- 15,244
- Household income
- $42,054
- Rent vs Own
- Severe rent burden
- 528.0
Population outlook (Tulsa County) Hauer SSP2
- Today (2025)
- 723,846 people
- By 2030
- 766,033 · +5.8%
- By 2040
- 851,386 · +17.6%
- By 2050
- 938,389 · +29.6%
- By 2075
- 1,166,011 · +61.1%
- By 2100
- 1,350,277 · +86.5%
Race, ethnicity, and origin ACS 2023
- Neighborhood character
- Highly diverse neighborhood (Simpson 0.72)
- Race & ethnicity
- Hispanic / Latino 40% White 24% Black 24% Two or more races 16% Native American 6%
- Hispanic origin (detail)
- Mexican 36%
- Common ancestry
- Slovak 1%
- Foreign-born
- 17% · Canada
- Languages at home
- 62% English-only · Spanish 37%
Political lean MEDSL · Tulsa
- 2024 margin
- R (+15.2) · D 41.3% · R 56.5% · Other 2.2%
- 2008→2024 swing
- +9.2pp toward D · 2008: -24.5pp · 2024: -15.2pp
- All cycles
- 2024: R+15.2 2020: R+15.6 2016: R+22.9 2012: R+27.4 2008: R+24.5
Not yet ingested
- Civics
- —
Market trends
- HPI YoY
- ▲ 8.69%
- Current HPI
- 277.6663
- Rent YoY
- ▲ 1.78%
- Metro
- Tulsa, OK
- State GDP YoY
- ▲ 1.55%
- F500 in state
- 6
Industry mix (Fortune 500 HQ in OK)
| Industry | F500 HQs | Revenue |
|---|---|---|
| Energy | 3 | $48B |
|
||
Price history
+1247.4% since first listed19 events — show timeline
- 2026-05-14 Pending — MLS Technology, Inc.
- 2026-04-15 Relisted — MLS Technology, Inc.
- 2026-04-07 Pending — MLS Technology, Inc.
- 2026-03-16 Price Changed $128,000 MLS Technology, Inc.
- 2026-03-11 Relisted — MLS Technology, Inc.
- 2026-02-23 Pending — MLS Technology, Inc.
- 2026-02-04 Listing Removed — MLS Technology, Inc.
- 2026-02-04 Listed $133,000 MLS Technology, Inc.
- 2026-01-28 Price Changed $133,000 MLS Technology, Inc.
- 2025-12-23 Relisted — MLS Technology, Inc.
- 2025-12-23 Price Changed $138,000 MLS Technology, Inc.
- 2025-11-21 Pending — MLS Technology, Inc.
- 2025-11-14 Price Changed $130,000 MLS Technology, Inc.
- 2025-09-24 Price Changed $135,000 MLS Technology, Inc.
- 2025-09-03 Price Changed $138,000 MLS Technology, Inc.
- 2025-08-12 Price Changed $148,000 MLS Technology, Inc.
- 2025-08-06 Listed $155,000 MLS Technology, Inc.
- 1997-08-01 Sold (Public Records) $19,000 Public Records
- 1991-04-03 Sold (Public Records) $9,500 Public Records
Property tax history
+1.4%/yrLatest (2025): $505 · +8.6% YoY. Source: county tax records.
Cash-flow waterfall
monthlySold comps — $/sqft
last 12 mo · ≤1 miLoading sold comps…