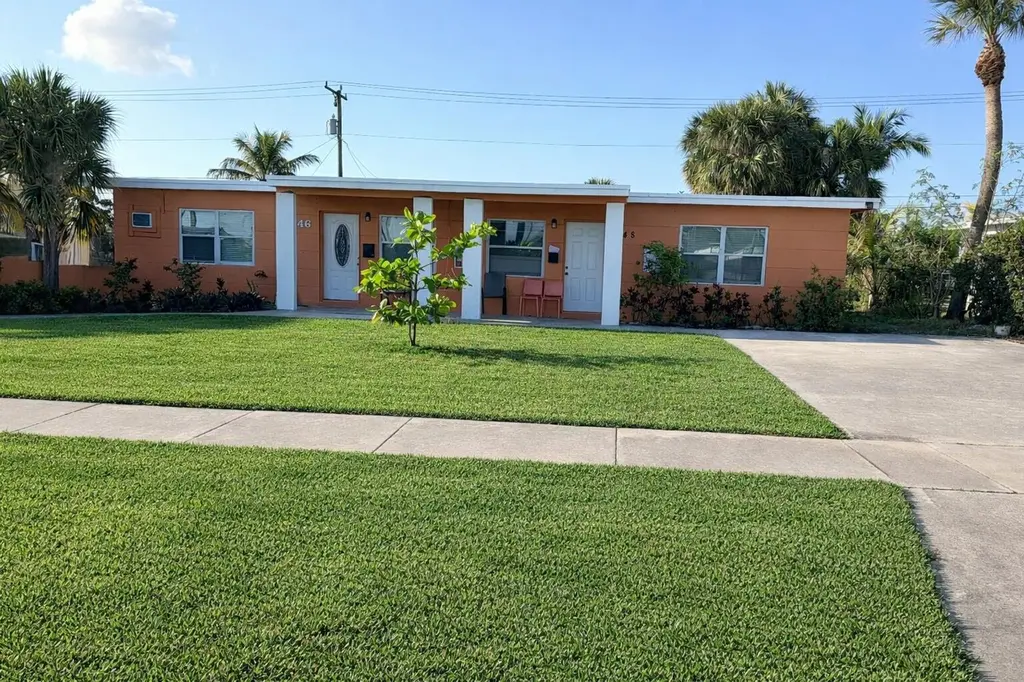
 Duplex
646 Bayberry Dr · Lake Park, FL
Flood risk 1/10 · Minimal
- FEMA flood zone
- X (unshaded)
- Chance of flooding over 30 yrs
- 0.0%
- Est. flood insurance / yr
- $507 – $1,088
Fire risk 1/10 · Minimal
- Est. fire insurance / yr
- $947 – $1,759
Heat risk 10/10 · Severe
- Hot days now (above 106°F)
- 7 days/yr
- Hot days in 30 yrs
- 24 days/yr
Wind risk 10/10 · Severe
- Chance of severe wind over 30 yrs
- 99.0%
Air-quality risk 2/10 · Minimal
- Unhealthy air days now
- 0 days/yr
- Unhealthy air days in 30 yrs
- 1 days/yr
Risk factors via First Street. Map © Google.
Why this score? — see what drove the C grade
The composite is a weighted blend of 9 inputs, each scored 0–100. Each bar is that input's sub-score; the figure is the points it added to the 100-point composite (weight × sub-score).
- Cash flow +23.2/30.0
- ARV discount +7.5/15.0
- DSCR +7.4/10.0
- 1% rule +6.1/10.0
- Schools +4.3/10.0
- Rent growth +4.0/5.0
- Livability +3.4/5.0
- Condition / age +2.5/5.0
- Appreciation +0.0/10.0
$430,000
🖨 Deal sheet 📄 Offer letter ✓ Due diligence
Multi-family units
County records classify this as Multi-Family (2-4 Unit). Listing-text estimate: 2 units. confirmed
Listing remarks
Well-maintained duplex featuring two spacious 2-bedroom, 1-bath units, each offering comfortable living and great functionality. The property boasts ample parking and a large backyard—perfect for outdoor enjoyment or added value potential. A brand-new roof (2026) provides peace of mind for years to come. One unit is currently tenant-occupied through January 2027, making this an excellent opportunity for investors seeking immediate rental income while maintaining flexibility for future use.
Key facts
- Brand new roof
- Ample parking
- Large backyard
Tags
Property features AI
Finance
- Financial info: Two total units; Tenants pay electricity and water; Pets allowed with no restrictions
Exterior
- Utilities: Public water; Public sewer; Cable available; Two separate electric meters; Two separate water meters
- Home design: Duplex; One-story; Resale property
- Construction: Stucco/CBS construction; Other roof type; Building area approximately 1,594 total; living area approximately 1,430; Built as a single-story structure
- Exterior features: Open patio and open porch
Interior
- Bedrooms: Duplex with two units (total 2 units)
- Flooring: Ceramic tile and tile
- Heating & cooling: Electric heating with separate meters; Ceiling fans; Wall/window air conditioning units
- Interior features: Satellite dish; Ceramic tile and tile flooring
Neighborhood map
What this means for you Summary
Snapshot
- This is a 2 × 2-bed/1.0-bath units multifamily listed at $430k.
Deal economics
- At list price, monthly cash flow is $776 ($9k/yr) — positive. Per door: $388/mo.
- The deal already cash-flows at list — no discount required.
- Meets the 1% rule at list price ($5k rent vs $430k).
- Recommended offer: $417k (3.0% below list) — sets the bar for market timing.
Location & tenants
- Location reads 67/100 on livability (#542 in FL) — a middle-class / working-renter tenant base. Strengths: housing A+, health & safety A+, cost of living A-; Watch: crime F, amenities F, commute F.
- Palm Beach (suburban): math 46% / reading 53% proficiency, ranked #34 of 73 in FL (top 47%) — families likely to look elsewhere, expect single-tenant / working-renter base with shorter leases.
- Zoned schools: Lake Park Elementary School (math 57% / reading 62%, grade B-, #690 of 2,144 statewide, top 34%, 389 students, 83% FRL); Howell L. Watkins Middle School (math 18% / reading 33%, grade F, #512 of 571 statewide, top 90%, 794 students, 76% FRL); Palm Beach Gardens High School (math 19% / reading 40%, grade F, #447 of 667 statewide, top 68%, 2,570 students, 61% FRL) — zoned schools average 74% FRL vs 52% district-wide (22 pts higher); higher-poverty schools than district average — tighter screening recommended.
- Market conditions: Rents rising fast (+6.0%/yr); 134 active listings in the ZIP; 34 comparable units currently listed for rent nearby; rentals at typical pace (median 24d on market — plan ~3-4 weeks tenant-placement turnaround); 3,974 units permitted in Palm Beach County in 2024 (1,012 in 5+ unit buildings).
- At $4,776/mo this rent would consume 81% of the median local household income ($71k/yr) (locally 903% of renters already pay >50% of income on rent) — very limited rent-growth headroom before tenants either downsize or default.
Forward outlook
- Local home prices are declining (-3.0%/yr); year-one equity from $3k of loan paydown is wiped out by about $13k of value loss. Plan a longer hold.
- Palm Beach County population projected at +30% by 2050 — long-run rental-demand tailwind backs the buy-and-hold thesis.
- At projected returns (-3.0% appreciation + 6.0% rent growth), your $120k cash investment doubles in ~9 years — after that, you're playing with house money.
Negotiation context
- It's been on market 59 days — a 3% lower offer ($417k) is reasonable based on typical stale-listing flexibility.
- 6 sale attempts since 19y ago with the ask held roughly flat each time — persistent listings suggest the price (not the market) is what's stuck; bring a comps-based counter.
- Current owner paid $330k; 30% above their basis — modest negotiation headroom, anchor on the comps not their cost.
Risks & watch-outs
- Watch-outs: built in 1958 — expect roof / HVAC / electrical / plumbing capex.
- Climate carrying-cost: severe wind risk, 99% chance of damaging wind over 30y; extreme-heat days projected 7→24/yr by 2055 (HVAC capex compounding) — expect insurance premiums to compound above CPI over the hold.
Questions for the listing agent
- It's been on market 59 days. Have you received any prior offers? Is the seller open to a 3% concession, seller financing, or rate buy-down credit?
- Can we see the unit-by-unit rent roll, current vacancy, and any below-market leases? What's the average tenancy length?
- What capital expenditures (roof, boiler, parking lot, exteriors) have been made in the last 5 years, and what's planned in the next 2?
- Built in 1958 — when were the roof, HVAC, electrical panel, plumbing, and water heater last replaced?
- Is there a deadline driving the sale (1031 exchange, divorce, estate, relocation)? That informs how much negotiation room exists.
- Schools are B-rated — typically a magnet for longer-tenancy family renters. What's the average tenant stay here, and is there a school-zone premium baked into asking?
- Crime grade is F in this area — have there been break-ins, vandalism, or insurance claims at this property in the last 3 years? What carrier currently insures it and at what premium?
- What's the average days-on-market for RENTAL listings here right now (not sales)? A rising rental-DOM trend means longer vacancies and softer asking-rent achievability than the comps imply.
- What's the recent tenant-quality profile in this submarket — average credit score on applications, eviction rate, late-payment / NSF rate, and stable-employment percentage? A property-management company in the area should have these aggregated.
- How much new apartment / multifamily construction is in the pipeline within 1–3 miles? Heavy new supply (>2% of stock underway) typically softens rents 12–24 months out; light construction supports rent growth.
Investment metrics
- 1% rule
- 1.11% ✓
- Cap rate
- 8.46%
- Cash-on-cash
- 7.73%
- DSCR
- 1.34
- GRM
- 7.5
CMA / ARV
No comps found within radius.
Projected returns pro-forma
-3.0% appreciation · 5.97% rent growth · sell at horizon
- IRR
- -1.2%
- Equity multiple
- 0.95×
- Total profit
- $-5,496
- Equity at exit
- $64,114
- IRR
- 11.5%
- Equity multiple
- 2.02×
- Total profit
- $123,280
- Equity at exit
- $37,179
Cash invested: $120,400 (down + closing). Projections, not guarantees.
Landlord ↔ Tenant lean methodology
- Overall (STATE)
- 87 Strongly Landlord-Friendly
- State Florida
- 87 Strongly Landlord-Friendly · R+3
- County
- — inherits STATE
- City
- — inherits STATE
ZIP-level market 33403
- Home prices YoY
- -19.6%
- Rents YoY
- 6.0%
- Active inventory
- 134
- Price-to-rent
- 15.0×
Monthly cashflow live
- Estimated rent
- $4,776 medium interval (Pro) →
- Mortgage (P&I)
- −$2,255
- Tax from tax record
- −$563 /mo · $6,760/yr
- Insurance
- −$179
- HOA
- −$0
- Vacancy / Maint / Mgmt
- −$1,003
- Net cashflow
- $776
Break-even live
2-unit breakdown (identical units grouped — click to expand)
| Units | Beds | Baths | Est. rent |
|---|---|---|---|
| 2× units | 2 | 1 | $4,776 |
| #1 | 2 | 1 | $2,388 |
| #2 | 2 | 1 | $2,388 |
| Total (2 units) | $4,776 | ||
UW: 25.0% down · 7.5% · 30yr · 1.5% tax · 5.0% vac · 8.0% maint · 8.0% mgmt
Financing live
Cash to close
- Down payment
- $107,500
- Closing costs
- $12,900
- Reserves months
- —
- Total cash needed
- —
Loan-product check · same deal, 3 products live
Conventional
25% down · 7.5% · 30yr
- Down + closing
- —
- Monthly P&I
- —
- Monthly cashflow
- —
- DSCR
- —
- Eligible?
- —
Personal DTI + credit; lowest rate.
DSCR
20% down · 8.5% · 30yr
- Down + closing
- —
- Monthly P&I
- —
- Monthly cashflow
- —
- DSCR
- —
- Eligible?
- —
No personal income docs; deal must DSCR.
Hard money
10% down · 12.0% · 12mo
- Down + closing
- —
- Monthly P&I
- —
- Monthly cashflow
- —
- DSCR
- —
- Eligible?
- —
Short-term bridge; refi at stabilization.
Rent comps 34 comps
| Address | Beds | Baths | Sqft | Rent | $/sqft | DOM | Units | Dist |
|---|---|---|---|---|---|---|---|---|
| 901 W 37th St Riviera Beach, FL | 3.0 | 1.0 | 900 | $2,895 | $3.22 | 24d | 1 | 0.20mi |
| 855 Date Palm Dr West Palm Beach, FL | 3.0 | 3.0 | 1216 | $3,150 | $2.59 | 24d | 1 | 0.32mi |
| 520 W 28th St Riviera Beach, FL | 3.0 | 1.0 | 1296 | $6,000 | $4.63 | 2d | 1 | 0.63mi |
| 301 Hawthorne Dr West Palm Beach, FL | 3.0 | 2.0 | 1402 | $3,200 | $2.28 | 24d | 1 | 0.64mi |
| 220 Lake Shore Dr Lake Park, FL | 1.0–3.0 | 1.5–3.5 | 1575 | $14,498 | $9.20 | 4d | 18 | 0.78mi |
| 301 Lake Shore Dr #802 West Palm Beach, FL | 2.0 | 2.0 | 1316 | $3,000 | $2.28 | 24d | 1 | 0.84mi |
| 913 Lake Shore Dr Lake Park, FL | 1.0–2.0 | 1.0–2.0 | 1066 | $3,731 | $3.50 | 2d | 9 | 0.91mi |
| 308 Southwind Ct Unit 8 North Palm Beach, FL | 2.0 | 2.0 | 1100 | $2,900 | $2.64 | 24d | 1 | 0.99mi |
| 1060 Lake Shore Dr #201 West Palm Beach, FL | 2.0 | 2.0 | 1206 | $3,850 | $3.19 | 18d | 1 | 1.06mi |
| 410 Wilma Cir #103 Riviera Beach, FL | 2.0 | 2.0 | 1056 | $4,000 | $3.79 | 14d | 1 | 1.08mi |
| 1155 Lake Shore Dr #202 West Palm Beach, FL | 2.0 | 2.0 | 1206 | $4,750 | $3.94 | 24d | 1 | 1.10mi |
| 620 Southwind Cir Unit A North Palm Beach, FL | 3.0 | 2.0 | 1697 | $4,200 | $2.47 | 24d | 1 | 1.14mi |
| 624 Southwind Cir Apt 4 North Palm Beach, FL | 3.0 | 2.0 | 1134 | $4,750 | $4.19 | 24d | 1 | 1.15mi |
| 624 Southwind Cir Unit 3 North Palm Beach, FL | 3.0 | 3.0 | 1316 | $5,500 | $4.18 | 24d | 1 | 1.15mi |
| 360 Wilma Cir #7 Riviera Beach, FL | 3.0 | 2.0 | 1590 | $4,500 | $2.83 | 24d | 1 | 1.20mi |
| 158 E 23rd St Riviera Beach, FL | 2.0 | 2.0 | 1110 | $2,900 | $2.61 | 21d | 1 | 1.20mi |
| 158 E 23rd St Riviera Beach, FL | 2.0 | 2.0 | 1110 | $2,900 | $2.61 | 24d | 1 | 1.20mi |
| 2650 Lake Shore Dr #804 Riviera Beach, FL | 3.0 | 3.5 | 1704 | $4,500 | $2.64 | 24d | 1 | 1.27mi |
| 2650 Lake Shore Dr #1203 Riviera Beach, FL | 3.0 | 3.0 | 1803 | $4,250 | $2.36 | 24d | 1 | 1.27mi |
| 2650 Lake Shore Dr #803 Riviera Beach, FL | 3.0 | 3.0 | 1800 | $5,000 | $2.78 | 24d | 1 | 1.27mi |
| 2650 Lake Shore Dr #1003 Riviera Beach, FL | 3.0 | 3.0 | 1788 | $4,200 | $2.35 | 24d | 1 | 1.27mi |
| 2650 Lake Shore Dr #1001 Riviera Beach, FL | 2.0 | 2.0 | 1742 | $3,800 | $2.18 | 24d | 1 | 1.27mi |
| 2650 Lake Shore Dr #2403 Riviera Beach, FL | 3.0 | 3.0 | 1788 | $6,000 | $3.36 | 24d | 1 | 1.27mi |
| 2650 Lake Shore Dr #2303 Riviera Beach, FL | 3.0 | 3.0 | 1537 | $4,950 | $3.22 | 24d | 1 | 1.27mi |
| 2640 Lake Shore Dr #1716 Riviera Beach, FL | 3.0 | 3.0 | 1538 | $9,500 | $6.18 | 24d | 1 | 1.27mi |
| 2640 Lake Shore Dr #711 Riviera Beach, FL | 3.0 | 3.0 | 1848 | $5,500 | $2.98 | 24d | 1 | 1.27mi |
| 2640 Lake Shore Dr #2312 Riviera Beach, FL | 2.0 | 2.0 | 1818 | $6,500 | $3.58 | 24d | 1 | 1.27mi |
| 2640 Lake Shore Dr Riviera Beach, FL | 3.0 | 3.0 | 1715 | $5,500 | $3.21 | 24d | 1 | 1.28mi |
| 549 Fairwind Dr North Palm Beach, FL | 3.0 | 2.0 | 1498 | $5,000 | $3.34 | 24d | 1 | 1.30mi |
| 2545 Conroy Dr West Palm Beach, FL | 3.0 | 2.0 | 1066 | $3,295 | $3.09 | 24d | 1 | 1.31mi |
| 522 Eastwind Dr North Palm Beach, FL | 2.0 | 2.0 | 948 | $3,995 | $4.21 | 24d | 1 | 1.32mi |
| 517 Gulf Rd North Palm Beach, FL | 3.0 | 2.0 | 1657 | $5,500 | $3.32 | 24d | 1 | 1.39mi |
| 1025 Sugar Sands Blvd #159 Riviera Beach, FL | 1.0 | 1.0 | 987 | $4,200 | $4.26 | 24d | 1 | 1.49mi |
| 1030 Sugar Sands Blvd #171 Riviera Beach, FL | 2.0 | 2.0 | 1143 | $5,000 | $4.37 | 24d | 1 | 1.49mi |
Listing history 17 events
-
2026-03-28$430,000 Active
-
2025-11-17$419,999 Active
-
2025-11-17historical
-
2025-11-16$419,999 Active
-
2023-06-01soldstatus $330,000
-
2013-08-16soldstatus $79,000
-
2013-08-08soldstatus $79,000 Closed
-
2013-06-22status Pending
-
2013-05-17status Pending
-
2013-05-03status Back On Market
-
2013-04-19status Pending
-
2013-03-04$79,500 Active
-
2008-12-05historical
-
2007-07-02soldstatus $205,000
-
2007-05-21$210,000
-
1993-07-07soldstatus $50,000
-
1982-06-01soldstatus $62,000
ⓘ Source: listings_history table (triggers on properties + properties_extension) + one-shot
backfill from property_details.listing_events for pre-trigger history.
Tax reassessment forecast FL · Resets to sale price
- Current annual tax
- $6,760 · $563/mo
- Projected year-2 tax
- $6,760 · $563/mo
- Expected delta
- $0/yr ($0/mo · 0.0%)
ⓘ Screening estimate from a state-policy table — verify with the county assessor before closing.
Climate risk First Street
- Flood 1/10 Low FEMA zone X (unshaded) · 0% chance over 30 yrs
- Wildfire 1/10 Low
- Heat 10/10 Extreme 7 d/yr ≥106°F today · 24 d/yr by 30 yrs out
- Wind 10/10 Extreme 99% chance of damaging wind over 30 yrs
- Air quality 2/10 Low 0 unhealthy d/yr today · 1 by 30 yrs out
Nearby sold comps map
Loading sold comps map…
Walkable amenities ~0.75 mi
Loading nearby amenities…
Taxation est. · year 1
- Rental income
- $57,312
- − Mortgage interest
- −$24,087
- − Property taxes
- −$6,760
- − Insurance
- −$2,150
- − Repairs & maintenance
- −$4,585
- − Management
- −$4,585
- − Depreciation
- −$12,509
- Taxable income
- $2,637
- Est. tax owed @ 24.0%
- −$633
- After-tax cash flow
- $8,674/yr
For passive investors: Depreciation is non-cash, so a rental often shows a tax loss while cash-flowing — sheltering income. Rental losses are passive: they offset passive income freely, and up to $25,000/yr can offset ordinary (W-2) income if you actively participate and your MAGI is under $100k (phasing out to $0 by $150k); unused losses carry forward. On sale, claimed depreciation is recaptured at up to 25%, and gains may owe capital-gains tax (a 1031 exchange can defer both). Figures are a year-1 estimate at your 24.0% rate — not tax advice; consult a CPA.
Schools (NCES district)
- District
- Palm Beach
- NCES district ID
- 1201500
- Math proficiency
- 46% ▼ -16.00%
- Reading proficiency
- 53% ▼ -4.00%
- Median HH income
- $53,943
- Composite
- 42.72/100
- National rank
- #3160
- State rank
- #34 of 73 in FL
Livability — Lake Park
- Score
- 67/100
- State rank
- #542
- US rank
- #10167
Category grades
Schools grade is shown separately in the Schools card above.
Census & demographics
- Census place
- Lake Park, FL
- County
- Palm Beach County · 1,438,312 people
- City population
- 14,370
- Metro
- Miami-Fort Lauderdale-Pompano Beach, FL
- Population (ZIP)
- 14,370
- Household income
- $70,646
- Rent vs Own
- Severe rent burden
- 903.0
Population outlook (Palm Beach County) Hauer SSP2
- Today (2025)
- 1,637,487 people
- By 2030
- 1,743,255 · +6.5%
- By 2040
- 1,948,712 · +19.0%
- By 2050
- 2,132,979 · +30.3%
- By 2075
- 2,530,027 · +54.5%
- By 2100
- 2,706,979 · +65.3%
Race, ethnicity, and origin ACS 2023
- Neighborhood character
- Diverse neighborhood (Simpson 0.67)
- Race & ethnicity
- Black 46% White 31% Hispanic / Latino 17% Two or more races 12% Asian 2%
- Hispanic origin (detail)
- Mexican 3% Puerto Rican 4% Cuban 5%
- Common ancestry
- Hispanic 15% Italian 2% Romanian 1%
- Foreign-born
- 26% · Canada, China, Jamaica
- Languages at home
- 69% English-only · French/Haitian/Cajun 17% Spanish 12% Chinese 1%
Political lean MEDSL · Palm Beach
- 2024 margin
- Toss-up / Even · D 50.0% · R 49.2%
- 2008→2024 swing
- -22.1pp toward R · 2008: 22.9pp · 2024: 0.8pp
- All cycles
- 2024: D+0.8 2020: D+12.8 2016: D+15.3 2012: D+17.0 2008: D+22.9
Not yet ingested
- Civics
- —
Market trends
- HPI YoY
- ▼ -112.30%
- Current HPI
- 461.4045
- Rent YoY
- ▲ 5.97%
- Metro
- Miami-Fort Lauderdale-Pompano Beach, FL
- State GDP YoY
- ▲ 3.28%
- F500 in state
- 36
Industry mix (Fortune 500 HQ in FL)
| Industry | F500 HQs | Revenue |
|---|---|---|
| Industrial Technology | 2 | $29B |
|
||
| Insurance | 2 | $17B |
|
||
| Retail | 1 | $60B |
|
||
| Technology Distribution | 1 | $58B |
|
||
| Homebuilding | 1 | $35B |
|
||
| Technology Manufacturing | 1 | $35B |
|
||
Price history
+593.5% since first listed17 events — show timeline
- 2026-03-28 Listed $430,000 Beaches MLS
- 2025-11-17 Listing Removed — Stellar MLS as Distributed by MLS Grid
- 2025-11-17 Listed $419,999 Stellar MLS as Distributed by MLS Grid
- 2025-11-16 Listed $419,999 Stellar MLS as Distributed by MLS Grid
- 2023-06-01 Sold (Public Records) $330,000 Public Records
- 2013-08-16 Sold (Public Records) $79,000 Public Records
- 2013-08-08 Sold (MLS) $79,000 Beaches MLS
- 2013-06-22 Pending — Beaches MLS
- 2013-05-17 Pending — Beaches MLS
- 2013-05-03 Relisted — Beaches MLS
- 2013-04-19 Pending — Beaches MLS
- 2013-03-04 Listed $79,500 Beaches MLS
- 2008-12-05 Listing Removed — Beaches MLS
- 2007-07-02 Sold (Public Records) $205,000 Public Records
- 2007-05-21 Listed $210,000 Beaches MLS
- 1993-07-07 Sold (Public Records) $50,000 Public Records
- 1982-06-01 Sold (Public Records) $62,000 Public Records
Property tax history
+6.6%/yrLatest (2025): $6,760 · +4.1% YoY. Source: county tax records.
Cash-flow waterfall
monthlySold comps — $/sqft
last 12 mo · ≤1 miLoading sold comps…