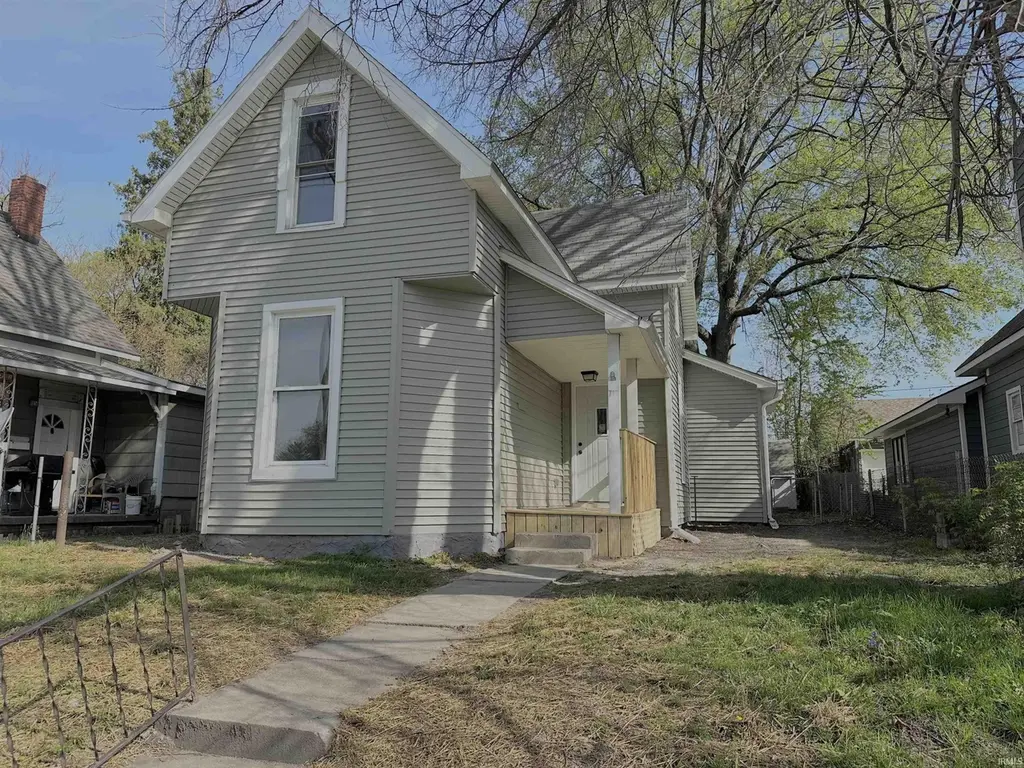
710 E Superior St · Kokomo, IN
Flood risk 1/10 · Minimal
- FEMA flood zone
- X (unshaded)
- Chance of flooding over 30 yrs
- 0.0%
- Est. flood insurance / yr
- $507 – $1,088
Fire risk 1/10 · Minimal
- Est. fire insurance / yr
- $717 – $1,331
Heat risk 3/10 · Minor
- Hot days now (above 101°F)
- 7 days/yr
- Hot days in 30 yrs
- 17 days/yr
Wind risk 2/10 · Minimal
- Chance of severe wind over 30 yrs
- —
Air-quality risk 3/10 · Minor
- Unhealthy air days now
- 2 days/yr
- Unhealthy air days in 30 yrs
- 3 days/yr
Risk factors via First Street. Map © Google.
Why this score? — see what drove the F grade
The composite is a weighted blend of 9 inputs, each scored 0–100. Each bar is that input's sub-score; the figure is the points it added to the 100-point composite (weight × sub-score).
- Cash flow +16.1/30.0
- DSCR +5.0/10.0
- 1% rule +3.4/10.0
- Livability +3.4/5.0
- Condition / age +2.5/5.0
- Rent growth +2.1/5.0
- Schools +2.1/10.0
- ARV discount +0.0/15.0
- Appreciation +0.0/10.0
$161,000
🖨 Deal sheet 📄 Offer letter ✓ Due diligence
Listing remarks MLS
Great opportunity for investors or experienced renovators looking for a project. Home is being sold as-is.
Key facts
- 5,663 sq ft lot
- Built 1891
- Listed 62 days
Property features AI
Exterior
- Utilities: Public water; Public sewer
- Home design: Single-family residence; Site-built home; One story
- Construction: Vinyl siding; Slab foundation
- Exterior features: Shed(s); Lot dimensions roughly 43 x 140
Interior
- Kitchen: Dishwasher; Microwave
- Bathrooms: 2 full bathrooms
- Heating & cooling: Central air conditioning; Natural gas forced air heating
- Interior features: Dishwasher; Microwave; Crawl space basement
- Laundry & utility: Main level laundry
Neighborhood map
What this means for you Summary
Snapshot
- This is a 3-bed/1.0-bath single-family listed at $161k.
Deal economics
- At list price, monthly cash flow is $83 ($990/yr) — positive.
- The deal already cash-flows at list — no discount required.
- To meet the 1% rule (rent ≥ 1% of price), the offer needs to be $135k (16.3% below list).
- Recommended offer: $135k (16.3% below list) — sets the bar for 1% rule.
- Cap rate 6.9% vs local median 5.2% in Kokomo — top-decile yield for the area; either an underpriced asset or a hidden risk that comps aren't pricing in. Stress-test before assuming the spread holds.
Location & tenants
- Location reads 68/100 on livability (#227 in IN) — a middle-class / working-renter tenant base. Strengths: cost of living A+, housing A+, health & safety A; Watch: crime D, amenities F, commute F.
- Kokomo School Corporation (urban): math 22% / reading 30% proficiency, ranked #264 of 301 in IN (top 88%) — low school quality limits family demand, transient renter base, plan for 1-2y turnover; 62% free/reduced lunch — lower-income household profile, screen leases tightly.
- Zoned schools: Elwood Haynes Elementary School (math 22% / reading 17%, grade F, #814 of 994 statewide, top 83%, 611 students, 88% FRL); Central Middle School (math 23% / reading 38%, grade F, #203 of 330 statewide, top 63%, 458 students, 57% FRL); Kokomo High School (math 19% / reading 48%, grade F, #289 of 369 statewide, top 78%, 1,519 students, 58% FRL).
- Market conditions: Rents soft (-1.5%/yr); 242 active listings in the ZIP; 194 units permitted in Howard County in 2024 (0 in 5+ unit buildings).
Forward outlook
- Local home prices are declining (-3.0%/yr); year-one equity from $1k of loan paydown is wiped out by about $5k of value loss. Plan a longer hold.
- Howard County population projected at -11% by 2050 — secular population decline; favor cash flow + early exit over multi-decade hold.
Negotiation context
- It's been on market 63 days — a 6% lower offer ($151k) is reasonable based on typical stale-listing flexibility.
- 3 sale attempts since 4y ago with the ask held roughly flat each time — persistent listings suggest the price (not the market) is what's stuck; bring a comps-based counter.
- Current owner paid $35k; list at $161k implies a 360% gain — meaningful room to come down on a strong offer.
Risks & watch-outs
- Watch-outs: built in 1891 — expect roof / HVAC / electrical / plumbing capex.
Questions for the listing agent
- It's been on market 63 days. Have you received any prior offers? Is the seller open to a 16% concession, seller financing, or rate buy-down credit?
- Built in 1891 — when were the roof, HVAC, electrical panel, plumbing, and water heater last replaced?
- Why hasn't it sold? Are there any deal-killer items the seller is aware of (foundation, flood, title, zoning, code violations)?
- Is there a deadline driving the sale (1031 exchange, divorce, estate, relocation)? That informs how much negotiation room exists.
- Schools are F-rated, which usually means shorter tenancies and higher turnover. Who's the typical renter profile here, and what's been the actual vacancy rate?
- Crime grade is D in this area — have there been break-ins, vandalism, or insurance claims at this property in the last 3 years? What carrier currently insures it and at what premium?
- The area grade is low — what's the realistic commute time and amenity access for the typical tenant pool here? Any planned neighborhood developments (good or bad) we should know about?
- What's the average days-on-market for RENTAL listings here right now (not sales)? A rising rental-DOM trend means longer vacancies and softer asking-rent achievability than the comps imply.
- What's the recent tenant-quality profile in this submarket — average credit score on applications, eviction rate, late-payment / NSF rate, and stable-employment percentage? A property-management company in the area should have these aggregated.
- How much new for-sale + rental construction is in the pipeline within 1–3 miles? Heavy new supply typically softens prices + rents 12–24 months out; constrained supply supports both.
Investment metrics
- 1% rule
- 0.84% ✗
- Cap rate
- 6.91%
- Cash-on-cash
- 2.20%
- DSCR
- 1.10
- GRM
- 10.0
CMA / ARV
- ARV (on-the-fly)
- $129,504
- Comps found
- 12
Show comp detail 12 sales within ~0.75 mi
| Address | Dist | Beds/Ba | Sqft | Sold | Price | $/sf | Match |
|---|---|---|---|---|---|---|---|
| 932 E Mulberry St | 0.26mi | 3/2.0 | 1,728 (+1%) | 1mo | $42,000 | $24 | 81 |
| 910 E Jefferson St | 0.39mi | 2/1.0 (-1) | 1,697 (-0%) | 0mo | $19,000 | $11 | 76 |
| 739 S Jay St | 0.48mi | 3/1.5 | 1,708 (+0%) | 0mo | $67,000 | $39 | 75 |
| 804 E Sycamore St | 0.09mi | 3/1.5 | 1,516 (-11%) | 1mo | $203,000 | $134 | 75 |
| 700 S Locke St | 0.46mi | 3/2.0 | 1,680 (-1%) | 3mo | $87,000 | $52 | 69 |
| 514 S Webster St | 0.71mi | 3/1.5 | 1,792 (+5%) | 2mo | $165,000 | $92 | 55 |
| 910 S Apperson Way | 0.61mi | 4/2.0 (+1) | 1,700 (-0%) | 9mo | $129,900 | $76 | 55 |
| 1012 E Taylor St | 0.34mi | 3/1.0 | 1,932 (+13%) | 8mo | $68,000 | $35 | 55 |
| 225 E Vaile Ave | 0.40mi | 3/2.0 | 1,948 (+14%) | 1mo | $170,000 | $87 | 52 |
| 921 E Elm St | 0.69mi | 3/1.0 | 1,536 (-10%) | 3mo | $18,500 | $12 | 49 |
| 429 S Armstong St | 0.65mi | 3/2.0 | 1,576 (-8%) | 8mo | $149,900 | $95 | 47 |
| 721 E Markland Ave | 0.65mi | 2/2.0 (-1) | 1,504 (-12%) | 5mo | $140,000 | $93 | 37 |
Match score weights: distance 35% · size 25% · config 20% · recency 20%. Top-matched comps best support the ARV.
Projected returns pro-forma
-3.0% appreciation · 0.0% rent growth · sell at horizon
- IRR
- -15.9%
- Equity multiple
- 0.45×
- Total profit
- $-24,843
- Equity at exit
- $24,006
- IRR
- -13.1%
- Equity multiple
- 0.33×
- Total profit
- $-30,372
- Equity at exit
- $13,920
Cash invested: $45,080 (down + closing). Projections, not guarantees.
Landlord ↔ Tenant lean methodology
- Overall (STATE)
- 90 Strongly Landlord-Friendly
- State Indiana
- 90 Strongly Landlord-Friendly · R+11
- County
- — inherits STATE
- City
- — inherits STATE
ZIP-level market 46901
- Home prices YoY
- -24.4%
- Rents YoY
- -1.5%
- Active inventory
- 242
- Price-to-rent
- 10.0×
Monthly cashflow live
- Estimated rent
- $1,348 medium interval (Pro) →
- Mortgage (P&I)
- −$844
- Tax from tax record
- −$71 /mo · $848/yr
- Insurance
- −$67
- HOA
- −$0
- Vacancy / Maint / Mgmt
- −$283
- Net cashflow
- $83
Break-even live
UW: 25.0% down · 7.5% · 30yr · 1.5% tax · 5.0% vac · 8.0% maint · 8.0% mgmt
Financing live
Cash to close
- Down payment
- $40,250
- Closing costs
- $4,830
- Reserves months
- —
- Total cash needed
- —
Loan-product check · same deal, 3 products live
Conventional
25% down · 7.5% · 30yr
- Down + closing
- —
- Monthly P&I
- —
- Monthly cashflow
- —
- DSCR
- —
- Eligible?
- —
Personal DTI + credit; lowest rate.
DSCR
20% down · 8.5% · 30yr
- Down + closing
- —
- Monthly P&I
- —
- Monthly cashflow
- —
- DSCR
- —
- Eligible?
- —
No personal income docs; deal must DSCR.
Hard money
10% down · 12.0% · 12mo
- Down + closing
- —
- Monthly P&I
- —
- Monthly cashflow
- —
- DSCR
- —
- Eligible?
- —
Short-term bridge; refi at stabilization.
Listing history 20 events
-
2026-06-19days on market $161,000 Active 63 DOM
-
2026-06-18days on market $161,000 Active 62 DOM
-
2026-06-17days on market $161,000 Active 61 DOM
-
2026-06-16days on market $161,000 Active 60 DOM
-
2026-06-15days on market $161,000 Active 59 DOM
-
2026-06-14days on market $161,000 Active 57 DOM
-
2026-06-13pricedays on market $161,000 Active 56 DOM
-
2026-06-10days on market $164,000 Active 54 DOM
-
2026-06-09days on market $164,000 Active 53 DOM
-
2026-06-08days on market $164,000 Active 52 DOM
-
2026-06-07days on market $164,000 Active 51 DOM
-
2026-06-02days on market $164,000 Active 46 DOM
-
2026-06-01days on market $164,000 Active 45 DOM
-
2026-05-31days on market $164,000 Active 44 DOM
-
2026-05-30days on market $164,000 Active 43 DOM
-
2026-04-15$164,000 Active
-
2025-07-21soldstatus $35,000 Closed 106-char remark
Show marketing remark (106 chars)
Great opportunity for investors or experienced renovators looking for a project. Home is being sold as-is.
-
2025-07-12status Pending 106-char remark
Show marketing remark (106 chars)
Great opportunity for investors or experienced renovators looking for a project. Home is being sold as-is.
-
2025-07-11$35,000 Active 106-char remark
Show marketing remark (106 chars)
Great opportunity for investors or experienced renovators looking for a project. Home is being sold as-is.
-
2022-03-23$49,900 Active
ⓘ Source: listings_history table (triggers on properties + properties_extension) + one-shot
backfill from property_details.listing_events for pre-trigger history.
Tax reassessment forecast IN · Partial reset (capped growth)
- Current annual tax
- $848 · $71/mo
- Projected year-2 tax
- $1,108 · $92/mo
- Expected delta
- +$260/yr (+$22/mo · 30.7%)
ⓘ Screening estimate from a state-policy table — verify with the county assessor before closing.
Climate risk First Street
- Flood 1/10 Low FEMA zone X (unshaded) · 0% chance over 30 yrs
- Wildfire 1/10 Low
- Heat 3/10 Moderate 7 d/yr ≥101°F today · 17 d/yr by 30 yrs out
- Wind 2/10 Low
- Air quality 3/10 Moderate 2 unhealthy d/yr today · 3 by 30 yrs out
Nearby sold comps map
Loading sold comps map…
Walkable amenities ~0.75 mi
Loading nearby amenities…
Taxation est. · year 1
- Rental income
- $16,170
- − Mortgage interest
- −$9,019
- − Property taxes
- −$848
- − Insurance
- −$805
- − Repairs & maintenance
- −$1,294
- − Management
- −$1,294
- − Depreciation
- −$4,684
- Taxable loss
- −$1,772
- Est. tax savings @ 24.0%
- +$425
- After-tax cash flow
- $1,415/yr
For passive investors: Depreciation is non-cash, so a rental often shows a tax loss while cash-flowing — sheltering income. Rental losses are passive: they offset passive income freely, and up to $25,000/yr can offset ordinary (W-2) income if you actively participate and your MAGI is under $100k (phasing out to $0 by $150k); unused losses carry forward. On sale, claimed depreciation is recaptured at up to 25%, and gains may owe capital-gains tax (a 1031 exchange can defer both). Figures are a year-1 estimate at your 24.0% rate — not tax advice; consult a CPA.
Schools (NCES district)
- District
- Kokomo School Corporation
- NCES district ID
- 1805370
- Math proficiency
- 22% ▼ -8.00%
- Reading proficiency
- 30% ▼ -5.00%
- Median HH income
- $35,804
- Composite
- 21.5/100
- National rank
- #8325
- State rank
- #264 of 301 in IN
Livability — Kokomo
- Score
- 68/100
- State rank
- #227
- US rank
- #9912
Category grades
Schools grade is shown separately in the Schools card above.
Census & demographics
- Census place
- Kokomo, IN
- County
- Howard County · 75,099 people
- City population
- 75,099
- Metro
- Kokomo, IN
- Population (ZIP)
- 38,082
- Household income
- $60,495
- Rent vs Own
- Severe rent burden
- 1116.0
Population outlook (Howard County) Hauer SSP2
- Today (2025)
- 81,522 people
- By 2030
- 80,104 · -1.7%
- By 2040
- 76,708 · -5.9%
- By 2050
- 72,880 · -10.6%
- By 2075
- 64,016 · -21.5%
- By 2100
- 51,705 · -36.6%
Race, ethnicity, and origin ACS 2023
- Neighborhood character
- Predominantly White (83%)
- Race & ethnicity
- White 83% Black 9% Two or more races 5% Hispanic / Latino 4%
- Common ancestry
- Italian 2% Romanian 2% Slovak 1%
- Foreign-born
- 1% · Canada
- Languages at home
- 96% English-only · German/W. Germanic 1% Spanish 1%
Political lean MEDSL · Howard
- 2024 margin
- Solid R (+35.3) · D 31.4% · R 66.7% · Other 1.8%
- 2008→2024 swing
- -29.1pp toward R · 2008: -6.2pp · 2024: -35.3pp
- All cycles
- 2024: R+35.3 2020: R+32.4 2016: R+33.9 2012: R+14.3 2008: R+6.2
Not yet ingested
- Civics
- —
Market trends
- HPI YoY
- ▼ -78.40%
- Current HPI
- 242.2565
- Rent YoY
- ▼ -1.47%
- Metro
- Kokomo, IN
- State GDP YoY
- ▲ 2.90%
- F500 in state
- 18
Industry mix (Fortune 500 HQ in IN)
| Industry | F500 HQs | Revenue |
|---|---|---|
| Industrial Machinery | 2 | $37B |
|
||
| Healthcare | 1 | $177B |
|
||
| Pharmaceuticals | 1 | $45B |
|
||
| Metals / Steel | 1 | $18B |
|
||
| Agriculture | 1 | $17B |
|
||
| Packaging | 1 | $12B |
|
||
Price history
+228.7% since first listed5 events — show timeline
- 2026-04-15 Listed $164,000 IRMLS
- 2025-07-21 Sold (MLS) $35,000 IRMLS
- 2025-07-12 Pending — IRMLS
- 2025-07-11 Listed $35,000 IRMLS
- 2022-03-23 Listed $49,900 IRMLS
Property tax history
+4.1%/yrLatest (2024): $848 · +18.1% YoY. Source: county tax records.
Cash-flow waterfall
monthlySold comps — $/sqft
last 12 mo · ≤1 miLoading sold comps…