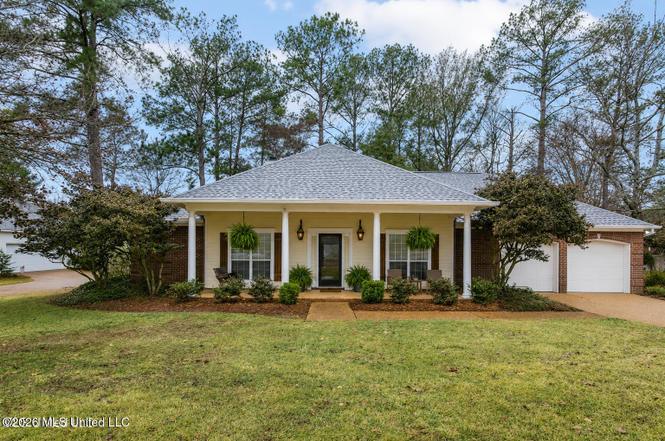
312 Hillchase Dr · Madison, MS
Flood risk 1/10 · Minimal
- FEMA flood zone
- X (unshaded)
- Chance of flooding over 30 yrs
- 0.0%
- Est. flood insurance / yr
- $507 – $1,088
Fire risk 3/10 · Minor
- Est. fire insurance / yr
- $1,241 – $2,305
Heat risk 7/10 · Major
- Hot days now (above 108°F)
- 7 days/yr
- Hot days in 30 yrs
- 20 days/yr
Wind risk 8/10 · Major
- Chance of severe wind over 30 yrs
- 80.0%
Air-quality risk 2/10 · Minimal
- Unhealthy air days now
- 0 days/yr
- Unhealthy air days in 30 yrs
- 1 days/yr
Risk factors via First Street. Map © Google.
Why this score? — see what drove the B- grade
The composite is a weighted blend of 9 inputs, each scored 0–100. Each bar is that input's sub-score; the figure is the points it added to the 100-point composite (weight × sub-score).
- Cash flow +29.2/30.0
- DSCR +10.0/10.0
- 1% rule +7.2/10.0
- ARV discount +5.5/15.0
- Schools +4.8/10.0
- Livability +4.0/5.0
- Rent growth +3.2/5.0
- Condition / age +2.5/5.0
- Appreciation +0.0/10.0
$365,000
🖨 Deal sheet 📄 Offer letter ✓ Due diligence
Listing remarks MLS
Updated amazing 4 bedroom home in incredible Northbay! Large Foyer opens into warm and open living area which overlooks the backyard and water garden/koi pond. Surround sound speakers in living area and fireplace wired for TV. Also has outdoor speakers. Unique updates include wet bar with Verde butterfly granite, copper sink, custom cabinetry, and one of a kind glass backsplash. Large kitchen with eat-in breakfast area boasts stainless appliances, tons of granite counter space, under mount sink, unique and strategic lighting including under cabinet lights, an abundance of cabinets, and built in hutch/serving area. Master suite is oversized with two large granite vanities, under mount sinks, custom lighting, faucets, mirrors, a "to-die for" Jacuzzi brand tub and newly tiled spa shower. Second bathroom is warmly appointed with custom mirror, custom lighting, granite counter tops, two copper sinks and newly tiled shower. Large dining room is decorated with custom window treatments and wainscoting. In-ground sprinkler system. Gated community. This home is just 3 short blocks - easy walk- from the water, pool, boat launch, tennis courts, and parks. Swimming, boating, walking trails, fishing, tennis, beautiful parks and elegant homes - this is Northbay of Madison, Mississippi. No other residential community in the entire Jackson metropolitan area offers such a complete range of amenities. Call your Realtor today to visit beautiful Northbay and tour this Unique home. Vacation Living At Home!
Key facts
- Downdraft gas range
- Built-in ovens
- Gas-log fireplace
Tags
Property features AI
Finance
- HOA & community: Community association (dues cover grounds maintenance, management, and pool service); Community amenities include pool, tennis courts, playground, biking and hiking/walking trails, RV/boat parking and storage
Exterior
- Parking: 2-car garage with garage door opener
- Utilities: Public water; Public sewer; Electricity connected; Natural gas connected; Cable available
- Home design: Single family residence (house); One level; Move-in ready
- Construction: Brick construction; Asphalt shingle roof; Slab foundation; Built (year from public records)
- Exterior features: Private yard; Patio; Exterior lighting; Rain gutters
Interior
- Kitchen: Convection oven; Cooktop; Dishwasher; Garbage disposal; Exhaust fan
- Bedrooms: Bedrooms with walk-in closets
- Flooring: Carpet; Ceramic tile; Wood
- Bathrooms: 2 full bathrooms
- Heating & cooling: Central heating (natural gas); Fireplace heating; Central air conditioning; Ceiling fans
- Interior features: Ceiling fans; Double vanity in bathroom; Entrance foyer; High ceilings; Sound system; Storage space; Walk-in closets; Wet bar; Living room fireplace
- Laundry & utility: Laundry located in common area; Gas water heater
Neighborhood map
What this means for you Summary
Snapshot
- This is a 4-bed/4.0-bath single-family listed at $365k.
Deal economics
- At list price, monthly cash flow is $1k ($15k/yr) — positive.
- The deal already cash-flows at list — no discount required.
- Meets the 1% rule at list price ($4k rent vs $365k).
- Cap rate 10.5% vs local median 3.7% in Madison — top-decile yield for the area; either an underpriced asset or a hidden risk that comps aren't pricing in. Stress-test before assuming the spread holds.
Location & tenants
- Location reads 81/100 on livability (#4 in MS, #1,556 nationally) — a professional / high-income tenant draw. Strengths: crime A+, employment A+, housing A+; Watch: amenities D-, commute F.
- Madison County School District (rural): math 54% / reading 54% proficiency, ranked #3 of 130 in MS (top 2%) — acceptable for families but not a draw, mixed tenant base, ~2y average lease.
- Zoned schools: Madison Avenue Lower Elementary (437 students, 99% FRL); Madison Central High School (math 5% / reading 63%, grade F, #78 of 197 statewide, top 39%, 1,246 students, 100% FRL) — zoned schools average 100% FRL vs 29% district-wide (70 pts higher); higher-poverty schools than district average — tighter screening recommended.
- Zoned-school proficiency averages 34% at this address vs 54% district-wide (-20 pts) — the specific schools serving this property underperform the Madison County School District average; the district grade overstates school quality for this exact location.
- Market conditions: Rents rising (+2.6%/yr); 628 active listings in the ZIP; 2 comparable units currently listed for rent nearby; high-income renter base; 553 units permitted in Madison County in 2024 (0 in 5+ unit buildings).
- This rent runs 43% of the median local income ($126k/yr) — at the standard rent-burdened threshold; future hikes will face affordability resistance.
Forward outlook
- Local home prices are declining (-3.0%/yr); year-one equity from $3k of loan paydown is wiped out by about $11k of value loss. Plan a longer hold.
- Madison County population projected at +34% by 2050 — long-run rental-demand tailwind backs the buy-and-hold thesis.
- At projected returns (-3.0% appreciation + 2.6% rent growth), your $102k cash investment doubles in ~9 years — after that, you're playing with house money.
Negotiation context
- Only 4 days on market — expect competitive offers; lowballing is unlikely to land.
- 7 sale attempts since 21y ago with the ask held roughly flat each time — persistent listings suggest the price (not the market) is what's stuck; bring a comps-based counter.
Risks & watch-outs
- Climate carrying-cost: severe wind risk, 80% chance of damaging wind over 30y; extreme-heat days projected 7→20/yr by 2055 (HVAC capex compounding) — expect insurance premiums to compound above CPI over the hold.
Questions for the listing agent
- Is there a deadline driving the sale (1031 exchange, divorce, estate, relocation)? That informs how much negotiation room exists.
- Schools are A-rated — typically a magnet for longer-tenancy family renters. What's the average tenant stay here, and is there a school-zone premium baked into asking?
- What's the average days-on-market for RENTAL listings here right now (not sales)? A rising rental-DOM trend means longer vacancies and softer asking-rent achievability than the comps imply.
- What's the recent tenant-quality profile in this submarket — average credit score on applications, eviction rate, late-payment / NSF rate, and stable-employment percentage? A property-management company in the area should have these aggregated.
- How much new for-sale + rental construction is in the pipeline within 1–3 miles? Heavy new supply typically softens prices + rents 12–24 months out; constrained supply supports both.
Investment metrics
- 1% rule
- 1.22% ✓
- Cap rate
- 10.49%
- Cash-on-cash
- 14.98%
- DSCR
- 1.67
- GRM
- 6.8
CMA / ARV
- ARV (on-the-fly)
- $349,338
- Comps found
- 12
Show comp detail 12 sales within ~0.75 mi
| Address | Dist | Beds/Ba | Sqft | Sold | Price | $/sf | Match |
|---|---|---|---|---|---|---|---|
| 217 Bayview Dr | 0.17mi | 4/3.0 | 2,153 (-3%) | 1mo | $379,900 | $176 | 83 |
| 20 Moss Woods Cv | 0.29mi | 4/3.0 | 2,141 (-3%) | 5mo | $335,000 | $156 | 73 |
| 279 Bayview Dr | 0.22mi | 3/2.5 (-1) | 2,254 (+2%) | 6mo | $374,500 | $166 | 70 |
| 69 Moss Woods Dr | 0.36mi | 4/3.0 | 2,351 (+6%) | 0mo | $369,900 | $157 | 68 |
| 208 Windrose Dr | 0.31mi | 4/2.5 | 2,228 (+1%) | 15mo | $350,000 | $157 | 66 |
| 239 Northbay Dr | 0.27mi | 4/3.0 | 2,144 (-3%) | 15mo | $339,000 | $158 | 66 |
| 77 Moss Woods Dr | 0.40mi | 4/3.5 | 2,393 (+8%) | 1mo | $365,000 | $153 | 65 |
| 54 Moss Woods Dr | 0.28mi | 3/2.0 (-1) | 2,139 (-3%) | 8mo | $354,900 | $166 | 62 |
| 93 Napa Valley Cir | 0.40mi | 4/2.5 | 2,409 (+9%) | 1mo | $359,900 | $149 | 60 |
| 57 Napa Valley Cir | 0.58mi | 4/2.0 | 2,224 (+1%) | 9mo | $389,000 | $175 | 57 |
| 718 Woodgate Dr | 0.19mi | 4/3.5 | 2,529 (+14%) | 15mo | $420,000 | $166 | 52 |
| 213 Kiowa Dr | 0.51mi | 4/2.0 | 2,352 (+6%) | 8mo | $280,000 | $119 | 51 |
Match score weights: distance 35% · size 25% · config 20% · recency 20%. Top-matched comps best support the ARV.
Projected returns pro-forma
-3.0% appreciation · 2.61% rent growth · sell at horizon
- IRR
- 5.1%
- Equity multiple
- 1.20×
- Total profit
- $20,276
- Equity at exit
- $54,423
- IRR
- 14.2%
- Equity multiple
- 2.12×
- Total profit
- $114,792
- Equity at exit
- $31,559
Cash invested: $102,200 (down + closing). Projections, not guarantees.
Landlord ↔ Tenant lean methodology
- Overall (STATE)
- 90 Strongly Landlord-Friendly
- State Mississippi
- 90 Strongly Landlord-Friendly · R+11
- County
- — inherits STATE
- City
- — inherits STATE
ZIP-level market 39110
- Home prices YoY
- -28.3%
- Rents YoY
- 2.6%
- Active inventory
- 628
- Price-to-rent
- 6.8×
Monthly cashflow live
- Estimated rent
- $4,469 medium interval (Pro) →
- Mortgage (P&I)
- −$1,914
- Tax from tax record
- −$188 /mo · $2,258/yr
- Insurance
- −$152
- HOA
- −$0
- Vacancy / Maint / Mgmt
- −$938
- Net cashflow
- $1,276
Break-even live
UW: 25.0% down · 7.5% · 30yr · 1.5% tax · 5.0% vac · 8.0% maint · 8.0% mgmt
Financing live
Cash to close
- Down payment
- $91,250
- Closing costs
- $10,950
- Reserves months
- —
- Total cash needed
- —
Loan-product check · same deal, 3 products live
Conventional
25% down · 7.5% · 30yr
- Down + closing
- —
- Monthly P&I
- —
- Monthly cashflow
- —
- DSCR
- —
- Eligible?
- —
Personal DTI + credit; lowest rate.
DSCR
20% down · 8.5% · 30yr
- Down + closing
- —
- Monthly P&I
- —
- Monthly cashflow
- —
- DSCR
- —
- Eligible?
- —
No personal income docs; deal must DSCR.
Hard money
10% down · 12.0% · 12mo
- Down + closing
- —
- Monthly P&I
- —
- Monthly cashflow
- —
- DSCR
- —
- Eligible?
- —
Short-term bridge; refi at stabilization.
Rent comps 2 comps
| Address | Beds | Baths | Sqft | Rent | $/sqft | DOM | Units | Dist |
|---|---|---|---|---|---|---|---|---|
| 145 Republic St Madison, MS | 3.0 | 3.0 | 2800 | $8,000 | $2.86 | 44d | 1 | 1.38mi |
| 143 Sonnett Cir Madison, MS | 4.0 | 3.0 | 2564 | $3,250 | $1.27 | 23d | 1 | 1.46mi |
Listing history 5 events
-
2026-06-18days on market $365,000 Active 4 DOM
-
2026-06-17days on market $365,000 Active 3 DOM
-
2026-06-16days on market $365,000 Active 2 DOM
-
2026-06-15remarks 699-char remark
-
2026-06-15$365,000 Active 1 DOM
ⓘ Source: listings_history table (triggers on properties + properties_extension) + one-shot
backfill from property_details.listing_events for pre-trigger history.
Tax reassessment forecast MS · Resets to sale price
- Current annual tax
- $2,258 · $188/mo
- Projected year-2 tax
- $2,884 · $240/mo
- Expected delta
- +$625/yr (+$52/mo · 27.7%)
ⓘ Screening estimate from a state-policy table — verify with the county assessor before closing.
Climate risk First Street
- Flood 1/10 Low FEMA zone X (unshaded) · 0% chance over 30 yrs
- Wildfire 3/10 Moderate
- Heat 7/10 Severe 7 d/yr ≥108°F today · 20 d/yr by 30 yrs out
- Wind 8/10 Severe 80% chance of damaging wind over 30 yrs
- Air quality 2/10 Low 0 unhealthy d/yr today · 1 by 30 yrs out
Nearby sold comps map
Loading sold comps map…
Walkable amenities ~0.75 mi
Loading nearby amenities…
Taxation est. · year 1
- Rental income
- $53,625
- − Mortgage interest
- −$20,446
- − Property taxes
- −$2,258
- − Insurance
- −$1,825
- − Repairs & maintenance
- −$4,290
- − Management
- −$4,290
- − Depreciation
- −$10,618
- Taxable income
- $9,898
- Est. tax owed @ 24.0%
- −$2,376
- After-tax cash flow
- $12,936/yr
For passive investors: Depreciation is non-cash, so a rental often shows a tax loss while cash-flowing — sheltering income. Rental losses are passive: they offset passive income freely, and up to $25,000/yr can offset ordinary (W-2) income if you actively participate and your MAGI is under $100k (phasing out to $0 by $150k); unused losses carry forward. On sale, claimed depreciation is recaptured at up to 25%, and gains may owe capital-gains tax (a 1031 exchange can defer both). Figures are a year-1 estimate at your 24.0% rate — not tax advice; consult a CPA.
Schools (NCES district)
- District
- Madison County School District
- NCES district ID
- 2802790
- Math proficiency
- 54% ▼ -7.00%
- Reading proficiency
- 54% ▼ -7.00%
- Median HH income
- $70,579
- Composite
- 48.08/100
- National rank
- #2188
- State rank
- #3 of 130 in MS
Livability — Madison
- Score
- 81/100
- State rank
- #4
- US rank
- #1556
Category grades
Schools grade is shown separately in the Schools card above.
Census & demographics
- Census place
- Madison, MS
- County
- Madison County · 75,005 people
- City population
- 50,443
- Metro
- Jackson, MS
- Population (ZIP)
- 50,443
- Household income
- $125,506
- Rent vs Own
- Severe rent burden
- 227.0
Population outlook (Madison County) Hauer SSP2
- Today (2025)
- 122,509 people
- By 2030
- 131,737 · +7.5%
- By 2040
- 148,930 · +21.6%
- By 2050
- 164,300 · +34.1%
- By 2075
- 197,495 · +61.2%
- By 2100
- 211,429 · +72.6%
Race, ethnicity, and origin ACS 2023
- Neighborhood character
- Predominantly White (76%)
- Race & ethnicity
- White 76% Black 15% Asian 4% Two or more races 3% Hispanic / Latino 2%
- Common ancestry
- Italian 6% Slovak 3% Lithuanian 3%
- Foreign-born
- 5% · China, Canada
- Languages at home
- 92% English-only · Spanish 2% Other Indo-European 2% Chinese 1%
Political lean MEDSL · Madison
- 2024 margin
- R (+17.3) · D 40.8% · R 58.0% · Other 1.2%
- 2008→2024 swing
- -1.7pp toward R · 2008: -15.6pp · 2024: -17.3pp
- All cycles
- 2024: R+17.3 2020: R+11.8 2016: R+16.1 2012: R+15.7 2008: R+15.6
Not yet ingested
- Civics
- —
Market trends
- HPI YoY
- ▼ -60.99%
- Current HPI
- 154.6909
- Rent YoY
- ▲ 2.61%
- Metro
- Jackson, MS
- State GDP YoY
- —
- F500 in state
- 0
Price history
+67.4% since first listed18 events — show timeline
- 2026-06-14 Listed $365,000 MLSU
- 2023-01-02 Listing Removed — MLSU
- 2022-12-31 Relisted — MLSU
- 2022-12-31 Listing Removed — MLSU
- 2022-12-27 Listed $339,500 MLSU
- 2016-11-21 Sold (MLS) — MLSU
- 2016-09-08 Listed $249,900 MLSU
- 2012-07-02 Sold (MLS) — MLSU
- 2012-03-07 Listed $249,900 MLSU
- 2009-10-30 Sold (MLS) — MLSU
- 2009-06-23 Listed $219,900 MLSU
- 2005-06-10 Sold (Public Records) — Public Records
- 2005-04-29 Sold (MLS) — MLSU
- 2005-02-20 Listed $218,000 MLSU
- 1995-12-27 Sold (Public Records) — Public Records
- 1992-08-12 Sold (Public Records) — Public Records
- 1992-08-12 Sold (Public Records) — Public Records
- 1992-05-04 Sold (Public Records) — Public Records
Property tax history
-0.6%/yrLatest (2025): $2,258 · +0.5% YoY. Source: county tax records.
Cash-flow waterfall
monthlySold comps — $/sqft
last 12 mo · ≤1 miLoading sold comps…