 🏗️ New Construction
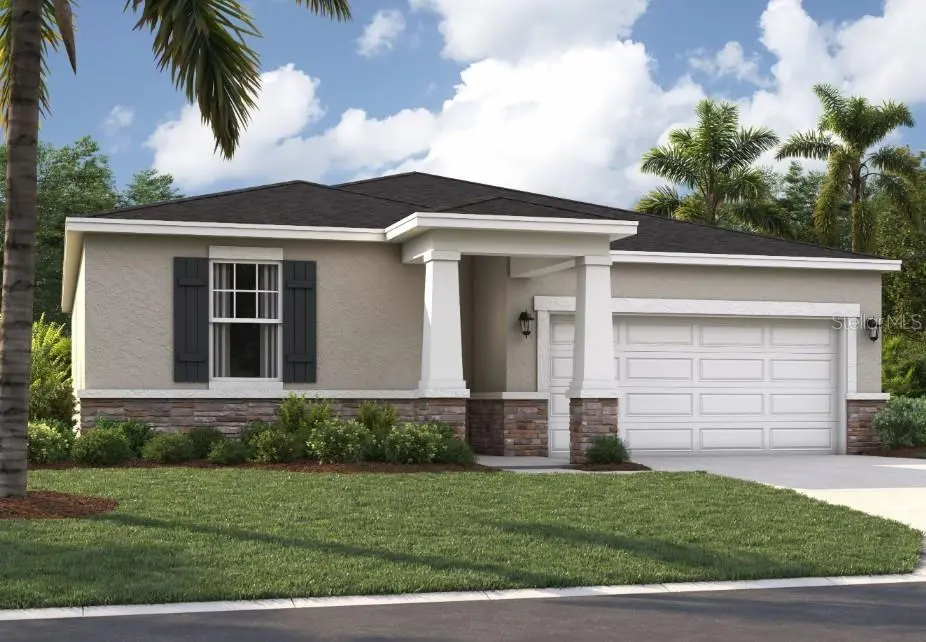
9221 Harris Hawk Dr · Leesburg, FL
Flood risk No data
- FEMA flood zone
- —
- Chance of flooding over 30 yrs
- —
- Est. flood insurance / yr
- —
Fire risk No data
- Est. fire insurance / yr
- —
Heat risk No data
- Hot days now (above threshold)
- —
- Hot days in 30 yrs
- —
Wind risk No data
- Chance of severe wind over 30 yrs
- —
Air-quality risk No data
- Unhealthy air days now
- —
- Unhealthy air days in 30 yrs
- —
Risk factors via First Street. Map © Google.
Why this score? — see what drove the D- grade
The composite is a weighted blend of 9 inputs, each scored 0–100. Each bar is that input's sub-score; the figure is the points it added to the 100-point composite (weight × sub-score).
- Cash flow +11.1/30.0
- ARV discount +7.5/15.0
- Schools +4.2/10.0
- DSCR +3.2/10.0
- Livability +3.1/5.0
- Rent growth +2.5/5.0
- Condition / age +2.5/5.0
- 1% rule +2.4/10.0
- Appreciation +0.0/10.0
$288,990
🖨 Deal sheet (PDF) 📄 Offer letter ✓ Due diligence
Listing remarks
One or more photo(s) has been virtually staged. Under Construction. Ready for a Florida lifestyle? You'll love living at Silver Lake Pointe, where you'll be just minutes from all the shopping, dining, and entertainment options, and convenient to downtown Leesburg and Mount Dora. Plus, you'll have three main lakes and beautiful Silver Lake right in your backyard and many nearby parks and golf courses offering endless recreational options! Get ready to enjoy the sunny days ahead with the on-site amenities, including a pool, cabana, and playground. Step inside the Quest single-family home, a thoughtfully designed residence that maximizes both comfort and efficiency. Spanning 1,350 square feet,
Key facts
- Silver lake
- Golf courses
- Nearby parks
Tags
Property features AI
Finance
- Other: Home warranty included; Lease restrictions apply
- Financial info: Total monthly fees $100 (total annual $1,200)
- HOA & community: HOA managed by Edison Association Management; Monthly HOA $100; includes grounds maintenance and pool; Community amenities: pool and playground; Deed restrictions apply; Pets allowed
Exterior
- Parking: Detached/common driveway parking; 2-car garage (18 x 20), attached
- Security: Smoke detectors
- Utilities: Public water; Public sewer; Cable connected; Electricity connected; Phone available; Water and sewer connected
- Home design: Single family residence; One story; New construction (projected completion July 30, 2026); North-facing
- Construction: Block, cement siding, stone and stucco construction; Shingle roof; Slab foundation; Built by Stanley Martin Homes (Model: Quest C)
- Exterior features: Covered patio; Patio; Exterior lighting; Sidewalk; Sliding doors; Landscaped and cleared lot; Paved road
Interior
- Kitchen: Dishwasher; Disposal; Microwave; Range
- Bedrooms: 3 bedrooms
- Flooring: Carpet; Ceramic tile
- Bathrooms: 2 full bathrooms
- Heating & cooling: Central heating (electric); Central air conditioning
- Interior features: Eat-in kitchen; Kitchen open to family room; Living and dining room combo; Open floorplan; Thermostat; Walk-in closets; Double pane, ENERGY STAR qualified windows
- Laundry & utility: Laundry room with washer and electric dryer hookups; Inside utility; Irrigation equipment
Neighborhood map
What this means for you Summary
Snapshot
- This is a 3-bed/2.0-bath land listed at $289k.
Deal economics
- At list price, monthly cash flow is $-115 ($-1k/yr) — negative.
- To cash-flow at today's rent, offer at most $269k (7.0% below list).
- To meet the 1% rule (rent ≥ 1% of price), the offer needs to be $214k (25.8% below list).
- Recommended offer: $214k (25.8% below list) — sets the bar for 1% rule.
- Cap rate 5.8% vs local median 4.4% in Leesburg — top-decile yield for the area; either an underpriced asset or a hidden risk that comps aren't pricing in. Stress-test before assuming the spread holds.
Location & tenants
- Location reads 62/100 on livability (#751 in FL) — a middle-class / working-renter tenant base. Strengths: cost of living A+, housing A+; Watch: crime D, amenities F, commute F.
- Lake (suburban): math 49% / reading 50% proficiency, ranked #37 of 73 in FL (top 51%) — families likely to look elsewhere, expect single-tenant / working-renter base with shorter leases.
- Zoned schools: Treadway Elementary School (math 53% / reading 48%, grade D+, #1,055 of 2,144 statewide, top 50%, 879 students, 66% FRL); Oak Park Middle School (math 32% / reading 36%, grade F, #426 of 571 statewide, top 75%, 575 students, 70% FRL); Leesburg High School (math 24% / reading 32%, grade F, #464 of 667 statewide, top 70%, 1,641 students, 58% FRL) — zoned schools average 65% FRL vs 49% district-wide (15 pts higher); higher-poverty schools than district average — tighter screening recommended.
- Zoned-school proficiency averages 38% at this address vs 50% district-wide (-12 pts) — the specific schools serving this property underperform the Lake average; the district grade overstates school quality for this exact location.
- Market conditions: 288 active listings in the ZIP; 3 comparable units currently listed for rent nearby; rentals at typical pace (median 26d on market — plan ~3-4 weeks tenant-placement turnaround); 4,799 units permitted in Lake County in 2024 (814 in 5+ unit buildings).
- At $2,145/mo this rent would consume 48% of the median local household income ($54k/yr) (locally 406% of renters already pay >50% of income on rent) — very limited rent-growth headroom before tenants either downsize or default.
Forward outlook
- Local home prices are declining (-3.0%/yr); year-one equity from $2k of loan paydown is wiped out by about $9k of value loss. Plan a longer hold.
- Lake County population projected at +37% by 2050 — long-run rental-demand tailwind backs the buy-and-hold thesis.
Negotiation context
- It's been on market 45 days — a 3% lower offer ($280k) is reasonable based on typical stale-listing flexibility.
Questions for the listing agent
- What do current leases actually rent for vs. the listed asking? Can we see a recent rent roll and the last 12 months of T-12 income?
- It's been on market 45 days. Have you received any prior offers? Is the seller open to a 26% concession, seller financing, or rate buy-down credit?
- What does the HOA fee cover, when was the last increase, and are there any pending special assessments or reserve-fund shortfalls?
- Is there a deadline driving the sale (1031 exchange, divorce, estate, relocation)? That informs how much negotiation room exists.
- Schools are D-rated, which usually means shorter tenancies and higher turnover. Who's the typical renter profile here, and what's been the actual vacancy rate?
- Crime grade is D in this area — have there been break-ins, vandalism, or insurance claims at this property in the last 3 years? What carrier currently insures it and at what premium?
- The area grade is low — what's the realistic commute time and amenity access for the typical tenant pool here? Any planned neighborhood developments (good or bad) we should know about?
- What's the average days-on-market for RENTAL listings here right now (not sales)? A rising rental-DOM trend means longer vacancies and softer asking-rent achievability than the comps imply.
- What's the recent tenant-quality profile in this submarket — average credit score on applications, eviction rate, late-payment / NSF rate, and stable-employment percentage? A property-management company in the area should have these aggregated.
- How much new for-sale + rental construction is in the pipeline within 1–3 miles? Heavy new supply typically softens prices + rents 12–24 months out; constrained supply supports both.
Investment metrics
- 1% rule
- 0.74% ✗
- Cap rate
- 5.82%
- Cash-on-cash
- -1.70%
- DSCR
- 0.92
- GRM
- 11.2
CMA / ARV
No comps found within radius.
Projected returns pro-forma
-3.0% appreciation · 3.0% rent growth · sell at horizon
- IRR
- -19.1%
- Equity multiple
- 0.33×
- Total profit
- $-54,218
- Equity at exit
- $43,089
- IRR
- -11.8%
- Equity multiple
- 0.30×
- Total profit
- $-56,958
- Equity at exit
- $24,987
Cash invested: $80,917 (down + closing). Projections, not guarantees.
Landlord ↔ Tenant lean methodology
- Overall (STATE)
- 87 Strongly Landlord-Friendly
- State Florida
- 87 Strongly Landlord-Friendly · R+3
- County
- — inherits STATE
- City
- — inherits STATE
ZIP-level market 34788
- Home prices YoY
- -18.2%
- Active inventory
- 288
- Price-to-rent
- 11.2×
Monthly cashflow live
- Estimated rent
- $2,145 medium interval (Pro) →
- Mortgage (P&I)
- −$1,515
- Tax from tax record
- −$73 /mo · $877/yr
- Insurance
- −$120
- HOA
- −$100
- Vacancy / Maint / Mgmt
- −$450
- Net cashflow
- $-115
Break-even live
Sensitivity live
| Price | -10% $49 | -5% $-33 | +0% $-115 | +5% $-197 | +10% $-278 |
|---|---|---|---|---|---|
| Rent | -10% $-284 | -5% $-199 | +0% $-115 | +5% $-30 | +10% $55 |
| Rate | -1.0pp $31 | -0.5pp $-41 | base $-115 | +0.5pp $-190 | +1.0pp $-266 |
UW: 25.0% down · 7.5% · 30yr · 1.5% tax · 5.0% vac · 8.0% maint · 8.0% mgmt
Financing live
Cash to close
- Down payment
- $72,248
- Closing costs
- $8,670
- Reserves months
- —
- Total cash needed
- —
Loan-product check · same deal, 3 products live
Conventional
25% down · 7.5% · 30yr
- Down + closing
- —
- Monthly P&I
- —
- Monthly cashflow
- —
- DSCR
- —
- Eligible?
- —
Personal DTI + credit; lowest rate.
DSCR
20% down · 8.5% · 30yr
- Down + closing
- —
- Monthly P&I
- —
- Monthly cashflow
- —
- DSCR
- —
- Eligible?
- —
No personal income docs; deal must DSCR.
Hard money
10% down · 12.0% · 12mo
- Down + closing
- —
- Monthly P&I
- —
- Monthly cashflow
- —
- DSCR
- —
- Eligible?
- —
Short-term bridge; refi at stabilization.
Rent comps 3 comps
| Address | Beds | Baths | Sqft | Rent | $/sqft | DOM | Units | Dist |
|---|---|---|---|---|---|---|---|---|
| 34000 Sky Blossom Cir Leesburg, FL | 3.0 | 2.0 | 1540 | $2,100 | $1.36 | 25d | 1 | 0.77mi |
| 33670 Sky Blossom Cir Leesburg, FL | 3.0 | 2.0 | 1540 | $1,950 | $1.27 | 25d | 1 | 0.95mi |
| 8508 Arbour Lake Dr Leesburg, FL | 1.0–3.0 | 1.0–2.0 | 1032 | $1,473 | $1.43 | 19d | 1 | 1.13mi |
HOA detail
- Monthly dues
- $100 · $1,200/yr
- Likely covers
- pool
Listing history 15 events
-
2026-06-21days on market $288,990 Active 45 DOM
-
2026-06-18days on market $288,990 Active 42 DOM
-
2026-06-17days on market $288,990 Active 41 DOM
-
2026-06-16days on market $288,990 Active 40 DOM
-
2026-06-15days on market $288,990 Active 39 DOM
-
2026-06-13days on market $288,990 Active 37 DOM
-
2026-06-09days on market $288,990 Active 33 DOM
-
2026-06-08days on market $288,990 Active 32 DOM
-
2026-06-07days on market $288,990 Active 31 DOM
-
2026-06-04days on market $288,990 Active 28 DOM
-
2026-06-03days on market $288,990 Active 27 DOM
-
2026-06-02days on market $288,990 Active 26 DOM
-
2026-06-01days on market $288,990 Active 25 DOM
-
2026-05-31days on market $288,990 Active 24 DOM
-
2026-05-07$288,990 Active
ⓘ Source: listings_history table (triggers on properties + properties_extension) + one-shot
backfill from property_details.listing_events for pre-trigger history.
Tax reassessment forecast FL · Resets to sale price
- Current annual tax
- $877 · $73/mo
- Projected year-2 tax
- $2,399 · $200/mo
- Expected delta
- +$1,521/yr (+$127/mo · 173.5%)
ⓘ Screening estimate from a state-policy table — verify with the county assessor before closing.
Nearby sold comps map
Loading sold comps map…
Walkable amenities ~0.75 mi
Loading nearby amenities…
Taxation est. · year 1
- Rental income
- $25,736
- − Mortgage interest
- −$16,188
- − Property taxes
- −$877
- − Insurance
- −$1,445
- − Repairs & maintenance
- −$2,059
- − Management
- −$2,059
- − HOA
- −$1,200
- − Depreciation
- −$8,407
- Taxable loss
- −$6,499
- Est. tax savings @ 24.0%
- +$1,560
- After-tax cash flow
- $183/yr
For passive investors: Depreciation is non-cash, so a rental often shows a tax loss while cash-flowing — sheltering income. Rental losses are passive: they offset passive income freely, and up to $25,000/yr can offset ordinary (W-2) income if you actively participate and your MAGI is under $100k (phasing out to $0 by $150k); unused losses carry forward. On sale, claimed depreciation is recaptured at up to 25%, and gains may owe capital-gains tax (a 1031 exchange can defer both). Figures are a year-1 estimate at your 24.0% rate — not tax advice; consult a CPA.
Schools (NCES district)
- District
- Lake
- NCES district ID
- 1201050
- Math proficiency
- 49% ▼ -7.00%
- Reading proficiency
- 50% ▼ -4.00%
- Median HH income
- $46,632
- Composite
- 42.05/100
- National rank
- #3327
- State rank
- #37 of 73 in FL
Livability — Leesburg
- Score
- 62/100
- State rank
- #751
- US rank
- #16429
Category grades
Schools grade is shown separately in the Schools card above.
Census & demographics
- Census place
- Leesburg, FL
- County
- Lake County · 364,602 people
- City population
- 70,232
- Metro
- Orlando-Kissimmee-Sanford, FL
- Population (ZIP)
- 22,137
- Household income
- $54,147
- Rent vs Own
- Severe rent burden
- 406.0
Population outlook (Lake County) Hauer SSP2
- Today (2025)
- 386,640 people
- By 2030
- 417,107 · +7.9%
- By 2040
- 476,676 · +23.3%
- By 2050
- 531,296 · +37.4%
- By 2075
- 648,303 · +67.7%
- By 2100
- 698,530 · +80.7%
Race, ethnicity, and origin ACS 2023
- Neighborhood character
- Predominantly White (79%)
- Race & ethnicity
- White 79% Hispanic / Latino 12% Two or more races 7% Black 5% Asian 1%
- Hispanic origin (detail)
- Mexican 3% Puerto Rican 6%
- Common ancestry
- Romanian 4% Lithuanian 3% Slovak 2%
- Foreign-born
- 5% · Canada, South Korea
- Languages at home
- 88% English-only · Spanish 9% German/W. Germanic 1% Tagalog/Filipino 1%
Political lean MEDSL · Lake
- 2024 margin
- Strong R (+24.7) · D 37.3% · R 62.0%
- 2008→2024 swing
- -11.2pp toward R · 2008: -13.5pp · 2024: -24.7pp
- All cycles
- 2024: R+24.7 2020: R+20.0 2016: R+23.1 2012: R+17.1 2008: R+13.5
Not yet ingested
- Civics
- —
Market trends
- HPI YoY
- ▼ -61.07%
- Current HPI
- 273.6616
- Rent YoY
- —
- Metro
- Orlando-Kissimmee-Sanford, FL
- State GDP YoY
- ▲ 3.28%
- F500 in state
- 36
Industry mix (Fortune 500 HQ in FL)
| Industry | F500 HQs | Revenue |
|---|---|---|
| Industrial Technology | 2 | $29B |
|
||
| Insurance | 2 | $17B |
|
||
| Retail | 1 | $60B |
|
||
| Technology Distribution | 1 | $58B |
|
||
| Homebuilding | 1 | $35B |
|
||
| Technology Manufacturing | 1 | $35B |
|
||
Price history
1 event — show timeline
- 2026-05-07 Listed $288,990 Stellar MLS as Distributed by MLS Grid
Property tax history
+17.5%/yrLatest (2025): $877 · +17.5% YoY. Source: county tax records.
Cash-flow waterfall
monthlySold comps — $/sqft
last 12 mo · ≤1 miLoading sold comps…