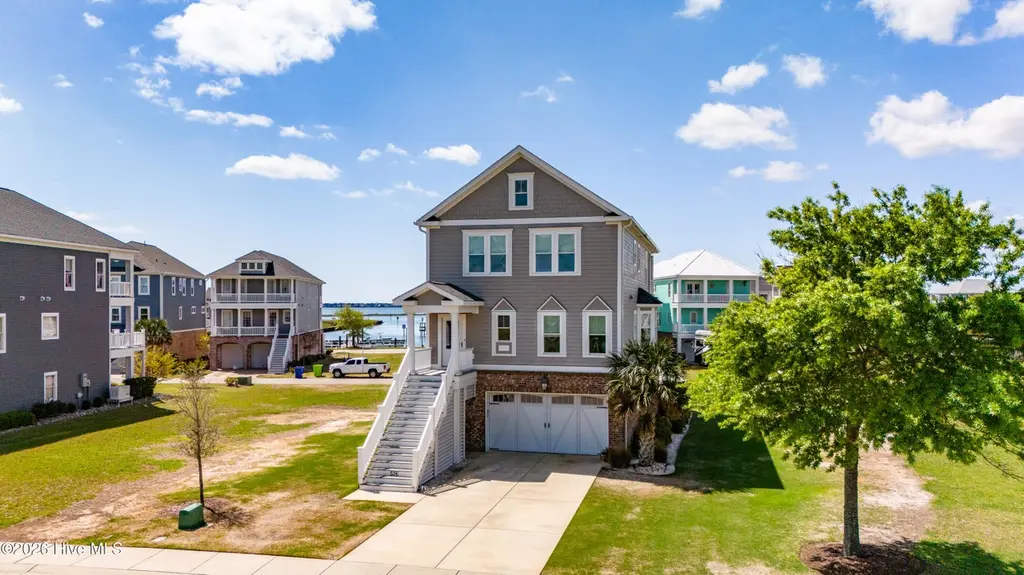
526 Cannonsgate Dr · Emerald Isle, NC
Flood risk 7/10 · Major
- FEMA flood zone
- X (unshaded)
- Chance of flooding over 30 yrs
- 0.77%
- Est. flood insurance / yr
- $507 – $1,088
Fire risk 4/10 · Minor
- Est. fire insurance / yr
- $906 – $1,684
Heat risk 9/10 · Severe
- Hot days now (above 103°F)
- 7 days/yr
- Hot days in 30 yrs
- 22 days/yr
Wind risk 8/10 · Major
- Chance of severe wind over 30 yrs
- 99.0%
Air-quality risk 2/10 · Minimal
- Unhealthy air days now
- 2 days/yr
- Unhealthy air days in 30 yrs
- 2 days/yr
Risk factors via First Street. Map © Google.
Why this score? — see what drove the C+ grade
The composite is a weighted blend of 9 inputs, each scored 0–100. Each bar is that input's sub-score; the figure is the points it added to the 100-point composite (weight × sub-score).
- Cash flow +27.7/30.0
- DSCR +9.8/10.0
- ARV discount +7.5/15.0
- 1% rule +6.4/10.0
- Schools +5.1/10.0
- Livability +3.2/5.0
- Rent growth +2.5/5.0
- Condition / age +2.5/5.0
- Appreciation +0.0/10.0
$1,099,000
🖨 Deal sheet (PDF) 📄 Offer letter ✓ Due diligence
Listing remarks MLS
Located second row to the marina, this lot is a wonderful opportunity to own prime property in a first class community for a great price. Neighborhood amenities include a beautiful clubhouse and pool, tennis courts, marina and boat launch. This is a wonderful place to build your dream home.
Key facts
- Bermuda 419 grass
- Fiber cement siding
- Custom built home
Tags
Property features AI
Finance
- HOA & community: Homeowners association with annual fee; Community clubhouse; Gated community; Picnic area; Playground; Security; Tennis courts; Trails; Sport court; Community pool; Street lights
Exterior
- Parking: Attached garage with 2 garage spaces (garage faces front); Two parking spaces total
- Security: Leased security system
- Utilities: Public water; Sewer connected; Natural gas connected; Underground utilities; Water connected
- Home design: Single-family residence; Three or more levels; Entry level is 2; Residential zoning
- Construction: Brick veneer, fiber cement, and frame construction; Slab foundation; Built with shingle roof
- Exterior features: Front porch; Rear porch; Porch; Patio/porch noted as 'See Remarks'; Irrigation system; Paved road access; Private road/easement frontage; Has a view; No fencing; Shingle roof
Interior
- Kitchen: Refrigerator; Dishwasher
- Flooring: Hardwood
- Bathrooms: Three full bathrooms; One half bathroom
- Heating & cooling: Heat pump heating; Heat pump cooling
- Interior features: Sound system; High ceilings; Entrance foyer; Kitchen island; Elevator; Pantry
- Laundry & utility: Dedicated laundry room; Tankless water heater; Water softener
Neighborhood map
What this means for you Summary
Snapshot
- This is a 3-bed/4.0-bath other listed at $1.10M.
Deal economics
- At list price, monthly cash flow is $3k ($39k/yr) — positive.
- The deal already cash-flows at list — no discount required.
- Meets the 1% rule at list price ($13k rent vs $1.10M).
- Recommended offer: $1.03M (6.0% below list) — sets the bar for market timing.
- Cap rate 9.9% vs local median 0.1% in Emerald Isle — top-decile yield for the area; either an underpriced asset or a hidden risk that comps aren't pricing in. Stress-test before assuming the spread holds.
Location & tenants
- Location reads 63/100 on livability (#401 in NC) — a middle-class / working-renter tenant base. Strengths: employment A+, housing A, crime B; Watch: amenities F, commute F, cost of living F.
- Carteret County Public Schools (rural): math 59% / reading 61% proficiency, ranked #31 of 178 in NC (top 17%) — acceptable for families but not a draw, mixed tenant base, ~2y average lease.
- Zoned schools: Bogue Sound Elementary (math 63% / reading 63%, grade B, #168 of 1,410 statewide, top 12%, 467 students, 99% FRL); Broad Creek Middle (math 63% / reading 68%, grade A-, #28 of 475 statewide, top 6%, 710 students, 100% FRL); Croatan High (math 82% / reading 78%, grade A, #73 of 535 statewide, top 13%, 974 students, 26% FRL) — zoned schools average 75% FRL vs 39% district-wide (36 pts higher); higher-poverty schools than district average — tighter screening recommended.
- Market conditions: 216 active listings in the ZIP; 935 units permitted in Carteret County in 2024 (360 in 5+ unit buildings).
Forward outlook
- Local home prices are declining (-3.0%/yr); year-one equity from $8k of loan paydown is wiped out by about $33k of value loss. Plan a longer hold.
- Carteret County population projected at +9% by 2050 — modest demand growth; plan on rents tracking national, not racing it.
- At projected returns (-3.0% appreciation + 3.0% rent growth), your $308k cash investment doubles in ~9 years — after that, you're playing with house money.
Negotiation context
- It's been on market 81 days — a 6% lower offer ($1.03M) is reasonable based on typical stale-listing flexibility.
- 5 sale attempts since 17y ago; this cycle's ask has dropped $90k (8%) from the opening price — seller is motivated, your offer sets the floor, not the list.
- Current owner paid $36k; list at $1.10M implies a 2953% gain — meaningful room to come down on a strong offer.
Risks & watch-outs
- Watch-outs: flood insurance adds $66/mo.
- Climate carrying-cost: major flood risk; severe wind risk, 99% chance of damaging wind over 30y; extreme-heat days projected 7→22/yr by 2055 (HVAC capex compounding) — expect insurance premiums to compound above CPI over the hold.
Questions for the listing agent
- It's been on market 81 days. Have you received any prior offers? Is the seller open to a 6% concession, seller financing, or rate buy-down credit?
- What's the actual annual flood-insurance premium (NFIP or private), and is the property in a SFHA with mandatory coverage?
- What does the HOA fee cover, when was the last increase, and are there any pending special assessments or reserve-fund shortfalls?
- Why hasn't it sold? Are there any deal-killer items the seller is aware of (foundation, flood, title, zoning, code violations)?
- Is there a deadline driving the sale (1031 exchange, divorce, estate, relocation)? That informs how much negotiation room exists.
- Schools are D-rated, which usually means shorter tenancies and higher turnover. Who's the typical renter profile here, and what's been the actual vacancy rate?
- What's the average days-on-market for RENTAL listings here right now (not sales)? A rising rental-DOM trend means longer vacancies and softer asking-rent achievability than the comps imply.
- What's the recent tenant-quality profile in this submarket — average credit score on applications, eviction rate, late-payment / NSF rate, and stable-employment percentage? A property-management company in the area should have these aggregated.
- How much new for-sale + rental construction is in the pipeline within 1–3 miles? Heavy new supply typically softens prices + rents 12–24 months out; constrained supply supports both.
Investment metrics
- 1% rule
- 1.14% ✓
- Cap rate
- 9.92%
- Cash-on-cash
- 12.95%
- DSCR
- 1.58
- GRM
- 7.3
CMA / ARV
No comps found within radius.
Projected returns pro-forma
-3.0% appreciation · 3.0% rent growth · sell at horizon
- IRR
- 2.4%
- Equity multiple
- 1.09×
- Total profit
- $28,721
- Equity at exit
- $163,864
- IRR
- 12.0%
- Equity multiple
- 1.94×
- Total profit
- $290,214
- Equity at exit
- $95,021
Cash invested: $307,720 (down + closing). Projections, not guarantees.
Landlord ↔ Tenant lean methodology
- Overall (STATE)
- 85 Strongly Landlord-Friendly
- State North Carolina
- 85 Strongly Landlord-Friendly · R+3
- County
- — inherits STATE
- City
- — inherits STATE
ZIP-level market 28570
- Home prices YoY
- -16.2%
- Active inventory
- 216
- Price-to-rent
- 7.3×
Monthly cashflow live
- Estimated rent
- $12,531 medium interval (Pro) →
- Mortgage (P&I)
- −$5,763
- Tax from tax record
- −$216 /mo · $2,591/yr
- Insurance
- −$458
- Flood insurance flood zone
- −$66 /mo · $798/yr
- HOA
- −$143
- Vacancy / Maint / Mgmt
- −$2,632
- Net cashflow
- $3,253
Break-even live
Sensitivity live
| Price | -10% $3,875 | -5% $3,564 | +0% $3,253 | +5% $2,942 | +10% $2,631 |
|---|---|---|---|---|---|
| Rent | -10% $2,263 | -5% $2,758 | +0% $3,253 | +5% $3,748 | +10% $4,243 |
| Rate | -1.0pp $3,807 | -0.5pp $3,533 | base $3,253 | +0.5pp $2,968 | +1.0pp $2,679 |
UW: 25.0% down · 7.5% · 30yr · 1.5% tax · 5.0% vac · 8.0% maint · 8.0% mgmt
Financing live
Cash to close
- Down payment
- $274,750
- Closing costs
- $32,970
- Reserves months
- —
- Total cash needed
- —
Loan-product check · same deal, 3 products live
Conventional
25% down · 7.5% · 30yr
- Down + closing
- —
- Monthly P&I
- —
- Monthly cashflow
- —
- DSCR
- —
- Eligible?
- —
Personal DTI + credit; lowest rate.
DSCR
20% down · 8.5% · 30yr
- Down + closing
- —
- Monthly P&I
- —
- Monthly cashflow
- —
- DSCR
- —
- Eligible?
- —
No personal income docs; deal must DSCR.
Hard money
10% down · 12.0% · 12mo
- Down + closing
- —
- Monthly P&I
- —
- Monthly cashflow
- —
- DSCR
- —
- Eligible?
- —
Short-term bridge; refi at stabilization.
HOA detail
- Monthly dues
- $143 · $1,716/yr
- Likely covers
- pool
Listing history 26 events
-
2026-06-19days on market $1,099,000 Active 81 DOM
-
2026-06-18days on market $1,099,000 Active 80 DOM
-
2026-06-17days on market $1,099,000 Active 79 DOM
-
2026-06-16days on market $1,099,000 Active 78 DOM
-
2026-06-15days on market $1,099,000 Active 77 DOM
-
2026-06-14days on market $1,099,000 Active 75 DOM
-
2026-06-12days on market $1,099,000 Active 74 DOM
-
2026-06-09days on market $1,099,000 Active 71 DOM
-
2026-06-08days on market $1,099,000 Active 70 DOM
-
2026-06-07days on market $1,099,000 Active 69 DOM
-
2026-06-05days on market $1,099,000 Active 66 DOM
-
2026-06-03days on market $1,099,000 Active 65 DOM
-
2026-06-02days on market $1,099,000 Active 64 DOM
-
2026-06-01days on market $1,099,000 Active 63 DOM
-
2026-05-31days on market $1,099,000 Active 62 DOM
-
2026-05-30days on market $1,099,000 Active 61 DOM
-
2026-04-25price $1,119,000
-
2026-03-30$1,189,000 Active
-
2017-11-28soldstatus $36,000 291-char remark
Show marketing remark (291 chars)
Located second row to the marina, this lot is a wonderful opportunity to own prime property in a first class community for a great price. Neighborhood amenities include a beautiful clubhouse and pool, tennis courts, marina and boat launch. This is a wonderful place to build your dream home.
-
2017-01-18$44,500 291-char remark
Show marketing remark (291 chars)
Located second row to the marina, this lot is a wonderful opportunity to own prime property in a first class community for a great price. Neighborhood amenities include a beautiful clubhouse and pool, tennis courts, marina and boat launch. This is a wonderful place to build your dream home.
-
2016-11-30historical
-
2015-11-16$49,990
-
2011-06-03soldstatus $53,000
-
2011-02-26$59,900
-
2010-01-25soldstatus $37,000
-
2009-12-01$45,000
ⓘ Source: listings_history table (triggers on properties + properties_extension) + one-shot
backfill from property_details.listing_events for pre-trigger history.
Tax reassessment forecast NC · Resets to sale price
- Current annual tax
- $2,591 · $216/mo
- Projected year-2 tax
- $9,012 · $751/mo
- Expected delta
- +$6,421/yr (+$535/mo · 247.8%)
ⓘ Screening estimate from a state-policy table — verify with the county assessor before closing.
Climate risk First Street
- Flood 7/10 Severe FEMA zone X (unshaded) · 77% chance over 30 yrs
- Wildfire 4/10 Moderate
- Heat 9/10 Extreme 7 d/yr ≥103°F today · 22 d/yr by 30 yrs out
- Wind 8/10 Severe 99% chance of damaging wind over 30 yrs
- Air quality 2/10 Low 2 unhealthy d/yr today · 2 by 30 yrs out
Nearby sold comps map
Loading sold comps map…
Walkable amenities ~0.75 mi
Loading nearby amenities…
Taxation est. · year 1
- Rental income
- $150,377
- − Mortgage interest
- −$61,561
- − Property taxes
- −$2,591
- − Insurance
- −$6,292
- − Repairs & maintenance
- −$12,030
- − Management
- −$12,030
- − HOA
- −$1,716
- − Depreciation
- −$31,971
- Taxable income
- $22,185
- Est. tax owed @ 24.0%
- −$5,324
- After-tax cash flow
- $33,714/yr
For passive investors: Depreciation is non-cash, so a rental often shows a tax loss while cash-flowing — sheltering income. Rental losses are passive: they offset passive income freely, and up to $25,000/yr can offset ordinary (W-2) income if you actively participate and your MAGI is under $100k (phasing out to $0 by $150k); unused losses carry forward. On sale, claimed depreciation is recaptured at up to 25%, and gains may owe capital-gains tax (a 1031 exchange can defer both). Figures are a year-1 estimate at your 24.0% rate — not tax advice; consult a CPA.
Schools (NCES district)
- District
- Carteret County Public Schools
- NCES district ID
- 3700630
- Math proficiency
- 59% ▲ 5.00%
- Reading proficiency
- 61% ▲ 2.00%
- Median HH income
- $48,330
- Composite
- 50.92/100
- National rank
- #1786
- State rank
- #31 of 178 in NC
Livability — Emerald Isle
- Score
- 63/100
- State rank
- #401
- US rank
- #15298
Category grades
Schools grade is shown separately in the Schools card above.
Census & demographics
- County
- Carteret County · 52,389 people
- Metro
- Morehead City, NC
- Population (ZIP)
- 22,197
- Household income
- $70,229
- Rent vs Own
- Severe rent burden
- 461.0
Population outlook (Carteret County) Hauer SSP2
- Today (2025)
- 73,443 people
- By 2030
- 75,344 · +2.6%
- By 2040
- 78,142 · +6.4%
- By 2050
- 80,091 · +9.1%
- By 2075
- 86,120 · +17.3%
- By 2100
- 89,408 · +21.7%
Race, ethnicity, and origin ACS 2023
- Neighborhood character
- Predominantly White (82%)
- Race & ethnicity
- White 82% Hispanic / Latino 7% Two or more races 6% Black 3% Asian 1%
- Hispanic origin (detail)
- Mexican 4%
- Common ancestry
- Slovak 3% Romanian 3% Lithuanian 2%
- Foreign-born
- 5% · Canada, Dominican Republic
- Languages at home
- 92% English-only · Spanish 6% German/W. Germanic 1%
Political lean MEDSL · Carteret
- 2024 margin
- Solid R (+43.1) · D 28.0% · R 71.1%
- 2008→2024 swing
- -8.4pp toward R · 2008: -34.7pp · 2024: -43.1pp
- All cycles
- 2024: R+43.1 2020: R+42.0 2016: R+44.5 2012: R+41.0 2008: R+34.7
Not yet ingested
- Civics
- —
Market trends
- HPI YoY
- ▼ -53.54%
- Current HPI
- 276.6589
- Rent YoY
- —
- Metro
- Morehead City, NC
- State GDP YoY
- ▲ 3.28%
- F500 in state
- 26
Industry mix (Fortune 500 HQ in NC)
| Industry | F500 HQs | Revenue |
|---|---|---|
| Financial Services | 2 | $213B |
|
||
| Retail | 2 | $95B |
|
||
| Industrial Conglomerate | 1 | $38B |
|
||
| Metals / Steel | 1 | $35B |
|
||
| Utilities | 1 | $30B |
|
||
| Industrial Machinery | 1 | $19B |
|
||
Price history
+2386.7% since first listed10 events — show timeline
- 2026-04-25 Price Changed $1,119,000 Hive MLS
- 2026-03-30 Listed $1,189,000 Hive MLS
- 2017-11-28 Sold (MLS) $36,000 Hive MLS
- 2017-01-18 Listed $44,500 Hive MLS
- 2016-11-30 Listing Removed — Hive MLS
- 2015-11-16 Listed $49,990 Hive MLS
- 2011-06-03 Sold (MLS) $53,000 Hive MLS
- 2011-02-26 Listed $59,900 Hive MLS
- 2010-01-25 Sold (MLS) $37,000 Hive MLS
- 2009-12-01 Listed $45,000 Hive MLS
Property tax history
+45.8%/yrLatest (2025): $2,591 · +25.6% YoY. Source: county tax records.
Cash-flow waterfall
monthlySold comps — $/sqft
last 12 mo · ≤1 miLoading sold comps…