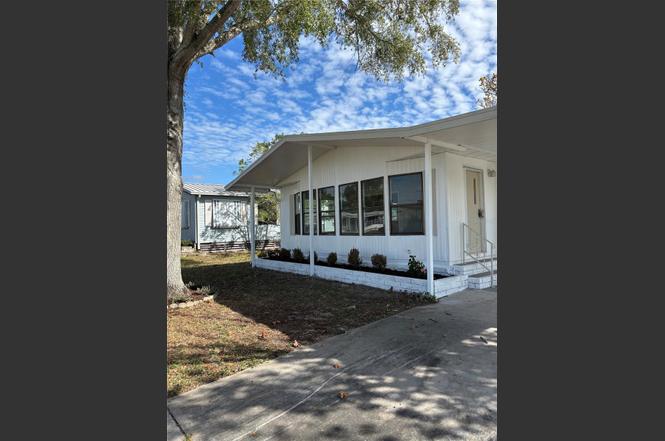
9863 Scepter Ave · Brookridge, FL
Flood risk 1/10 · Minimal
- FEMA flood zone
- X (unshaded)
- Chance of flooding over 30 yrs
- 0.0%
- Est. flood insurance / yr
- $507 – $1,088
Fire risk 5/10 · Moderate
- Est. fire insurance / yr
- $947 – $1,759
Heat risk 10/10 · Severe
- Hot days now (above 109°F)
- 7 days/yr
- Hot days in 30 yrs
- 26 days/yr
Wind risk 9/10 · Severe
- Chance of severe wind over 30 yrs
- 99.0%
Air-quality risk 2/10 · Minimal
- Unhealthy air days now
- 1 days/yr
- Unhealthy air days in 30 yrs
- 1 days/yr
Risk factors via First Street. Map © Google.
Why this score? — see what drove the C+ grade
The composite is a weighted blend of 9 inputs, each scored 0–100. Each bar is that input's sub-score; the figure is the points it added to the 100-point composite (weight × sub-score).
- Cash flow +21.0/30.0
- ARV discount +15.0/15.0
- DSCR +6.7/10.0
- 1% rule +5.8/10.0
- Schools +4.2/10.0
- Livability +3.5/5.0
- Rent growth +2.5/5.0
- Condition / age +2.5/5.0
- Appreciation +0.0/10.0
$144,900
🖨 Deal sheet 📄 Offer letter ✓ Due diligence
Listing remarks
WELCOME HOME -- This newly renovated 2/2 home is ready for it's new owner. Freshly painted inside and out. BRAND NEW luxury vinyl flooring throughout the 1328 sqft of living space. BRAND NEW KITCHEN -- new cabinets, granite countertops, new stainless steel appliances, new tiled backsplash, stainless steel sink; featuring, a center island with additional storage! Large eating area just off the kitchen. Newer fans/fixtures throughout. SELLER INTENDS TO INSTALL BRAND NEW CENTRAL HVAC SYSTEM PRIOR TO CLOSING. Large, covered, side-porch. Laundry hookups are located inside the storage area. Nice yard with no rear neighbor. Covered carport. Located inside the active community of Brookridge which f
Key facts
- New kitchen
- Large eating area
- Covered side-porch
Tags
Property features AI
Finance
- Other: Total acreage: less than 1/4 acre (approx. 0.19 acres); Living area reported as 1,328 sq ft; building area reported as 2,065 sq ft
- Financial info: Lease restrictions apply
- HOA & community: Monthly HOA fee of $50; Association requires approval; Association amenities include clubhouse, fitness center, pool; Community features: clubhouse, deed restrictions, fitness center, golf carts allowed, pool; Senior community; Pets allowed
Exterior
- Parking: Carport (1 space)
- Utilities: Public water; Public sewer; Utilities connected
- Home design: Manufactured double-wide home; One story; Faces northwest; Residential property
- Construction: Metal siding and frame construction; Metal roof; Pillar/post/pier foundation; Built as double wide manufactured home
- Exterior features: Exterior lighting; Paved road access; Lot dimensions approximately 60 x 136
Interior
- Kitchen: Dishwasher; Range; Microwave
- Bedrooms: 2 bedrooms
- Flooring: Vinyl
- Bathrooms: 2 full bathrooms
- Heating & cooling: Central heating (electric); Central air conditioning
- Interior features: Ceiling fans; Kitchen open to family room; Stone counters
- Laundry & utility: Washer; Dryer; Electric water heater; Laundry in garage
Neighborhood map
What this means for you Summary
Snapshot
- This is a 2-bed/2.0-bath manufactured listed at $145k.
Deal economics
- At list price, monthly cash flow is $203 ($2k/yr) — positive.
- The deal already cash-flows at list — no discount required.
- Meets the 1% rule at list price ($2k rent vs $145k).
- Recommended offer: $128k (12.0% below list) — sets the bar for market timing.
- Cap rate 8.0% vs local median 6.3% in Brookridge — meaningfully above typical; check what's discounted (condition, days-on-market, listing class) to confirm the premium yield is real.
Location & tenants
- Location reads 70/100 on livability (#421 in FL) — a middle-class / working-renter tenant base. Strengths: cost of living A+, housing A+, crime B+; Watch: employment C-, health & safety C-, schools F.
- Hernando (suburban): math 50% / reading 50% proficiency, ranked #38 of 73 in FL (top 52%) — acceptable for families but not a draw, mixed tenant base, ~2y average lease.
- Market conditions: 691 active listings in the ZIP; 10 comparable units currently listed for rent nearby; rentals at typical pace (median 22d on market — plan ~3-4 weeks tenant-placement turnaround); 2,505 units permitted in Hernando County in 2024 (318 in 5+ unit buildings).
- This rent runs 32% of the median local income ($59k/yr) — at the standard rent-burdened threshold; future hikes will face affordability resistance.
Forward outlook
- Local home prices are declining (-3.0%/yr); year-one equity from $1k of loan paydown is wiped out by about $4k of value loss. Plan a longer hold.
- Hernando County population projected at +11% by 2050 — modest demand growth; plan on rents tracking national, not racing it.
Negotiation context
- It's been on market 188 days — a 12% lower offer ($128k) is reasonable based on typical stale-listing flexibility.
- 6 sale attempts since 21y ago; this cycle's ask has dropped $55k (28%) from the opening price — seller is motivated, your offer sets the floor, not the list.
- Current owner paid $77k; list at $145k implies a 88% gain — meaningful room to come down on a strong offer.
Risks & watch-outs
- Climate carrying-cost: severe wind risk, 99% chance of damaging wind over 30y; moderate wildfire risk; extreme-heat days projected 7→26/yr by 2055 (HVAC capex compounding) — expect insurance premiums to compound above CPI over the hold.
Questions for the listing agent
- It's been on market 188 days. Have you received any prior offers? Is the seller open to a 12% concession, seller financing, or rate buy-down credit?
- What does the HOA fee cover, when was the last increase, and are there any pending special assessments or reserve-fund shortfalls?
- Why hasn't it sold? Are there any deal-killer items the seller is aware of (foundation, flood, title, zoning, code violations)?
- Is there a deadline driving the sale (1031 exchange, divorce, estate, relocation)? That informs how much negotiation room exists.
- Schools are F-rated, which usually means shorter tenancies and higher turnover. Who's the typical renter profile here, and what's been the actual vacancy rate?
- What's the average days-on-market for RENTAL listings here right now (not sales)? A rising rental-DOM trend means longer vacancies and softer asking-rent achievability than the comps imply.
- What's the recent tenant-quality profile in this submarket — average credit score on applications, eviction rate, late-payment / NSF rate, and stable-employment percentage? A property-management company in the area should have these aggregated.
- How much new for-sale + rental construction is in the pipeline within 1–3 miles? Heavy new supply typically softens prices + rents 12–24 months out; constrained supply supports both.
Investment metrics
- 1% rule
- 1.08% ✓
- Cap rate
- 7.98%
- Cash-on-cash
- 6.02%
- DSCR
- 1.27
- GRM
- 7.7
CMA / ARV
- ARV (on-the-fly)
- $176,624
- Comps found
- 12
Show comp detail 12 sales within ~0.75 mi
| Address | Dist | Beds/Ba | Sqft | Sold | Price | $/sf | Match |
|---|---|---|---|---|---|---|---|
| 9847 Scepter Ave | 0.02mi | 2/2.0 | 1,248 (-6%) | 0mo | $154,000 | $123 | 88 |
| 9847 Scepter Ave | 0.02mi | 2/2.0 | 1,248 (-6%) | 0mo | $154,000 | $123 | 88 |
| 15712 Brookridge Blvd | 0.15mi | 2/2.0 | 1,246 (-6%) | 2mo | $200,000 | $161 | 81 |
| 14311 Action St | 0.40mi | 3/2.0 (+1) | 1,369 (+3%) | 1mo | $230,000 | $168 | 70 |
| 9256 Salisbury Dr | 0.58mi | 2/2.0 | 1,344 (+1%) | 2mo | $178,000 | $132 | 69 |
| 9155 Fontaine Dr | 0.63mi | 2/2.0 | 1,296 (-2%) | 2mo | $172,200 | $133 | 65 |
| 14298 Action St | 0.41mi | 2/2.0 | 1,448 (+9%) | 2mo | $210,000 | $145 | 64 |
| 9259 Salvini Dr | 0.29mi | 2/2.0 | 1,152 (-13%) | 1mo | $165,000 | $143 | 63 |
| 14761 Rialto Ave | 0.27mi | 2/2.0 | 1,512 (+14%) | 2mo | $181,000 | $120 | 63 |
| 8271 Modena Ave | 0.68mi | 2/2.0 | 1,265 (-5%) | 0mo | $107,000 | $85 | 60 |
| 14986 Rialto Ave | 0.47mi | 2/2.0 | 1,188 (-10%) | 2mo | $185,000 | $156 | 58 |
| 14883 Rialto Ave | 0.59mi | 2/2.0 | 1,144 (-14%) | 0mo | $148,000 | $129 | 49 |
Match score weights: distance 35% · size 25% · config 20% · recency 20%. Top-matched comps best support the ARV.
Projected returns pro-forma
-3.0% appreciation · 3.0% rent growth · sell at horizon
- IRR
- -7.0%
- Equity multiple
- 0.74×
- Total profit
- $-10,481
- Equity at exit
- $21,605
- IRR
- 2.7%
- Equity multiple
- 1.19×
- Total profit
- $7,726
- Equity at exit
- $12,528
Cash invested: $40,572 (down + closing). Projections, not guarantees.
Landlord ↔ Tenant lean methodology
- Overall (STATE)
- 87 Strongly Landlord-Friendly
- State Florida
- 87 Strongly Landlord-Friendly · R+3
- County
- — inherits STATE
- City
- — inherits STATE
ZIP-level market 34613
- Home prices YoY
- -17.2%
- Active inventory
- 691
- Price-to-rent
- 7.7×
Monthly cashflow live
- Estimated rent
- $1,561 high interval (Pro) →
- Mortgage (P&I)
- −$760
- Tax from tax record
- −$160 /mo · $1,915/yr
- Insurance
- −$60
- HOA
- −$50
- Vacancy / Maint / Mgmt
- −$328
- Net cashflow
- $203
Break-even live
UW: 25.0% down · 7.5% · 30yr · 1.5% tax · 5.0% vac · 8.0% maint · 8.0% mgmt
Financing live
Cash to close
- Down payment
- $36,225
- Closing costs
- $4,347
- Reserves months
- —
- Total cash needed
- —
Loan-product check · same deal, 3 products live
Conventional
25% down · 7.5% · 30yr
- Down + closing
- —
- Monthly P&I
- —
- Monthly cashflow
- —
- DSCR
- —
- Eligible?
- —
Personal DTI + credit; lowest rate.
DSCR
20% down · 8.5% · 30yr
- Down + closing
- —
- Monthly P&I
- —
- Monthly cashflow
- —
- DSCR
- —
- Eligible?
- —
No personal income docs; deal must DSCR.
Hard money
10% down · 12.0% · 12mo
- Down + closing
- —
- Monthly P&I
- —
- Monthly cashflow
- —
- DSCR
- —
- Eligible?
- —
Short-term bridge; refi at stabilization.
Rent comps 10 comps
| Address | Beds | Baths | Sqft | Rent | $/sqft | DOM | Units | Dist |
|---|---|---|---|---|---|---|---|---|
| 9919 Scepter Ave Brooksville, FL | 3.0 | 2.0 | 1188 | $1,250 | $1.05 | 5d | 1 | 0.10mi |
| 8871 Southern Charm Cir Brooksville, FL | 3.0 | 2.0 | 1482 | $2,050 | $1.38 | 24d | 1 | 0.63mi |
| 8917 Southern Charm Cir Brooksville, FL | 3.0 | 2.0 | 1437 | $1,695 | $1.18 | 3d | 1 | 0.64mi |
| 8761 Fetterbush Ct Brooksville, FL | 3.0 | 2.0 | 1730 | $1,850 | $1.07 | 24d | 1 | 0.66mi |
| 8407 Weatherford Ave Brooksville, FL | 2.0 | 2.0 | 1104 | $1,500 | $1.36 | 17d | 1 | 0.69mi |
| 9289 Scepter Ave Brooksville, FL | 3.0 | 2.0 | 1512 | $1,400 | $0.93 | 5d | 1 | 0.85mi |
| 9356 Southern Charm Cir Brooksville, FL | 3.0 | 2.0 | 1621 | $1,800 | $1.11 | 24d | 1 | 0.91mi |
| 14131 Lemon Yellow Tree Ln Brooksville, FL | 3.0 | 2.0 | 1840 | $1,979 | $1.08 | 5d | 1 | 0.94mi |
| 14342 Starcross St Brooksville, FL | 2.0 | 1.0 | 900 | $1,025 | $1.14 | 21d | 1 | 1.05mi |
| 14697 Brookridge Blvd Brooksville, FL | 2.0 | 2.0 | 1056 | $1,350 | $1.28 | 24d | 1 | 1.34mi |
HOA detail
- Monthly dues
- $50 · $600/yr
Listing history 19 events
-
2026-05-06status Pending
-
2026-04-29price $144,900
-
2026-04-20price $149,900
-
2026-03-16price $159,900
-
2026-02-04price $169,900
-
2025-12-23price $189,900
-
2025-10-30$199,900 Active
-
2019-11-11historical
-
2016-12-21historical
-
2016-11-28$69,900
-
2016-07-22$69,900
-
2016-06-02historical
-
2016-06-02historical
-
2016-04-08$45,000
-
2016-04-08$45,000
-
2005-08-08soldstatus $76,900
-
2005-06-27soldstatus $76,900
-
2005-03-29$79,900
-
1999-12-09soldstatus $42,000
ⓘ Source: listings_history table (triggers on properties + properties_extension) + one-shot
backfill from property_details.listing_events for pre-trigger history.
Tax reassessment forecast FL · Resets to sale price
- Current annual tax
- $1,915 · $160/mo
- Projected year-2 tax
- $1,915 · $160/mo
- Expected delta
- $0/yr ($0/mo · 0.0%)
ⓘ Screening estimate from a state-policy table — verify with the county assessor before closing.
Climate risk First Street
- Flood 1/10 Low FEMA zone X (unshaded) · 0% chance over 30 yrs
- Wildfire 5/10 Major
- Heat 10/10 Extreme 7 d/yr ≥109°F today · 26 d/yr by 30 yrs out
- Wind 9/10 Extreme 99% chance of damaging wind over 30 yrs
- Air quality 2/10 Low 1 unhealthy d/yr today · 1 by 30 yrs out
Nearby sold comps map
Loading sold comps map…
Walkable amenities ~0.75 mi
Loading nearby amenities…
Taxation est. · year 1
- Rental income
- $18,734
- − Mortgage interest
- −$8,117
- − Property taxes
- −$1,915
- − Insurance
- −$724
- − Repairs & maintenance
- −$1,499
- − Management
- −$1,499
- − HOA
- −$600
- − Depreciation
- −$4,215
- Taxable income
- $165
- Est. tax owed @ 24.0%
- −$40
- After-tax cash flow
- $2,402/yr
For passive investors: Depreciation is non-cash, so a rental often shows a tax loss while cash-flowing — sheltering income. Rental losses are passive: they offset passive income freely, and up to $25,000/yr can offset ordinary (W-2) income if you actively participate and your MAGI is under $100k (phasing out to $0 by $150k); unused losses carry forward. On sale, claimed depreciation is recaptured at up to 25%, and gains may owe capital-gains tax (a 1031 exchange can defer both). Figures are a year-1 estimate at your 24.0% rate — not tax advice; consult a CPA.
Schools (NCES district)
- District
- Hernando
- NCES district ID
- 1200810
- Math proficiency
- 50% ▼ -8.00%
- Reading proficiency
- 50% ▼ -4.00%
- Median HH income
- $41,985
- Composite
- 42.03/100
- National rank
- #3329
- State rank
- #38 of 73 in FL
Livability — Brookridge
- Score
- 70/100
- State rank
- #421
- US rank
- #7529
Category grades
Schools grade is shown separately in the Schools card above.
Census & demographics
- Census place
- Brookridge, FL
- County
- Hernando County · 169,677 people
- Metro
- Tampa-St. Petersburg-Clearwater, FL
- Population (ZIP)
- 19,337
- Household income
- $58,596
- Rent vs Own
- Severe rent burden
- 307.0
Population outlook (Hernando County) Hauer SSP2
- Today (2025)
- 189,218 people
- By 2030
- 194,367 · +2.7%
- By 2040
- 203,398 · +7.5%
- By 2050
- 209,589 · +10.8%
- By 2075
- 218,452 · +15.4%
- By 2100
- 205,923 · +8.8%
Race, ethnicity, and origin ACS 2023
- Neighborhood character
- Predominantly White (88%)
- Race & ethnicity
- White 88% Hispanic / Latino 6% Two or more races 4% Black 2% Asian 1%
- Hispanic origin (detail)
- Mexican 1% Puerto Rican 2% Cuban 1%
- Common ancestry
- Romanian 4% Lithuanian 3% Slovak 2%
- Foreign-born
- 8% · Canada, Vietnam
- Languages at home
- 92% English-only · Spanish 3% French/Haitian/Cajun 1% Russian/Polish/Slavic 1%
Political lean MEDSL · Hernando
- 2024 margin
- Solid R (+37.0) · D 31.1% · R 68.2%
- 2008→2024 swing
- -33.5pp toward R · 2008: -3.6pp · 2024: -37.0pp
- All cycles
- 2024: R+37.0 2020: R+30.2 2016: R+29.0 2012: R+8.5 2008: R+3.6
Not yet ingested
- Civics
- —
Market trends
- HPI YoY
- ▼ -57.51%
- Current HPI
- 276.2229
- Rent YoY
- —
- Metro
- Tampa-St. Petersburg-Clearwater, FL
- State GDP YoY
- ▲ 3.28%
- F500 in state
- 36
Industry mix (Fortune 500 HQ in FL)
| Industry | F500 HQs | Revenue |
|---|---|---|
| Industrial Technology | 2 | $29B |
|
||
| Insurance | 2 | $17B |
|
||
| Retail | 1 | $60B |
|
||
| Technology Distribution | 1 | $58B |
|
||
| Homebuilding | 1 | $35B |
|
||
| Technology Manufacturing | 1 | $35B |
|
||
Price history
+245.0% since first listed19 events — show timeline
- 2026-05-06 Pending — Stellar MLS as Distributed by MLS Grid
- 2026-04-29 Price Changed $144,900 Stellar MLS as Distributed by MLS Grid
- 2026-04-20 Price Changed $149,900 Stellar MLS as Distributed by MLS Grid
- 2026-03-16 Price Changed $159,900 Stellar MLS as Distributed by MLS Grid
- 2026-02-04 Price Changed $169,900 Stellar MLS as Distributed by MLS Grid
- 2025-12-23 Price Changed $189,900 Stellar MLS as Distributed by MLS Grid
- 2025-10-30 Listed $199,900 Stellar MLS as Distributed by MLS Grid
- 2019-11-11 Listing Removed — HCAR
- 2016-12-21 Listing Removed — HCAR
- 2016-11-28 Listed $69,900 HCAR
- 2016-07-22 Listed $69,900 HCAR
- 2016-06-02 Listing Removed — Stellar MLS as Distributed by MLS Grid
- 2016-06-02 Listing Removed — HCAR
- 2016-04-08 Listed $45,000 Stellar MLS as Distributed by MLS Grid
- 2016-04-08 Listed $45,000 HCAR
- 2005-08-08 Sold (Public Records) $76,900 Public Records
- 2005-06-27 Sold (MLS) $76,900 HCAR
- 2005-03-29 Listed $79,900 HCAR
- 1999-12-09 Sold (Public Records) $42,000 Public Records
Property tax history
+17.4%/yrLatest (2025): $1,915 · +0.0% YoY. Source: county tax records.
Cash-flow waterfall
monthlySold comps — $/sqft
last 12 mo · ≤1 miLoading sold comps…