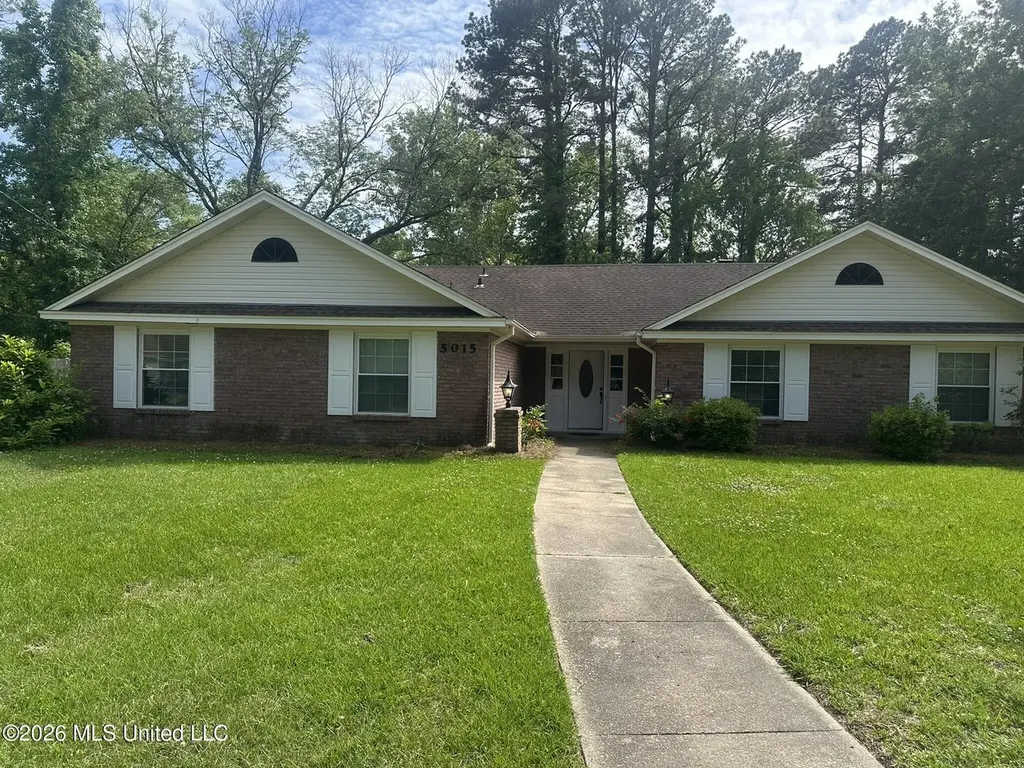
5015 Romany Dr · Jackson, MS
Flood risk 1/10 · Minimal
- FEMA flood zone
- AE
- Chance of flooding over 30 yrs
- 0.0%
- Est. flood insurance / yr
- $1,737 – $8,500
Fire risk 1/10 · Minimal
- Est. fire insurance / yr
- $1,241 – $2,305
Heat risk 7/10 · Major
- Hot days now (above 108°F)
- 7 days/yr
- Hot days in 30 yrs
- 20 days/yr
Wind risk 7/10 · Major
- Chance of severe wind over 30 yrs
- 78.0%
Air-quality risk 2/10 · Minimal
- Unhealthy air days now
- 0 days/yr
- Unhealthy air days in 30 yrs
- 1 days/yr
Risk factors via First Street. Map © Google.
Why this score? — see what drove the B+ grade
The composite is a weighted blend of 9 inputs, each scored 0–100. Each bar is that input's sub-score; the figure is the points it added to the 100-point composite (weight × sub-score).
- Cash flow +30.0/30.0
- ARV discount +15.0/15.0
- DSCR +10.0/10.0
- 1% rule +9.8/10.0
- Rent growth +4.5/5.0
- Livability +3.4/5.0
- Condition / age +2.5/5.0
- Schools +1.1/10.0
- Appreciation +0.0/10.0
$149,900
🖨 Deal sheet 📄 Offer letter ✓ Due diligence
Listing remarks
SELLER RECEIVING MULTIPLE OFFERS SUNDAY 5/17/26 THRU 5PM TODAY--WILL REVIEW ALL OFFERS AND RESPOND BY 7pm CASH ONLY - AS IS SALE, TOTAL FIXER UPPER NESTLED ON OVER-SIZED CUL-DE-SAC LOT WITH VERY SPACIOUS PLAN 4/2.5 FORMAL FOYER, LIVING, DINING WITH OVERSIZED GREATROOM. HUGE, PRIVATE, COMPLETELY FENCED BACKYARD OFFERING TOTAL PRIVACY WITH STUNNING SCENIC VIEW OF BEAUTIFUL TREES, OCCASSIONAL DEER
Key facts
- Cul-de-sac lot
- Scenic view
- Fenced backyard
Tags
Property features AI
Finance
- HOA & community: Near entertainment; Near sports fields
Exterior
- Parking: Attached garage; Attached carport; Covered parking; Gated parking lot; RV access/parking; Storage; Concrete surfaces; Total parking for 24 vehicles; 2 carport spaces
- Security: Security fence; Smoke detectors
- Utilities: Public water; Public sewer; Cable available and connected; Electricity connected; Natural gas connected; Sewer connected; Water connected
- Home design: Single-family house; One level; Fixer condition; Residential estate (suburban) zoning
- Construction: Brick construction; Architectural shingle roof; Slab foundation; Built area approximately 2,442 (per public records)
- Exterior features: Front porch; Wrap-around porch; Slab patio/porch; Private yard; Chain-link and security fencing; Back yard fence; Shed(s)
Interior
- Kitchen: Dishwasher; Disposal; Exhaust fan; Free-standing gas range; Tile countertops; Pantry; Eat-in kitchen
- Bedrooms: Large master with walk-in closet
- Flooring: Carpet; Ceramic tile; Laminate; Wood
- Bathrooms: 2 full bathrooms; 1 half bathroom (2.5 total)
- Heating & cooling: Hot water heating; Central air; Ceiling fans
- Interior features: Bar; Beamed ceilings; Built-in features; Cathedral ceilings; Ceiling fans; Double vanity; Eat-in kitchen; Entrance foyer; High ceilings; Pantry; Tile counters; Walk-in closet(s); Wired for sound; Blinds and window treatments; Insulated windows; Dead bolt locks; Sliding doors
- Laundry & utility: Separate laundry room; Washer hookup; Electric dryer hookup; Water heater
Neighborhood map
What this means for you Summary
Snapshot
- This is a 4-bed/2.5-bath single-family listed at $150k.
Deal economics
- At list price, monthly cash flow is $391 ($5k/yr) — positive.
- The deal already cash-flows at list — no discount required.
- Meets the 1% rule at list price ($2k rent vs $150k).
- Recommended offer: $148k (1.5% below list) — sets the bar for market timing.
- Cap rate 12.8% vs local median 9.9% in Jackson — meaningfully above typical; check what's discounted (condition, days-on-market, listing class) to confirm the premium yield is real.
Location & tenants
- Location reads 68/100 on livability (#66 in MS) — a middle-class / working-renter tenant base. Strengths: commute A+, cost of living A+, housing A+; Watch: amenities F, employment F, health & safety F.
- Jackson Public School District (urban): math 9% / reading 18% proficiency, ranked #112 of 130 in MS (top 86%) — low school quality limits family demand, transient renter base, plan for 1-2y turnover; 88% free/reduced lunch — lower-income household profile, screen leases tightly.
- Zoned schools: Murrah High School (math 12% / reading 27%, grade F, #130 of 197 statewide, top 68%, 1,326 students, 100% FRL).
- Market conditions: Rents rising fast (+7.9%/yr); 221 active listings in the ZIP; 6 comparable units currently listed for rent nearby; rentals at typical pace (median 23d on market — plan ~3-4 weeks tenant-placement turnaround); 167 units permitted in Hinds County in 2024 (0 in 5+ unit buildings).
- This rent runs 38% of the median local income ($69k/yr) — at the standard rent-burdened threshold; future hikes will face affordability resistance.
Forward outlook
- Local home prices are declining (-3.0%/yr); year-one equity from $1k of loan paydown is wiped out by about $4k of value loss. Plan a longer hold.
- Hinds County population projected to shrink 6% by 2050 — rents likely to lag national; underwrite the cash flow, not the appreciation.
- At projected returns (-3.0% appreciation + 7.9% rent growth), your $42k cash investment doubles in ~7 years — after that, you're playing with house money.
Negotiation context
- It's been on market 18 days — a 2% lower offer ($148k) is reasonable based on typical stale-listing flexibility.
Risks & watch-outs
- Watch-outs: flood insurance adds $427/mo.
- Climate carrying-cost: in FEMA flood zone AE (mandatory federal flood insurance); major wind risk, 78% chance of damaging wind over 30y; extreme-heat days projected 7→20/yr by 2055 (HVAC capex compounding) — expect insurance premiums to compound above CPI over the hold.
Questions for the listing agent
- Built in 1974 — when were the roof, HVAC, electrical panel, plumbing, and water heater last replaced?
- What's the actual annual flood-insurance premium (NFIP or private), and is the property in a SFHA with mandatory coverage?
- Is there a deadline driving the sale (1031 exchange, divorce, estate, relocation)? That informs how much negotiation room exists.
- Schools are F-rated, which usually means shorter tenancies and higher turnover. Who's the typical renter profile here, and what's been the actual vacancy rate?
- What's the average days-on-market for RENTAL listings here right now (not sales)? A rising rental-DOM trend means longer vacancies and softer asking-rent achievability than the comps imply.
- What's the recent tenant-quality profile in this submarket — average credit score on applications, eviction rate, late-payment / NSF rate, and stable-employment percentage? A property-management company in the area should have these aggregated.
- How much new for-sale + rental construction is in the pipeline within 1–3 miles? Heavy new supply typically softens prices + rents 12–24 months out; constrained supply supports both.
Investment metrics
- 1% rule
- 1.48% ✓
- Cap rate
- 12.84%
- Cash-on-cash
- 23.38%
- DSCR
- 2.04
- GRM
- 5.6
CMA / ARV
- ARV (median comp)
- $217,015
- List price
- $149,900
- Delta
- -30.93%
- Verdict
- UNDERPRICED
- Comps
- 20 within 1.0 mi
Show comp detail 12 sales within ~0.75 mi
| Address | Dist | Beds/Ba | Sqft | Sold | Price | $/sf | Match |
|---|---|---|---|---|---|---|---|
| 5320 Meadow Oaks Pk Dr | 0.45mi | 4/2.0 | 2,314 (-1%) | 3mo | $223,000 | $96 | 73 |
| 5130 Sunnyvale Dr | 0.19mi | 4/2.5 | 2,154 (-8%) | 7mo | $205,900 | $96 | 73 |
| 2317 E Northside Dr | 0.58mi | 4/2.0 | 2,319 (-0%) | 1mo | $363,900 | $157 | 69 |
| 318 Rollingwood Dr | 0.57mi | 4/2.5 | 2,391 (+3%) | 3mo | $275,000 | $115 | 67 |
| 144 Rollingwood Dr | 0.47mi | 3/2.0 (-1) | 2,380 (+2%) | 1mo | $294,000 | $124 | 66 |
| 125 Poinciana Dr | 0.40mi | 3/2.5 (-1) | 2,497 (+7%) | 0mo | $322,500 | $129 | 64 |
| 2245 N Cheryl Dr | 0.40mi | 4/3.0 | 2,526 (+8%) | 2mo | $369,900 | $146 | 64 |
| 5165 Shirlwood Dr | 0.31mi | 5/2.5 (+1) | 2,588 (+11%) | 0mo | $160,000 | $62 | 62 |
| 5525 Meadow Oaks Park Dr | 0.51mi | 4/2.5 | 2,476 (+6%) | 9mo | $249,900 | $101 | 59 |
| 5172 Kaywood Cir | 0.70mi | 4/2.5 | 2,255 (-3%) | 6mo | $214,900 | $95 | 57 |
| 5347 Reddoch Dr | 0.68mi | 4/2.0 | 2,234 (-4%) | 4mo | $249,000 | $111 | 56 |
| 5255 Parkway Dr | 0.69mi | 5/3.0 (+1) | 2,165 (-7%) | 4mo | $179,900 | $83 | 46 |
Match score weights: distance 35% · size 25% · config 20% · recency 20%. Top-matched comps best support the ARV.
Projected returns pro-forma
-3.0% appreciation · 7.9% rent growth · sell at horizon
- IRR
- 7.0%
- Equity multiple
- 1.29×
- Total profit
- $12,323
- Equity at exit
- $22,351
- IRR
- 21.0%
- Equity multiple
- 3.28×
- Total profit
- $95,860
- Equity at exit
- $12,961
Cash invested: $41,972 (down + closing). Projections, not guarantees.
Landlord ↔ Tenant lean methodology
- Overall (STATE)
- 90 Strongly Landlord-Friendly
- State Mississippi
- 90 Strongly Landlord-Friendly · R+11
- County
- — inherits STATE
- City
- — inherits STATE
ZIP-level market 39211
- Rents YoY
- 7.9%
- Active inventory
- 221
- Price-to-rent
- 5.6×
Monthly cashflow live
- Estimated rent
- $2,218 high interval (Pro) →
- Mortgage (P&I)
- −$786
- Tax from tax record
- −$86 /mo · $1,029/yr
- Insurance
- −$62
- Flood insurance flood zone
- −$427 /mo · $5,118/yr
- HOA
- −$0
- Vacancy / Maint / Mgmt
- −$466
- Net cashflow
- $391
Break-even live
UW: 25.0% down · 7.5% · 30yr · 1.5% tax · 5.0% vac · 8.0% maint · 8.0% mgmt
Financing live
Cash to close
- Down payment
- $37,475
- Closing costs
- $4,497
- Reserves months
- —
- Total cash needed
- —
Loan-product check · same deal, 3 products live
Conventional
25% down · 7.5% · 30yr
- Down + closing
- —
- Monthly P&I
- —
- Monthly cashflow
- —
- DSCR
- —
- Eligible?
- —
Personal DTI + credit; lowest rate.
DSCR
20% down · 8.5% · 30yr
- Down + closing
- —
- Monthly P&I
- —
- Monthly cashflow
- —
- DSCR
- —
- Eligible?
- —
No personal income docs; deal must DSCR.
Hard money
10% down · 12.0% · 12mo
- Down + closing
- —
- Monthly P&I
- —
- Monthly cashflow
- —
- DSCR
- —
- Eligible?
- —
Short-term bridge; refi at stabilization.
Rent comps 6 comps
| Address | Beds | Baths | Sqft | Rent | $/sqft | DOM | Units | Dist |
|---|---|---|---|---|---|---|---|---|
| 1046 Newland St Jackson, MS | 4.0 | 2.5 | 2700 | $3,200 | $1.19 | 23d | 1 | 0.69mi |
| 5125 Old Canton Rd Jackson, MS | 3.0 | 3.0 | 2025 | $2,100 | $1.04 | 23d | 1 | 0.81mi |
| 212 Pimlico Pl Jackson, MS | 3.0 | 2.0 | 1600 | $900 | $0.56 | 13d | 1 | 1.06mi |
| 5855 Canton Park Dr Jackson, MS | 4.0 | 2.0 | 1955 | $1,675 | $0.86 | 23d | 1 | 1.13mi |
| 5855 Canton Park Dr Jackson, MS | 4.0 | 2.0 | 2401 | $1,675 | $0.70 | 13d | 1 | 1.13mi |
| 4750 Old Canton Rd Jackson, MS | 4.0 | 3.0 | 2085 | $2,200 | $1.06 | 23d | 1 | 1.26mi |
Listing history 5 events
-
2026-05-18status Pending 398-char remark
-
2026-05-15price $149,900 398-char remark
-
2026-04-28$185,000 Active 398-char remark
-
1994-09-29soldstatus
-
1988-06-23soldstatus
ⓘ Source: listings_history table (triggers on properties + properties_extension) + one-shot
backfill from property_details.listing_events for pre-trigger history.
Tax reassessment forecast MS · Resets to sale price
- Current annual tax
- $1,029 · $86/mo
- Projected year-2 tax
- $1,184 · $99/mo
- Expected delta
- +$156/yr (+$13/mo · 15.1%)
ⓘ Screening estimate from a state-policy table — verify with the county assessor before closing.
Climate risk First Street
- Flood 1/10 Low FEMA zone AE · 0% chance over 30 yrs
- Wildfire 1/10 Low
- Heat 7/10 Severe 7 d/yr ≥108°F today · 20 d/yr by 30 yrs out
- Wind 7/10 Severe 78% chance of damaging wind over 30 yrs
- Air quality 2/10 Low 0 unhealthy d/yr today · 1 by 30 yrs out
Nearby sold comps map
Loading sold comps map…
Walkable amenities ~0.75 mi
Loading nearby amenities…
Taxation est. · year 1
- Rental income
- $26,611
- − Mortgage interest
- −$8,397
- − Property taxes
- −$1,029
- − Insurance
- −$5,868
- − Repairs & maintenance
- −$2,129
- − Management
- −$2,129
- − Depreciation
- −$4,361
- Taxable income
- $2,699
- Est. tax owed @ 24.0%
- −$648
- After-tax cash flow
- $4,045/yr
For passive investors: Depreciation is non-cash, so a rental often shows a tax loss while cash-flowing — sheltering income. Rental losses are passive: they offset passive income freely, and up to $25,000/yr can offset ordinary (W-2) income if you actively participate and your MAGI is under $100k (phasing out to $0 by $150k); unused losses carry forward. On sale, claimed depreciation is recaptured at up to 25%, and gains may owe capital-gains tax (a 1031 exchange can defer both). Figures are a year-1 estimate at your 24.0% rate — not tax advice; consult a CPA.
Schools (NCES district)
- District
- Jackson Public School District
- NCES district ID
- 2802190
- Math proficiency
- 9% ▼ -14.00%
- Reading proficiency
- 18% ▼ -7.00%
- Median HH income
- $33,234
- Composite
- 10.89/100
- National rank
- #9755
- State rank
- #112 of 130 in MS
Livability — Jackson
- Score
- 68/100
- State rank
- #66
- US rank
- #9695
Category grades
Schools grade is shown separately in the Schools card above.
Census & demographics
- Census place
- Jackson, MS
- County
- Hinds County · 167,040 people
- City population
- 140,204
- Metro
- Jackson, MS
- Population (ZIP)
- 23,838
- Household income
- $69,426
- Rent vs Own
- Severe rent burden
- 736.0
Population outlook (Hinds County) Hauer SSP2
- Today (2025)
- 242,528 people
- By 2030
- 241,113 · -0.6%
- By 2040
- 235,557 · -2.9%
- By 2050
- 226,946 · -6.4%
- By 2075
- 199,995 · -17.5%
- By 2100
- 164,165 · -32.3%
Race, ethnicity, and origin ACS 2023
- Neighborhood character
- Majority Black (59%)
- Race & ethnicity
- Black 59% White 36% Hispanic / Latino 3% Two or more races 2%
- Common ancestry
- Serbian 2% Italian 2% Slovak 1%
- Foreign-born
- 2% · Canada, China
- Languages at home
- 96% English-only · Spanish 3% Chinese 1%
Political lean MEDSL · Hinds
- 2024 margin
- Solid D (+46.1) · D 72.4% · R 26.3% · Other 1.4%
- 2008→2024 swing
- +7.1pp toward D · 2008: 39.0pp · 2024: 46.1pp
- All cycles
- 2024: D+46.1 2020: D+48.3 2016: D+43.7 2012: D+45.1 2008: D+39.0
Not yet ingested
- Civics
- —
Market trends
- HPI YoY
- ▼ -135.99%
- Current HPI
- 145.5192
- Rent YoY
- ▲ 7.90%
- Metro
- Jackson, MS
- State GDP YoY
- —
- F500 in state
- 0
Price history
-19.0% since first listed5 events — show timeline
- 2026-05-18 Pending — MLSU
- 2026-05-15 Price Changed $149,900 MLSU
- 2026-04-28 Listed $185,000 MLSU
- 1994-09-29 Sold (Public Records) — Public Records
- 1988-06-23 Sold (Public Records) — Public Records
Property tax history
+1.7%/yrLatest (2025): $1,029 · +5.5% YoY. Source: county tax records.
Cash-flow waterfall
monthlySold comps — $/sqft
last 12 mo · ≤1 miLoading sold comps…