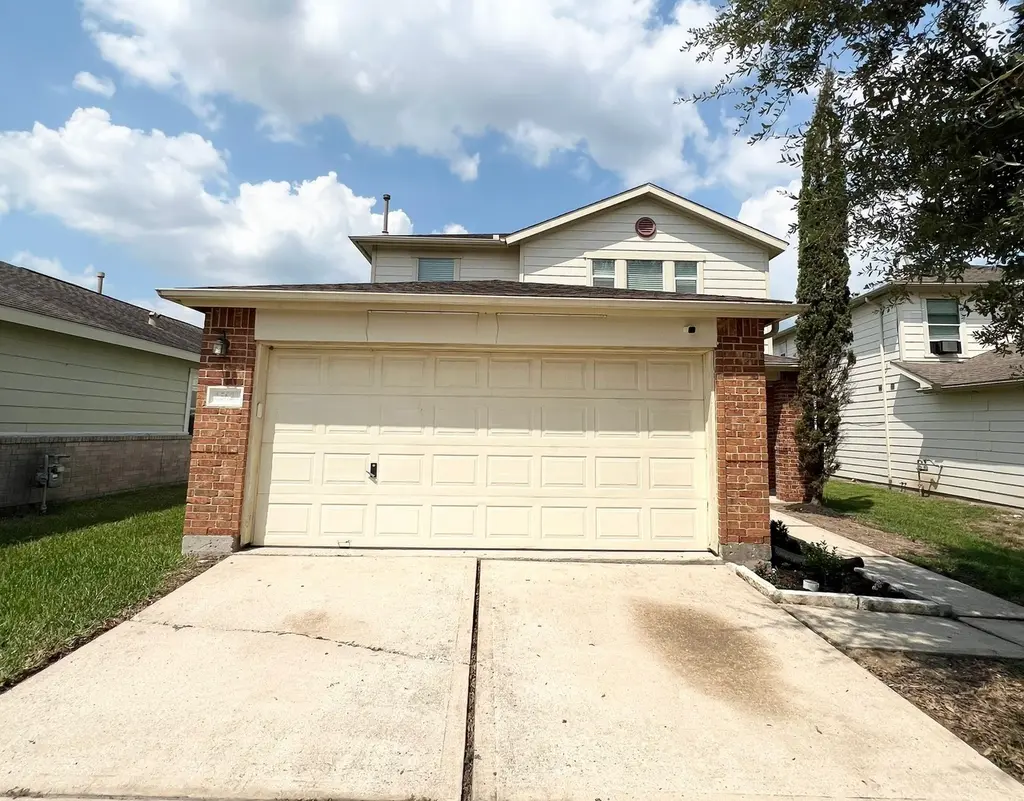
15623 Red Pine Ridge Way · Houston, TX
Flood risk 1/10 · Minimal
- FEMA flood zone
- X (shaded)
- Chance of flooding over 30 yrs
- 0.0%
- Est. flood insurance / yr
- $507 – $1,088
Fire risk 5/10 · Moderate
- Est. fire insurance / yr
- $1,222 – $2,270
Heat risk 9/10 · Severe
- Hot days now (above 109°F)
- 7 days/yr
- Hot days in 30 yrs
- 25 days/yr
Wind risk 9/10 · Severe
- Chance of severe wind over 30 yrs
- 99.0%
Air-quality risk 2/10 · Minimal
- Unhealthy air days now
- 2 days/yr
- Unhealthy air days in 30 yrs
- 2 days/yr
Risk factors via First Street. Map © Google.
Why this score? — see what drove the F grade
The composite is a weighted blend of 9 inputs, each scored 0–100. Each bar is that input's sub-score; the figure is the points it added to the 100-point composite (weight × sub-score).
- Cash flow +8.0/30.0
- ARV discount +7.0/15.0
- Appreciation +4.4/10.0
- 1% rule +3.8/10.0
- Livability +3.7/5.0
- Condition / age +2.5/5.0
- DSCR +2.0/10.0
- Schools +2.0/10.0
- Rent growth +1.7/5.0
$264,900
🖨 Deal sheet 📄 Offer letter ✓ Due diligence
Listing remarks MLS
This 4 Bedroom home sits in the quiet and well maintained community of Liberty Lakes. Located near major banks, credit unions, Wal-Mart, Kroger, Best Buy, Marshall, Lowes, Starbucks, Pet Smart and much more. Home has Master Bedroom on 1st floor, 3 Bedrooms and XL game room up. Security system w CAMERA's will remain. Homeowners have convenient access to Gene Green(GOLD Park). Where you can enjoy walking trails, the water park, tennis & basketball courts, baseball, skate boarding & dog parks.
Key facts
- Walking trails
- 4,207 sq ft lot
- 2 garage spots
Tags
Property features AI
Finance
- Other: Tax information not included per instructions
- Financial info: Lease not considered
- HOA & community: Association managed by VanMor Properties, Inc.; Association fee $420 annually
Exterior
- Parking: Attached garage with 2 parking spaces
- Security: Security details not provided
- Utilities: Public water; Public sewer
- Home design: Residential property; Full ownership; Built in 2005; Entry level not specified; Facing direction not specified
- Construction: Brick construction; Composition roof; Slab foundation
- Exterior features: Subdivision lot; Lot approximately 4,208 square feet
Interior
- Kitchen: Kitchen details not provided
- Bedrooms: Bedrooms not specified
- Flooring: Flooring details not provided
- Bathrooms: 2 full bathrooms; 1 half bathroom
- Heating & cooling: Central heating (gas); Central electric air conditioning
- Interior features: 7 total rooms; Seller disclosure available
- Laundry & utility: Laundry details not provided
Neighborhood map
What this means for you Summary
Snapshot
- This is a 3-bed/2.5-bath single-family listed at $265k.
Deal economics
- At list price, monthly cash flow is $-275 ($-3k/yr) — negative.
- To cash-flow at today's rent, offer at most $216k (18.3% below list).
- To meet the 1% rule (rent ≥ 1% of price), the offer needs to be $233k (12.2% below list).
- Recommended offer: $216k (18.3% below list) — sets the bar for cash-flow.
- Cap rate 5.0% vs local median 3.2% in Houston — top-decile yield for the area; either an underpriced asset or a hidden risk that comps aren't pricing in. Stress-test before assuming the spread holds.
Location & tenants
- Location reads 74/100 on livability (#184 in TX, #4,771 nationally) — a middle-class / working-renter tenant base. Strengths: amenities A+, cost of living A+, housing A+; Watch: crime F.
- Sheldon ISD (suburban): math 19% / reading 25% proficiency, ranked #746 of 826 in TX (top 90%) — low school quality limits family demand, transient renter base, plan for 1-2y turnover; 72% free/reduced lunch — lower-income household profile, screen leases tightly.
- Zoned schools: Michael R Null Middle (math 15% / reading 23%, grade F, #1,466 of 1,662 statewide, top 89%, 1,164 students, 89% FRL) — zoned schools average 89% FRL vs 72% district-wide (17 pts higher); higher-poverty schools than district average — tighter screening recommended.
- Market conditions: Rents falling (-3.3%/yr); 157 active listings in the ZIP; 3 comparable units currently listed for rent nearby; rentals lingering (median 44d on market — plan ~5-8 weeks vacancy on turnover, expect pricing pressure); 67% of comp listings sitting > 30 days — soft ceiling on asking rent; 29,883 units permitted in Harris County in 2024 (8,621 in 5+ unit buildings).
- This rent runs 44% of the median local income ($63k/yr) — at the standard rent-burdened threshold; future hikes will face affordability resistance.
Forward outlook
- Local home prices are declining (-1.2%/yr); year-one equity from $2k of loan paydown is wiped out by about $3k of value loss. Plan a longer hold.
- Harris County population projected at +47% by 2050 — long-run rental-demand tailwind backs the buy-and-hold thesis.
Negotiation context
- Only 8 days on market — expect competitive offers; lowballing is unlikely to land.
- 5 sale attempts since 15y ago with the ask held roughly flat each time — persistent listings suggest the price (not the market) is what's stuck; bring a comps-based counter.
Risks & watch-outs
- Watch-outs: property tax is 2.6% of price.
- Climate carrying-cost: severe wind risk, 99% chance of damaging wind over 30y; moderate wildfire risk; extreme-heat days projected 7→25/yr by 2055 (HVAC capex compounding) — expect insurance premiums to compound above CPI over the hold.
Questions for the listing agent
- What do current leases actually rent for vs. the listed asking? Can we see a recent rent roll and the last 12 months of T-12 income?
- Property tax is high relative to price — has the assessment been appealed recently, and will the sale trigger a re-assessment?
- What does the HOA fee cover, when was the last increase, and are there any pending special assessments or reserve-fund shortfalls?
- Is there a deadline driving the sale (1031 exchange, divorce, estate, relocation)? That informs how much negotiation room exists.
- Schools are D-rated, which usually means shorter tenancies and higher turnover. Who's the typical renter profile here, and what's been the actual vacancy rate?
- Crime grade is F in this area — have there been break-ins, vandalism, or insurance claims at this property in the last 3 years? What carrier currently insures it and at what premium?
- The area grade is low — what's the realistic commute time and amenity access for the typical tenant pool here? Any planned neighborhood developments (good or bad) we should know about?
- What's the average days-on-market for RENTAL listings here right now (not sales)? A rising rental-DOM trend means longer vacancies and softer asking-rent achievability than the comps imply.
- What's the recent tenant-quality profile in this submarket — average credit score on applications, eviction rate, late-payment / NSF rate, and stable-employment percentage? A property-management company in the area should have these aggregated.
- How much new for-sale + rental construction is in the pipeline within 1–3 miles? Heavy new supply typically softens prices + rents 12–24 months out; constrained supply supports both.
Investment metrics
- 1% rule
- 0.88% ✗
- Cap rate
- 5.05%
- Cash-on-cash
- -4.45%
- DSCR
- 0.80
- GRM
- 9.5
CMA / ARV
- ARV (on-the-fly)
- $261,826
- Comps found
- 12
Show comp detail 12 sales within ~0.75 mi
| Address | Dist | Beds/Ba | Sqft | Sold | Price | $/sf | Match |
|---|---|---|---|---|---|---|---|
| 6802 Oleander Grove Way | 0.03mi | 4/2.5 (+1) | 2,495 (-2%) | 14mo | $279,900 | $112 | 79 |
| 6723 Green Pear Ln | 0.06mi | 4/2.0 (+1) | 2,669 (+5%) | 6mo | $309,900 | $116 | 77 |
| 15543 Liberty Cypress Ct | 0.24mi | 3/2.5 | 2,466 (-3%) | 15mo | $244,000 | $99 | 72 |
| 6551 Providence View Ln | 0.18mi | 4/2.5 (+1) | 2,658 (+5%) | 13mo | $200,000 | $75 | 68 |
| 15503 Broken Cypress Cir | 0.10mi | 3/2.5 | 2,210 (-13%) | 6mo | $200,000 | $90 | 68 |
| 7247 Liberty Mesa Ln | 0.61mi | 4/2.5 (+1) | 2,472 (-3%) | 3mo | $255,000 | $103 | 59 |
| 7255 Liberty Mesa Ln | 0.62mi | 3/2.5 | 2,460 (-3%) | 9mo | $255,000 | $104 | 58 |
| 7106 Liberty Creek Trl | 0.42mi | 4/2.5 (+1) | 2,801 (+10%) | 2mo | $290,000 | $104 | 57 |
| 7130 Hollow Cedar Dr | 0.46mi | 4/2.5 (+1) | 2,260 (-11%) | 3mo | $265,000 | $117 | 52 |
| 15607 Granite Mountain Trl | 0.71mi | 4/2.5 (+1) | 2,698 (+6%) | 1mo | $265,000 | $98 | 51 |
| 7015 Falling Cherry Pl | 0.30mi | 4/2.5 (+1) | 2,901 (+14%) | 13mo | $228,900 | $79 | 47 |
| 6614 Surrey Meadow Ct | 0.44mi | 4/2.5 (+1) | 2,815 (+11%) | 12mo | $272,000 | $97 | 46 |
Match score weights: distance 35% · size 25% · config 20% · recency 20%. Top-matched comps best support the ARV.
Projected returns pro-forma
-1.2% appreciation · 0.0% rent growth · sell at horizon
- IRR
- -15.3%
- Equity multiple
- 0.37×
- Total profit
- $-46,494
- Equity at exit
- $61,358
- IRR
- -12.0%
- Equity multiple
- 0.06×
- Total profit
- $-69,430
- Equity at exit
- $62,252
Cash invested: $74,172 (down + closing). Projections, not guarantees.
Landlord ↔ Tenant lean methodology
- Overall (STATE)
- 87 Strongly Landlord-Friendly
- State Texas
- 87 Strongly Landlord-Friendly · R+5
- County
- — inherits STATE
- City
- — inherits STATE
ZIP-level market 77049
- Home prices YoY
- -0.5%
- Rents YoY
- -3.3%
- Active inventory
- 157
- Price-to-rent
- 9.5×
Monthly cashflow live
- Estimated rent
- $2,325 medium interval (Pro) →
- Mortgage (P&I)
- −$1,389
- Tax from tax record
- −$577 /mo · $6,928/yr
- Insurance
- −$110
- HOA
- −$35
- Vacancy / Maint / Mgmt
- −$488
- Net cashflow
- $-275
Break-even live
UW: 25.0% down · 7.5% · 30yr · 1.5% tax · 5.0% vac · 8.0% maint · 8.0% mgmt
Financing live
Cash to close
- Down payment
- $66,225
- Closing costs
- $7,947
- Reserves months
- —
- Total cash needed
- —
Loan-product check · same deal, 3 products live
Conventional
25% down · 7.5% · 30yr
- Down + closing
- —
- Monthly P&I
- —
- Monthly cashflow
- —
- DSCR
- —
- Eligible?
- —
Personal DTI + credit; lowest rate.
DSCR
20% down · 8.5% · 30yr
- Down + closing
- —
- Monthly P&I
- —
- Monthly cashflow
- —
- DSCR
- —
- Eligible?
- —
No personal income docs; deal must DSCR.
Hard money
10% down · 12.0% · 12mo
- Down + closing
- —
- Monthly P&I
- —
- Monthly cashflow
- —
- DSCR
- —
- Eligible?
- —
Short-term bridge; refi at stabilization.
Rent comps 3 comps
| Address | Beds | Baths | Sqft | Rent | $/sqft | DOM | Units | Dist |
|---|---|---|---|---|---|---|---|---|
| 15522 Noble Brook Ct Houston, TX | 4.0 | 3.5 | 3194 | $2,575 | $0.81 | 3d | 1 | 0.10mi |
| 7934 Round Rock Dr Houston, TX | 3.0 | 2.0 | 1986 | $2,100 | $1.06 | 44d | 1 | 1.14mi |
| 14718 Black Rail Dr Houston, TX | 4.0 | 3.0 | 2150 | $2,900 | $1.35 | 44d | 1 | 1.45mi |
HOA detail
- Monthly dues
- $35 · $420/yr
- Likely covers
- watersecurity
Listing history 6 events
-
2026-06-18days on market $264,900 Active 8 DOM
-
2026-06-17days on market $264,900 Active 7 DOM
-
2026-06-16days on market $264,900 Active 6 DOM
-
2026-06-15days on market $264,900 Active 5 DOM
-
2026-06-13remarks 394-char remark
-
2026-06-13$264,900 Active 3 DOM
ⓘ Source: listings_history table (triggers on properties + properties_extension) + one-shot
backfill from property_details.listing_events for pre-trigger history.
Tax reassessment forecast TX · Resets to sale price
- Current annual tax
- $6,928 · $577/mo
- Projected year-2 tax
- $6,928 · $577/mo
- Expected delta
- $0/yr ($0/mo · 0.0%)
ⓘ Screening estimate from a state-policy table — verify with the county assessor before closing.
Climate risk First Street
- Flood 1/10 Low FEMA zone X (shaded) · 0% chance over 30 yrs
- Wildfire 5/10 Major
- Heat 9/10 Extreme 7 d/yr ≥109°F today · 25 d/yr by 30 yrs out
- Wind 9/10 Extreme 99% chance of damaging wind over 30 yrs
- Air quality 2/10 Low 2 unhealthy d/yr today · 2 by 30 yrs out
Nearby sold comps map
Loading sold comps map…
Walkable amenities ~0.75 mi
Loading nearby amenities…
Taxation est. · year 1
- Rental income
- $27,903
- − Mortgage interest
- −$14,839
- − Property taxes
- −$6,928
- − Insurance
- −$1,324
- − Repairs & maintenance
- −$2,232
- − Management
- −$2,232
- − HOA
- −$420
- − Depreciation
- −$7,706
- Taxable loss
- −$7,779
- Est. tax savings @ 24.0%
- +$1,867
- After-tax cash flow
- $-1,432/yr
For passive investors: Depreciation is non-cash, so a rental often shows a tax loss while cash-flowing — sheltering income. Rental losses are passive: they offset passive income freely, and up to $25,000/yr can offset ordinary (W-2) income if you actively participate and your MAGI is under $100k (phasing out to $0 by $150k); unused losses carry forward. On sale, claimed depreciation is recaptured at up to 25%, and gains may owe capital-gains tax (a 1031 exchange can defer both). Figures are a year-1 estimate at your 24.0% rate — not tax advice; consult a CPA.
Schools (NCES district)
- District
- Sheldon ISD
- NCES district ID
- 4839990
- Math proficiency
- 19% ▼ -18.00%
- Reading proficiency
- 25% ▼ -10.00%
- Median HH income
- $49,443
- Composite
- 19.5/100
- National rank
- #8772
- State rank
- #746 of 826 in TX
Livability — Houston
- Score
- 74/100
- State rank
- #184
- US rank
- #4771
Category grades
Schools grade is shown separately in the Schools card above.
Census & demographics
- County
- Harris County · 4,702,590 people
- City population
- 3,226,434
- Metro
- Houston-The Woodlands-Sugar Land, TX
- Population (ZIP)
- 40,418
- Household income
- $62,971
- Rent vs Own
- Severe rent burden
- 993.0
Population outlook (Harris County) Hauer SSP2
- Today (2025)
- 5,571,493 people
- By 2030
- 6,089,821 · +9.3%
- By 2040
- 7,142,806 · +28.2%
- By 2050
- 8,185,864 · +46.9%
- By 2075
- 10,574,329 · +89.8%
- By 2100
- 12,109,958 · +117.4%
Race, ethnicity, and origin ACS 2023
- Neighborhood character
- Predominantly Hispanic (66%)
- Race & ethnicity
- Hispanic / Latino 66% Two or more races 32% Black 19% White 10% Asian 3%
- Hispanic origin (detail)
- Mexican 55%
- Common ancestry
- Lithuanian 1%
- Foreign-born
- 26% · Canada, China, Vietnam
- Languages at home
- 43% English-only · Spanish 54% Other Asian/Pacific 1% Chinese 1%
Political lean MEDSL · Harris
- 2024 margin
- Lean D (+5.5) · D 52.0% · R 46.4% · Other 1.6%
- 2008→2024 swing
- +3.9pp toward D · 2008: 1.6pp · 2024: 5.5pp
- All cycles
- 2024: D+5.5 2020: D+13.3 2016: D+12.4 2012: D+0.1 2008: D+1.6
Not yet ingested
- Civics
- —
Market trends
- HPI YoY
- ▼ -1.20%
- Current HPI
- 248.1111
- Rent YoY
- ▼ -3.31%
- Metro
- Houston-The Woodlands-Sugar Land, TX
- State GDP YoY
- ▲ 3.95%
- F500 in state
- 110
Industry mix (Fortune 500 HQ in TX)
| Industry | F500 HQs | Revenue |
|---|---|---|
| Energy | 16 | $1,198B |
|
||
| Technology | 5 | $198B |
|
||
| Engineering / Construction | 4 | $72B |
|
||
| Energy Services | 3 | $60B |
|
||
| Utilities | 3 | $41B |
|
||
| Healthcare | 2 | $330B |
|
||
Price history
+165.2% since first listed19 events — show timeline
- 2026-06-10 Listed $264,900 HARMLS
- 2025-04-19 Listing Removed — HARMLS
- 2025-02-04 Price Changed $264,900 HARMLS
- 2024-09-19 Listed $279,000 HARMLS
- 2023-06-21 Rental Removed — HARMLS
- 2014-03-05 Sold (Public Records) — Public Records
- 2014-03-04 Sold (MLS) — HARMLS
- 2014-02-17 Pending — HARMLS
- 2014-01-18 Pending — HARMLS
- 2014-01-08 Pending — HARMLS
- 2013-12-17 Relisted — HARMLS
- 2013-12-17 Listing Removed — HARMLS
- 2013-10-28 Price Changed $126,500 HARMLS
- 2013-10-21 Listed $132,900 HARMLS
- 2012-01-03 Sold (Public Records) — Public Records
- 2011-12-30 Sold (MLS) — HARMLS
- 2011-11-29 Listing Removed — HARMLS
- 2011-08-20 Listed $99,900 HARMLS
- 2007-10-31 Sold (Public Records) — Public Records
Property tax history
+7.0%/yrLatest (2025): $6,928 · -0.0% YoY. Source: county tax records.
Cash-flow waterfall
monthlySold comps — $/sqft
last 12 mo · ≤1 miLoading sold comps…