2741 Illinois Canyon Rd · Georgetown, CA
Flood risk 1/10 · Minimal
- FEMA flood zone
- X (unshaded)
- Chance of flooding over 30 yrs
- 0.0%
- Est. flood insurance / yr
- $507 – $1,088
Fire risk 9/10 · Severe
- Est. fire insurance / yr
- $659 – $1,223
Heat risk 5/10 · Moderate
- Hot days now (above 97°F)
- 7 days/yr
- Hot days in 30 yrs
- 16 days/yr
Wind risk 1/10 · Minimal
- Chance of severe wind over 30 yrs
- —
Air-quality risk 9/10 · Severe
- Unhealthy air days now
- 20 days/yr
- Unhealthy air days in 30 yrs
- 28 days/yr
Risk factors via First Street. Map © Google.
Why this score? — see what drove the B grade
The composite is a weighted blend of 9 inputs, each scored 0–100. Each bar is that input's sub-score; the figure is the points it added to the 100-point composite (weight × sub-score).
- Cash flow +30.0/30.0
- 1% rule +10.0/10.0
- DSCR +10.0/10.0
- ARV discount +7.5/15.0
- Appreciation +6.2/10.0
- Schools +3.0/10.0
- Livability +2.9/5.0
- Rent growth +2.5/5.0
- Condition / age +2.5/5.0
$89,000
🖨 Deal sheet 📄 Offer letter ✓ Due diligence
Listing remarks MLS
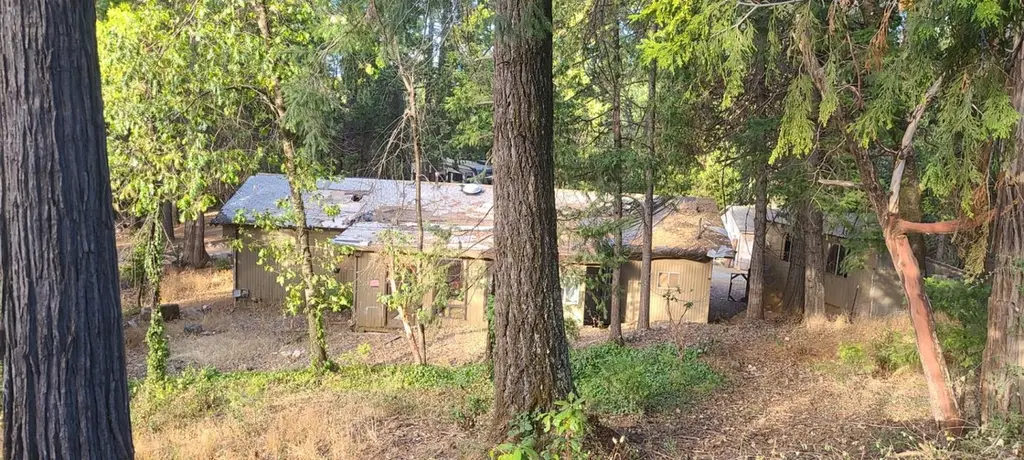
Amazing opportunity to own 4 acres Located minutes from downtown Georgetown. Manufactured home caught fire a few years ago. The garage and other structures weren't effected by the fire. Don't let what you can't do get in the way of what you can.
Key facts
- Garage
- Other structures
- 4 acres
Tags
Property features AI
Finance
- Other: Living area approximately 2,270; Second unit described as manufactured; Property is incorporated
- Financial info: City transfer tax applies
Exterior
- Parking: Detached garage (2 car); Common parking area; Approximately 20 parking spaces
- Utilities: Public water; Existing septic; Propane on site; Public utilities available (not on site)
- Home design: R2A zoning
- Construction: Other construction type; Other foundation
- Exterior features: Composition roof; Property listed as a fixer upper; Horse property possible
Interior
- Bedrooms: 2 bedrooms
- Bathrooms: 2 full bathrooms
- Heating & cooling: Other heating (see remarks)
- Interior features: Family room (other — see remarks); Dining room (other — see remarks)
Neighborhood map
What this means for you Summary
Snapshot
- This is a 2-bed/2.0-bath manufactured listed at $89k.
Deal economics
- At list price, monthly cash flow is $485 ($6k/yr) — positive.
- The deal already cash-flows at list — no discount required.
- Meets the 1% rule at list price ($2k rent vs $89k).
- Recommended offer: $88k (1.5% below list) — sets the bar for market timing.
- Cap rate 12.8% vs local median 2.1% in Georgetown — top-decile yield for the area; either an underpriced asset or a hidden risk that comps aren't pricing in. Stress-test before assuming the spread holds.
Location & tenants
- Location reads 57/100 on livability (#753 in CA) — a working-class tenant base; expect higher turnover. Strengths: housing A+, crime A-, employment B; Watch: amenities F, commute F, cost of living F.
- Black Oak Mine Unified (rural): math 25% / reading 40% proficiency, ranked #278 of 517 in CA (top 54%) — families likely to look elsewhere, expect single-tenant / working-renter base with shorter leases.
- Zoned schools: Georgetown Elementary (math 22% / reading 37%, grade F, #856 of 1,571 statewide, top 57%, 251 students, 46% FRL).
- Market conditions: 51 active listings in the ZIP; 437 units permitted in El Dorado County in 2024 (0 in 5+ unit buildings).
Forward outlook
- In year one you build about $3k of equity ($615 loan paydown + $2k appreciation (2.3% local appreciation)).
- El Dorado County population projected to shrink 3% by 2050 — rents likely to lag national; underwrite the cash flow, not the appreciation.
- At projected returns (2.3% appreciation + 3.0% rent growth), your $25k cash investment doubles in ~3 years — after that, you're playing with house money.
Negotiation context
- It's been on market 23 days — a 2% lower offer ($88k) is reasonable based on typical stale-listing flexibility.
- 3 sale attempts with the ask held roughly flat each time — persistent listings suggest the price (not the market) is what's stuck; bring a comps-based counter.
Risks & watch-outs
- Watch-outs: property tax is 3.3% of price.
- Climate carrying-cost: severe wildfire risk; extreme-heat days projected 7→16/yr by 2055 (HVAC capex compounding) — expect insurance premiums to compound above CPI over the hold.
Questions for the listing agent
- Built in 1968 — when were the roof, HVAC, electrical panel, plumbing, and water heater last replaced?
- Property tax is high relative to price — has the assessment been appealed recently, and will the sale trigger a re-assessment?
- Is there a deadline driving the sale (1031 exchange, divorce, estate, relocation)? That informs how much negotiation room exists.
- Schools are D-rated, which usually means shorter tenancies and higher turnover. Who's the typical renter profile here, and what's been the actual vacancy rate?
- What's the average days-on-market for RENTAL listings here right now (not sales)? A rising rental-DOM trend means longer vacancies and softer asking-rent achievability than the comps imply.
- What's the recent tenant-quality profile in this submarket — average credit score on applications, eviction rate, late-payment / NSF rate, and stable-employment percentage? A property-management company in the area should have these aggregated.
- How much new for-sale + rental construction is in the pipeline within 1–3 miles? Heavy new supply typically softens prices + rents 12–24 months out; constrained supply supports both.
Investment metrics
- 1% rule
- 1.76% ✓
- Cap rate
- 12.84%
- Cash-on-cash
- 23.37%
- DSCR
- 2.04
- GRM
- 4.7
CMA / ARV
No comps found within radius.
Projected returns pro-forma
2.33% appreciation · 3.0% rent growth · sell at horizon
- IRR
- 28.3%
- Equity multiple
- 2.55×
- Total profit
- $38,626
- Equity at exit
- $36,705
- IRR
- 29.5%
- Equity multiple
- 4.95×
- Total profit
- $98,326
- Equity at exit
- $54,115
Cash invested: $24,920 (down + closing). Projections, not guarantees.
Landlord ↔ Tenant lean methodology
- Overall (STATE)
- 18 Strongly Tenant-Friendly
- State California
- 18 Strongly Tenant-Friendly · D+13
- County
- — inherits STATE
- City
- — inherits STATE
ZIP-level market 95634
- Home prices YoY
- 0.9%
- Active inventory
- 51
- Price-to-rent
- 4.7×
Monthly cashflow live
- Estimated rent
- $1,564 medium interval (Pro) →
- Mortgage (P&I)
- −$467
- Tax from tax record
- −$247 /mo · $2,962/yr
- Insurance
- −$37
- HOA
- −$0
- Vacancy / Maint / Mgmt
- −$329
- Net cashflow
- $485
Break-even live
UW: 25.0% down · 7.5% · 30yr · 1.5% tax · 5.0% vac · 8.0% maint · 8.0% mgmt
Financing live
Cash to close
- Down payment
- $22,250
- Closing costs
- $2,670
- Reserves months
- —
- Total cash needed
- —
Loan-product check · same deal, 3 products live
Conventional
25% down · 7.5% · 30yr
- Down + closing
- —
- Monthly P&I
- —
- Monthly cashflow
- —
- DSCR
- —
- Eligible?
- —
Personal DTI + credit; lowest rate.
DSCR
20% down · 8.5% · 30yr
- Down + closing
- —
- Monthly P&I
- —
- Monthly cashflow
- —
- DSCR
- —
- Eligible?
- —
No personal income docs; deal must DSCR.
Hard money
10% down · 12.0% · 12mo
- Down + closing
- —
- Monthly P&I
- —
- Monthly cashflow
- —
- DSCR
- —
- Eligible?
- —
Short-term bridge; refi at stabilization.
Listing history 23 events
-
2026-06-18days on market $89,000 Active 23 DOM
-
2026-06-17days on market $89,000 Active 22 DOM
-
2026-06-16days on market $89,000 Active 21 DOM
-
2026-06-15days on market $89,000 Active 20 DOM
-
2026-06-13days on market $89,000 Active 18 DOM
-
2026-06-13remarks 380-char remark
-
2026-06-13days on market $89,000 Active 17 DOM
-
2026-06-09days on market $89,000 Active 14 DOM
-
2026-06-08days on market $89,000 Active 13 DOM
-
2026-06-07days on market $89,000 Active 12 DOM
-
2026-06-05days on market $89,000 Active 9 DOM
-
2026-06-03days on market $89,000 Active 8 DOM
-
2026-06-02days on market $89,000 Active 7 DOM
-
2026-06-02remarks 348-char remark
-
2026-06-01days on market $89,000 Active 6 DOM
-
2026-05-31remarks 334-char remark
-
2026-05-31days on market $89,000 Active 5 DOM
-
2026-05-26historical
Show marketing remark (245 chars)
Amazing opportunity to own 4 acres Located minutes from downtown Georgetown. Manufactured home caught fire a few years ago. The garage and other structures weren't effected by the fire. Don't let what you can't do get in the way of what you can.
-
2026-05-26$89,000 Active 245-char remark
Show marketing remark (245 chars)
Amazing opportunity to own 4 acres Located minutes from downtown Georgetown. Manufactured home caught fire a few years ago. The garage and other structures weren't effected by the fire. Don't let what you can't do get in the way of what you can.
-
2026-05-23Active
-
2013-05-29soldstatus $124,000
-
1992-09-30soldstatus $80,000
ⓘ Source: listings_history table (triggers on properties + properties_extension) + one-shot
backfill from property_details.listing_events for pre-trigger history.
Tax reassessment forecast CA · Resets to sale price
- Current annual tax
- $2,962 · $247/mo
- Projected year-2 tax
- $2,962 · $247/mo
- Expected delta
- $0/yr ($0/mo · 0.0%)
ⓘ Screening estimate from a state-policy table — verify with the county assessor before closing.
Climate risk First Street
- Flood 1/10 Low FEMA zone X (unshaded) · 0% chance over 30 yrs
- Wildfire 9/10 Extreme
- Heat 5/10 Major 7 d/yr ≥97°F today · 16 d/yr by 30 yrs out
- Wind 1/10 Low
- Air quality 9/10 Extreme 20 unhealthy d/yr today · 28 by 30 yrs out
Nearby sold comps map
Loading sold comps map…
Walkable amenities ~0.75 mi
Loading nearby amenities…
Taxation est. · year 1
- Rental income
- $18,774
- − Mortgage interest
- −$4,985
- − Property taxes
- −$2,962
- − Insurance
- −$445
- − Repairs & maintenance
- −$1,502
- − Management
- −$1,502
- − Depreciation
- −$2,589
- Taxable income
- $4,789
- Est. tax owed @ 24.0%
- −$1,149
- After-tax cash flow
- $4,675/yr
For passive investors: Depreciation is non-cash, so a rental often shows a tax loss while cash-flowing — sheltering income. Rental losses are passive: they offset passive income freely, and up to $25,000/yr can offset ordinary (W-2) income if you actively participate and your MAGI is under $100k (phasing out to $0 by $150k); unused losses carry forward. On sale, claimed depreciation is recaptured at up to 25%, and gains may owe capital-gains tax (a 1031 exchange can defer both). Figures are a year-1 estimate at your 24.0% rate — not tax advice; consult a CPA.
Schools (NCES district)
- District
- Black Oak Mine Unified
- NCES district ID
- 0605240
- Math proficiency
- 25% ▼ -3.00%
- Reading proficiency
- 40% ▼ -4.00%
- Median HH income
- $68,195
- Composite
- 29.96/100
- National rank
- #6371
- State rank
- #278 of 517 in CA
Livability — Georgetown
- Score
- 57/100
- State rank
- #753
- US rank
- #21998
Category grades
Schools grade is shown separately in the Schools card above.
Census & demographics
- Census place
- Georgetown, CA
- Population (ZIP)
- 3,792
Population outlook (El Dorado County) Hauer SSP2
- Today (2025)
- 191,666 people
- By 2030
- 193,662 · +1.0%
- By 2040
- 192,583 · +0.5%
- By 2050
- 185,904 · -3.0%
- By 2075
- 169,543 · -11.5%
- By 2100
- 139,623 · -27.2%
Race, ethnicity, and origin ACS 2023
- Neighborhood character
- Predominantly White (84%)
- Race & ethnicity
- White 84% Hispanic / Latino 10% Two or more races 5% Asian 2%
- Hispanic origin (detail)
- Mexican 4% Puerto Rican 1%
- Common ancestry
- Lithuanian 5% Slovak 4% Italian 2%
- Foreign-born
- 4% · Canada, China
- Languages at home
- 97% English-only · Spanish 2%
Political lean MEDSL · El Dorado
- 2024 margin
- R (+12.0) · D 42.6% · R 54.6% · Other 2.8%
- 2008→2024 swing
- -1.5pp toward R · 2008: -10.5pp · 2024: -12.0pp
- All cycles
- 2024: R+12.0 2020: R+8.8 2016: R+13.9 2012: R+18.2 2008: R+10.5
Not yet ingested
- Civics
- —
Market trends
- HPI YoY
- ▲ 2.33%
- Current HPI
- 255.0819
- Rent YoY
- —
- Metro
- —
- State GDP YoY
- ▲ 3.21%
- F500 in state
- 116
Industry mix (Fortune 500 HQ in CA)
| Industry | F500 HQs | Revenue |
|---|---|---|
| Technology | 27 | $1,492B |
|
||
| Financial Services | 3 | $174B |
|
||
| Retail | 3 | $44B |
|
||
| Insurance | 3 | $26B |
|
||
| Media / Entertainment | 2 | $115B |
|
||
| Pharmaceuticals / Biotech | 2 | $62B |
|
||
Price history
+11.2% since first listed6 events — show timeline
- 2026-05-26 Listing Removed — bridgeMLS, Bay East AOR, or Contra Costa AOR
- 2026-05-26 Listed $89,000 MLSListings
- 2026-05-26 Listed $89,000 bridgeMLS, Bay East AOR, or Contra Costa AOR
- 2026-05-23 Listed — bridgeMLS, Bay East AOR, or Contra Costa AOR
- 2013-05-29 Sold (Public Records) $124,000 Public Records
- 1992-09-30 Sold (Public Records) $80,000 Public Records
Property tax history
+8.6%/yrLatest (2025): $2,962 · +12.4% YoY. Source: county tax records.
Cash-flow waterfall
monthlySold comps — $/sqft
last 12 mo · ≤1 miLoading sold comps…