286 Hillcrest Circle Dr · Jackson, TN
Flood risk 1/10 · Minimal
- FEMA flood zone
- X (unshaded)
- Chance of flooding over 30 yrs
- 0.0%
- Est. flood insurance / yr
- $507 – $1,088
Fire risk 4/10 · Minor
- Est. fire insurance / yr
- $949 – $1,763
Heat risk 6/10 · Moderate
- Hot days now (above 108°F)
- 7 days/yr
- Hot days in 30 yrs
- 20 days/yr
Wind risk 4/10 · Minor
- Chance of severe wind over 30 yrs
- 15.0%
Air-quality risk 1/10 · Minimal
- Unhealthy air days now
- 0 days/yr
- Unhealthy air days in 30 yrs
- 0 days/yr
Risk factors via First Street. Map © Google.
Why this score? — see what drove the D- grade
The composite is a weighted blend of 9 inputs, each scored 0–100. Each bar is that input's sub-score; the figure is the points it added to the 100-point composite (weight × sub-score).
- Cash flow +16.6/30.0
- DSCR +5.1/10.0
- Rent growth +3.8/5.0
- 1% rule +3.2/10.0
- ARV discount +3.1/15.0
- Livability +3.1/5.0
- Condition / age +2.5/5.0
- Schools +1.2/10.0
- Appreciation +0.0/10.0
$155,900
🖨 Deal sheet (PDF) 📄 Offer letter ✓ Due diligence
Listing remarks MLS
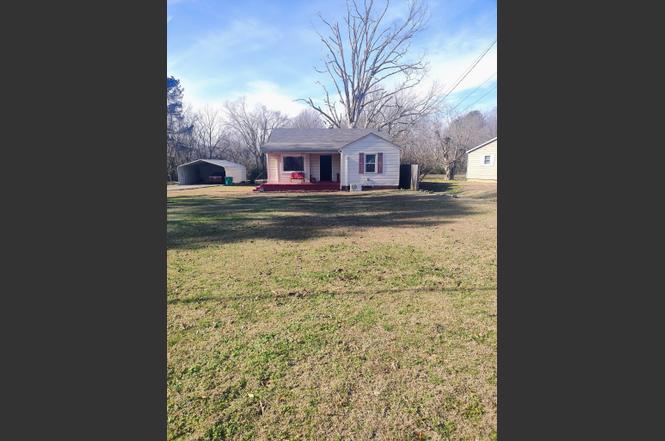
Come check out this Charming 2-Bed, 2-Bed with Timeless Character and Modern Potential, thoughtfully updated to meet todays needs. Discover the charm of this 1952 home. This residence offers a unique blend of historic detail and significant potential. The generous front and backyard provide ample space for both relaxation and personalization. Create your perfect garden or entertainment zone. A valuable bonus space awaits your vision-ideal for a cozy den, a functional home office, or a play area. Includes a convenient carport, adding ease to your daily routine. Give us a call today for your private showing. 731-668-7700
Key facts
- Bonus space
- Historic detail
- Convenient carport
Tags
Property features AI
Finance
- Other: Lot approximately 0.71 acres (about 101 x 323 irregular); Living area reported as 1,314 (owner) — above-grade finished area reported as 1,314
Exterior
- Parking: Detached parking; Driveway parking; On-street parking; 2 covered spaces; 2 carport spaces; 4 open parking spaces (6 total)
- Utilities: Public water; Public sewer; Natural gas available; Water service available
- Home design: Single family residence; One story
- Construction: Aluminum and vinyl siding; Shingle roof; Existing construction
- Exterior features: Covered porch; Back yard fencing
Interior
- Kitchen: Gas oven, Gas range, Refrigerator
- Bedrooms: 2 bedrooms (both on the main level); Bedroom sizes approximately 7 x 11 and 3 x 8
- Flooring: Carpet; Laminate
- Bathrooms: 1 full bath; 1 half bath
- Heating & cooling: Central heating (natural gas); Central air; Ceiling fans
- Interior features: Gas oven, Gas range, Refrigerator; Carpet and laminate flooring; No basement
Neighborhood map
What this means for you Summary
Snapshot
- This is a 2-bed/1.0-bath single-family listed at $156k.
Deal economics
- At list price, monthly cash flow is $93 ($1k/yr) — positive.
- The deal already cash-flows at list — no discount required.
- To meet the 1% rule (rent ≥ 1% of price), the offer needs to be $128k (17.7% below list).
- Recommended offer: $128k (17.7% below list) — sets the bar for 1% rule.
- Cap rate 7.0% vs local median 3.5% in Jackson — top-decile yield for the area; either an underpriced asset or a hidden risk that comps aren't pricing in. Stress-test before assuming the spread holds.
Location & tenants
- Location reads 62/100 on livability (#216 in TN) — a middle-class / working-renter tenant base. Strengths: cost of living A+, housing A+; Watch: health & safety C-, crime F, amenities F.
- Madison County (urban): math 10% / reading 17% proficiency, ranked #131 of 139 in TN (top 94%) — low school quality limits family demand, transient renter base, plan for 1-2y turnover; 68% free/reduced lunch — lower-income household profile, screen leases tightly.
- Zoned schools: Rose Hill School (math 4% / reading 7%, grade F, #890 of 952 statewide, top 94%, 497 students, 0% FRL); Liberty Technology Magnet High School (math 2% / reading 13%, grade F, #290 of 332 statewide, top 87%, 549 students, 0% FRL) — zoned schools average 0% FRL vs 68% district-wide (68 pts lower); this property's tenant base skews higher-income than the district average.
- Market conditions: Rents rising fast (+5.2%/yr); 255 active listings in the ZIP; lower-income renter base — watch delinquency; 247 units permitted in Madison County in 2024 (0 in 5+ unit buildings).
- This rent runs 36% of the median local income ($43k/yr) — at the standard rent-burdened threshold; future hikes will face affordability resistance.
Forward outlook
- Local home prices are declining (-3.0%/yr); year-one equity from $1k of loan paydown is wiped out by about $5k of value loss. Plan a longer hold.
- Madison County population projected at -12% by 2050 — secular population decline; favor cash flow + early exit over multi-decade hold.
Negotiation context
- It's been on market 160 days — a 12% lower offer ($137k) is reasonable based on typical stale-listing flexibility.
- 2 sale attempts with the ask held roughly flat each time — persistent listings suggest the price (not the market) is what's stuck; bring a comps-based counter.
Risks & watch-outs
- Watch-outs: built in 1952 — expect roof / HVAC / electrical / plumbing capex.
- Climate carrying-cost: extreme-heat days projected 7→20/yr by 2055 (HVAC capex compounding) — expect insurance premiums to compound above CPI over the hold.
Questions for the listing agent
- It's been on market 160 days. Have you received any prior offers? Is the seller open to a 18% concession, seller financing, or rate buy-down credit?
- Built in 1952 — when were the roof, HVAC, electrical panel, plumbing, and water heater last replaced?
- Why hasn't it sold? Are there any deal-killer items the seller is aware of (foundation, flood, title, zoning, code violations)?
- Is there a deadline driving the sale (1031 exchange, divorce, estate, relocation)? That informs how much negotiation room exists.
- Schools are F-rated, which usually means shorter tenancies and higher turnover. Who's the typical renter profile here, and what's been the actual vacancy rate?
- Crime grade is F in this area — have there been break-ins, vandalism, or insurance claims at this property in the last 3 years? What carrier currently insures it and at what premium?
- The area grade is low — what's the realistic commute time and amenity access for the typical tenant pool here? Any planned neighborhood developments (good or bad) we should know about?
- What's the average days-on-market for RENTAL listings here right now (not sales)? A rising rental-DOM trend means longer vacancies and softer asking-rent achievability than the comps imply.
- What's the recent tenant-quality profile in this submarket — average credit score on applications, eviction rate, late-payment / NSF rate, and stable-employment percentage? A property-management company in the area should have these aggregated.
- How much new for-sale + rental construction is in the pipeline within 1–3 miles? Heavy new supply typically softens prices + rents 12–24 months out; constrained supply supports both.
Investment metrics
- 1% rule
- 0.82% ✗
- Cap rate
- 7.01%
- Cash-on-cash
- 2.56%
- DSCR
- 1.11
- GRM
- 10.1
CMA / ARV
- ARV (on-the-fly)
- $141,912
- Comps found
- 10
Show comp detail 10 sales within ~0.75 mi
| Address | Dist | Beds/Ba | Sqft | Sold | Price | $/sf | Match |
|---|---|---|---|---|---|---|---|
| 59 Hillcrest Circle Dr | 0.12mi | 2/1.0 | 1,244 (-5%) | 12mo | $133,900 | $108 | 76 |
| 1782 E Chester St | 0.44mi | 2/1.0 | 1,280 (-3%) | 1mo | $60,000 | $47 | 74 |
| 60 Altamont Dr | 0.37mi | 3/1.0 (+1) | 1,215 (-8%) | 4mo | $55,000 | $45 | 62 |
| 78 Dairy St | 0.06mi | 3/2.0 (+1) | 1,196 (-9%) | 20mo | $150,000 | $125 | 57 |
| 163 Cartmell St | 0.66mi | 3/2.0 (+1) | 1,277 (-3%) | 9mo | $215,000 | $168 | 48 |
| 155 Cartmell St | 0.69mi | 3/2.0 (+1) | 1,350 (+3%) | 9mo | $250,000 | $185 | 47 |
| 1771 E Chester St | 0.37mi | 3/2.0 (+1) | 1,196 (-9%) | 21mo | $145,000 | $121 | 42 |
| 47 Regency Dr | 0.68mi | 3/1.5 (+1) | 1,156 (-12%) | 15mo | $100,000 | $87 | 28 |
| 142 Phillips St | 0.70mi | 3/2.0 (+1) | 1,160 (-12%) | 23mo | $99,900 | $86 | 20 |
| 203 Phillips St | 0.73mi | 3/2.0 (+1) | 1,498 (+14%) | 19mo | $135,000 | $90 | 18 |
Match score weights: distance 35% · size 25% · config 20% · recency 20%. Top-matched comps best support the ARV.
Projected returns pro-forma
-3.0% appreciation · 5.19% rent growth · sell at horizon
- IRR
- -10.2%
- Equity multiple
- 0.62×
- Total profit
- $-16,530
- Equity at exit
- $23,245
- IRR
- 1.6%
- Equity multiple
- 1.12×
- Total profit
- $5,310
- Equity at exit
- $13,479
Cash invested: $43,652 (down + closing). Projections, not guarantees.
Landlord ↔ Tenant lean methodology
- Overall (STATE)
- 87 Strongly Landlord-Friendly
- State Tennessee
- 87 Strongly Landlord-Friendly · R+13
- County
- — inherits STATE
- City
- — inherits STATE
ZIP-level market 38301
- Rents YoY
- 5.2%
- Active inventory
- 255
- Price-to-rent
- 10.1×
Monthly cashflow live
- Estimated rent
- $1,282 medium interval (Pro) →
- Mortgage (P&I)
- −$818
- Tax from tax record
- −$38 /mo · $452/yr
- Insurance
- −$65
- HOA
- −$0
- Lot rent
- −$0
- Vacancy / Maint / Mgmt
- −$269
- Net cashflow
- $93
Break-even live
Sensitivity live
| Price | -10% $181 | -5% $137 | +0% $93 | +5% $49 | +10% $5 |
|---|---|---|---|---|---|
| Rent | -10% $-8 | -5% $42 | +0% $93 | +5% $144 | +10% $194 |
| Rate | -1.0pp $171 | -0.5pp $133 | base $93 | +0.5pp $53 | +1.0pp $11 |
UW: 25.0% down · 7.5% · 30yr · 1.5% tax · 5.0% vac · 8.0% maint · 8.0% mgmt
Financing live
Cash to close
- Down payment
- $38,975
- Closing costs
- $4,677
- Reserves months
- —
- Total cash needed
- —
Loan-product check · same deal, 3 products live
Conventional
25% down · 7.5% · 30yr
- Down + closing
- —
- Monthly P&I
- —
- Monthly cashflow
- —
- DSCR
- —
- Eligible?
- —
Personal DTI + credit; lowest rate.
DSCR
20% down · 8.5% · 30yr
- Down + closing
- —
- Monthly P&I
- —
- Monthly cashflow
- —
- DSCR
- —
- Eligible?
- —
No personal income docs; deal must DSCR.
Hard money
10% down · 12.0% · 12mo
- Down + closing
- —
- Monthly P&I
- —
- Monthly cashflow
- —
- DSCR
- —
- Eligible?
- —
Short-term bridge; refi at stabilization.
Listing history 21 events
-
2026-06-23days on market $155,900 Active 160 DOM
-
2026-06-21days on market $155,900 Active 159 DOM
-
2026-06-19days on market $155,900 Active 157 DOM
-
2026-06-18days on market $155,900 Active 156 DOM
-
2026-06-17days on market $155,900 Active 155 DOM
-
2026-06-16days on market $155,900 Active 154 DOM
-
2026-06-15days on market $155,900 Active 153 DOM
-
2026-06-14days on market $155,900 Active 151 DOM
-
2026-06-13days on market $155,900 Active 150 DOM
-
2026-06-10days on market $155,900 Active 148 DOM
-
2026-06-09days on market $155,900 Active 147 DOM
-
2026-06-08days on market $155,900 Active 146 DOM
-
2026-06-07days on market $155,900 Active 145 DOM
-
2026-06-05days on market $155,900 Active 142 DOM
-
2026-06-03days on market $155,900 Active 141 DOM
-
2026-06-02days on market $155,900 Active 140 DOM
-
2026-06-01days on market $155,900 Active 139 DOM
-
2026-05-31days on market $155,900 Active 138 DOM
-
2026-05-30days on market $155,900 Active 137 DOM
-
2026-01-13$155,900 Active
Show marketing remark (626 chars)
Come check out this Charming 2-Bed, 2-Bed with Timeless Character and Modern Potential, thoughtfully updated to meet todays needs. Discover the charm of this 1952 home. This residence offers a unique blend of historic detail and significant potential. The generous front and backyard provide ample space for both relaxation and personalization. Create your perfect garden or entertainment zone. A valuable bonus space awaits your vision-ideal for a cozy den, a functional home office, or a play area. Includes a convenient carport, adding ease to your daily routine. Give us a call today for your private showing. 731-668-7700
-
2026-01-13$155,900 Active 626-char remark
Show marketing remark (626 chars)
Come check out this Charming 2-Bed, 2-Bed with Timeless Character and Modern Potential, thoughtfully updated to meet todays needs. Discover the charm of this 1952 home. This residence offers a unique blend of historic detail and significant potential. The generous front and backyard provide ample space for both relaxation and personalization. Create your perfect garden or entertainment zone. A valuable bonus space awaits your vision-ideal for a cozy den, a functional home office, or a play area. Includes a convenient carport, adding ease to your daily routine. Give us a call today for your private showing. 731-668-7700
ⓘ Source: listings_history table (triggers on properties + properties_extension) + one-shot
backfill from property_details.listing_events for pre-trigger history.
Tax reassessment forecast TN · Resets to sale price
- Current annual tax
- $452 · $38/mo
- Projected year-2 tax
- $1,107 · $92/mo
- Expected delta
- +$655/yr (+$55/mo · 144.9%)
ⓘ Screening estimate from a state-policy table — verify with the county assessor before closing.
Climate risk First Street
- Flood 1/10 Low FEMA zone X (unshaded) · 0% chance over 30 yrs
- Wildfire 4/10 Moderate
- Heat 6/10 Major 7 d/yr ≥108°F today · 20 d/yr by 30 yrs out
- Wind 4/10 Moderate 15% chance of damaging wind over 30 yrs
- Air quality 1/10 Low 0 unhealthy d/yr today · 0 by 30 yrs out
Nearby sold comps map
Loading sold comps map…
Walkable amenities ~0.75 mi
Loading nearby amenities…
Taxation est. · year 1
- Rental income
- $15,390
- − Mortgage interest
- −$8,733
- − Property taxes
- −$452
- − Insurance
- −$780
- − Repairs & maintenance
- −$1,231
- − Management
- −$1,231
- − Depreciation
- −$4,535
- Taxable loss
- −$1,572
- Est. tax savings @ 24.0%
- +$377
- After-tax cash flow
- $1,493/yr
For passive investors: Depreciation is non-cash, so a rental often shows a tax loss while cash-flowing — sheltering income. Rental losses are passive: they offset passive income freely, and up to $25,000/yr can offset ordinary (W-2) income if you actively participate and your MAGI is under $100k (phasing out to $0 by $150k); unused losses carry forward. On sale, claimed depreciation is recaptured at up to 25%, and gains may owe capital-gains tax (a 1031 exchange can defer both). Figures are a year-1 estimate at your 24.0% rate — not tax advice; consult a CPA.
Schools (NCES district)
- District
- Madison County
- NCES district ID
- 4702580
- Math proficiency
- 10% ▼ -11.00%
- Reading proficiency
- 17% ▼ -4.00%
- Median HH income
- $42,015
- Composite
- 11.74/100
- National rank
- #9687
- State rank
- #131 of 139 in TN
Livability — Jackson
- Score
- 62/100
- State rank
- #216
- US rank
- #16488
Category grades
Schools grade is shown separately in the Schools card above.
Census & demographics
- Census place
- Jackson, TN
- County
- Madison County · 87,024 people
- City population
- 87,024
- Metro
- Jackson, TN
- Population (ZIP)
- 33,536
- Household income
- $43,227
- Rent vs Own
- Severe rent burden
- 1701.0
Population outlook (Madison County) Hauer SSP2
- Today (2025)
- 95,952 people
- By 2030
- 94,264 · -1.8%
- By 2040
- 89,607 · -6.6%
- By 2050
- 84,133 · -12.3%
- By 2075
- 72,215 · -24.7%
- By 2100
- 62,062 · -35.3%
Race, ethnicity, and origin ACS 2023
- Neighborhood character
- Diverse neighborhood (Simpson 0.57)
- Race & ethnicity
- Black 50% White 42% Two or more races 5% Hispanic / Latino 4%
- Common ancestry
- Slovak 1% Serbian 1% Portuguese 1%
- Foreign-born
- 3% · Canada
- Languages at home
- 96% English-only · Spanish 3%
Political lean MEDSL · Madison
- 2024 margin
- R (+18.2) · D 40.3% · R 58.5% · Other 1.2%
- 2008→2024 swing
- +3.4pp toward D · 2008: -21.6pp · 2024: -18.2pp
- All cycles
- 2024: R+18.2 2020: R+12.9 2016: R+15.6 2012: R+8.9 2008: R+21.6
Not yet ingested
- Civics
- —
Market trends
- HPI YoY
- ▼ -112.26%
- Current HPI
- 162.2273
- Rent YoY
- ▲ 5.19%
- Metro
- Jackson, TN
- State GDP YoY
- ▲ 2.78%
- F500 in state
- 22
Industry mix (Fortune 500 HQ in TN)
| Industry | F500 HQs | Revenue |
|---|---|---|
| Healthcare | 3 | $91B |
|
||
| Retail | 3 | $72B |
|
||
| Transportation / Logistics | 1 | $88B |
|
||
| Paper / Packaging | 1 | $19B |
|
||
| Insurance | 1 | $13B |
|
||
| Energy | 1 | $12B |
|
||
Price history
+0.0% since first listed2 events — show timeline
- 2026-01-13 Listed $155,900 REALTRACS as Distributed by MLS Grid
- 2026-01-13 Listed $155,900 CWTAR
Property tax history
+2.1%/yrLatest (2025): $452 · -2.8% YoY. Source: county tax records.
Cash-flow waterfall
monthlySold comps — $/sqft
last 12 mo · ≤1 miLoading sold comps…