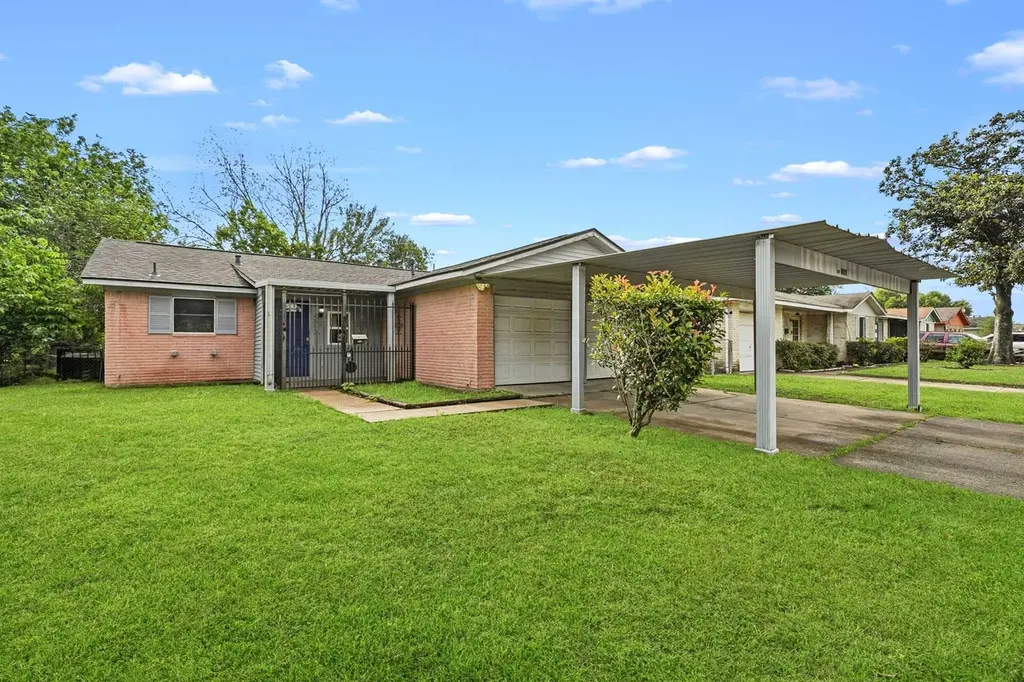
12903 Claygate Dr · Houston, TX
Flood risk 4/10 · Minor
- FEMA flood zone
- X (unshaded)
- Chance of flooding over 30 yrs
- 0.2%
- Est. flood insurance / yr
- $507 – $1,088
Fire risk 1/10 · Minimal
- Est. fire insurance / yr
- $1,222 – $2,270
Heat risk 9/10 · Severe
- Hot days now (above 109°F)
- 7 days/yr
- Hot days in 30 yrs
- 23 days/yr
Wind risk 9/10 · Severe
- Chance of severe wind over 30 yrs
- 99.0%
Air-quality risk 2/10 · Minimal
- Unhealthy air days now
- 2 days/yr
- Unhealthy air days in 30 yrs
- 2 days/yr
Risk factors via First Street. Map © Google.
Why this score? — see what drove the D grade
The composite is a weighted blend of 9 inputs, each scored 0–100. Each bar is that input's sub-score; the figure is the points it added to the 100-point composite (weight × sub-score).
- Cash flow +16.6/30.0
- DSCR +5.2/10.0
- 1% rule +4.8/10.0
- Livability +3.7/5.0
- ARV discount +2.7/15.0
- Schools +2.7/10.0
- Condition / age +2.5/5.0
- Rent growth +2.4/5.0
- Appreciation +0.0/10.0
$189,000
🖨 Deal sheet (PDF) 📄 Offer letter ✓ Due diligence
Key facts
- 5,562 sq ft lot
- 2 garage spots
- Built 1970
Property features AI
Finance
- Other: Living area approximately 1,180 (listed); Lot size approximately 0.1277 acres
- Financial info: Lease considered
Exterior
- Parking: Attached garage with 2 parking spaces
- Utilities: Public water; Public sewer
- Home design: Residential property; Single-story; Slab foundation; Built in 1970
- Construction: Brick construction; Composition roof
- Exterior features: Lot features: Other
Interior
- Bedrooms: Primary bedroom on the first floor (approx. 14 x 11); Bedroom on the first floor (approx. 11 x 10); Bedroom on the first floor (approx. 10 x 10)
- Bathrooms: 1 full bathroom; 1 half bathroom
- Heating & cooling: Central heating (gas); Central electric air conditioning
- Interior features: 3 total rooms; Seller disclosure available
Neighborhood map
What this means for you Summary
Snapshot
- This is a 3-bed/1.5-bath single-family listed at $189k.
Deal economics
- At list price, monthly cash flow is $114 ($1k/yr) — positive.
- The deal already cash-flows at list — no discount required.
- To meet the 1% rule (rent ≥ 1% of price), the offer needs to be $186k (1.6% below list).
- Recommended offer: $183k (3.0% below list) — sets the bar for market timing.
- Cap rate 7.0% vs local median 3.2% in Houston — top-decile yield for the area; either an underpriced asset or a hidden risk that comps aren't pricing in. Stress-test before assuming the spread holds.
Location & tenants
- Location reads 74/100 on livability (#184 in TX, #4,771 nationally) — a middle-class / working-renter tenant base. Strengths: amenities A+, cost of living A+, housing A+; Watch: crime F.
- Houston ISD (urban): math 27% / reading 35% proficiency, ranked #593 of 826 in TX (top 72%) — families likely to look elsewhere, expect single-tenant / working-renter base with shorter leases; 71% free/reduced lunch — lower-income household profile, screen leases tightly.
- Zoned schools: Law El (math 22% / reading 32%, grade F, #2,791 of 4,322 statewide, top 68%, 514 students, 91% FRL); Thomas Middle (math 3% / reading 13%, grade F, #1,654 of 1,662 statewide, top 100%, 526 students, 98% FRL); Worthing H S (math 22% / reading 21%, grade F, #1,377 of 1,632 statewide, top 85%, 827 students, 96% FRL) — zoned schools average 95% FRL vs 71% district-wide (24 pts higher); higher-poverty schools than district average — tighter screening recommended.
- Zoned-school proficiency averages 19% at this address vs 31% district-wide (-12 pts) — the specific schools serving this property underperform the Houston ISD average; the district grade overstates school quality for this exact location.
- Market conditions: Rents soft (-0.2%/yr); 284 active listings in the ZIP; 15 comparable units currently listed for rent nearby; rentals leasing fast (median 9d on market — plan ~1-2 weeks tenant-placement turnaround); solid renter incomes; 29,883 units permitted in Harris County in 2024 (8,621 in 5+ unit buildings).
Forward outlook
- Local home prices are declining (-3.0%/yr); year-one equity from $1k of loan paydown is wiped out by about $6k of value loss. Plan a longer hold.
- Harris County population projected at +47% by 2050 — long-run rental-demand tailwind backs the buy-and-hold thesis.
Negotiation context
- It's been on market 50 days — a 3% lower offer ($183k) is reasonable based on typical stale-listing flexibility.
- 4 sale attempts since 10y ago; this cycle's ask is 11355% above the opening price — seller raised mid-cycle; expect resistance to lowballs.
Risks & watch-outs
- Climate carrying-cost: severe wind risk, 99% chance of damaging wind over 30y; extreme-heat days projected 7→23/yr by 2055 (HVAC capex compounding) — expect insurance premiums to compound above CPI over the hold.
Questions for the listing agent
- It's been on market 50 days. Have you received any prior offers? Is the seller open to a 3% concession, seller financing, or rate buy-down credit?
- Built in 1970 — when were the roof, HVAC, electrical panel, plumbing, and water heater last replaced?
- Is there a deadline driving the sale (1031 exchange, divorce, estate, relocation)? That informs how much negotiation room exists.
- Schools are D-rated, which usually means shorter tenancies and higher turnover. Who's the typical renter profile here, and what's been the actual vacancy rate?
- Crime grade is F in this area — have there been break-ins, vandalism, or insurance claims at this property in the last 3 years? What carrier currently insures it and at what premium?
- The area grade is low — what's the realistic commute time and amenity access for the typical tenant pool here? Any planned neighborhood developments (good or bad) we should know about?
- What's the average days-on-market for RENTAL listings here right now (not sales)? A rising rental-DOM trend means longer vacancies and softer asking-rent achievability than the comps imply.
- What's the recent tenant-quality profile in this submarket — average credit score on applications, eviction rate, late-payment / NSF rate, and stable-employment percentage? A property-management company in the area should have these aggregated.
- How much new for-sale + rental construction is in the pipeline within 1–3 miles? Heavy new supply typically softens prices + rents 12–24 months out; constrained supply supports both.
Investment metrics
- 1% rule
- 0.98% ✗
- Cap rate
- 7.02%
- Cash-on-cash
- 2.59%
- DSCR
- 1.12
- GRM
- 8.5
CMA / ARV
- ARV (median comp)
- $170,872
- List price
- $189,000
- Delta
- 10.61%
- Verdict
- OVERPRICED
- Comps
- 20 within 1.0 mi
Show comp detail 12 sales within ~0.75 mi
| Address | Dist | Beds/Ba | Sqft | Sold | Price | $/sf | Match |
|---|---|---|---|---|---|---|---|
| 12922 Claygate Dr | 0.06mi | 3/1.5 | 1,184 (+0%) | 11mo | $124,900 | $105 | 88 |
| 12930 Segrest Dr | 0.10mi | 3/1.5 | 1,219 (+3%) | 6mo | $122,000 | $100 | 85 |
| 12506 S Coast Dr | 0.36mi | 3/1.5 | 1,026 (-13%) | 3mo | $120,000 | $117 | 59 |
| 12511 Claygate Dr | 0.35mi | 3/1.0 | 1,298 (+10%) | 10mo | $95,000 | $73 | 57 |
| 12543 Claygate Dr | 0.26mi | 3/1.0 | 1,305 (+11%) | 24mo | $175,000 | $134 | 48 |
| 12611 S Coast Dr | 0.23mi | 4/2.0 (+1) | 1,335 (+13%) | 20mo | $130,000 | $97 | 44 |
| 4307 Bungalow Ln | 0.70mi | 3/1.0 | 1,141 (-3%) | 19mo | $139,000 | $122 | 44 |
| 3630 Almeda Genoa Rd | 0.44mi | 3/1.0 | 1,063 (-10%) | 21mo | $128,900 | $121 | 44 |
| 12518 Donegal Way | 0.42mi | 3/1.5 | 1,346 (+14%) | 19mo | $180,000 | $134 | 41 |
| 3411 Grand Legacy Ln | 0.62mi | 3/2.0 | 1,288 (+9%) | 18mo | $264,990 | $206 | 39 |
| 11707 Segrest Dr | 0.73mi | 3/1.0 | 1,020 (-14%) | 9mo | $149,900 | $147 | 34 |
| 12711 Mill Valley Rd | 0.72mi | 3/2.0 | 1,342 (+14%) | 14mo | $165,000 | $123 | 30 |
Match score weights: distance 35% · size 25% · config 20% · recency 20%. Top-matched comps best support the ARV.
Projected returns pro-forma
-3.0% appreciation · 0.0% rent growth · sell at horizon
- IRR
- -15.7%
- Equity multiple
- 0.46×
- Total profit
- $-28,743
- Equity at exit
- $28,181
- IRR
- -13.9%
- Equity multiple
- 0.31×
- Total profit
- $-36,482
- Equity at exit
- $16,341
Cash invested: $52,920 (down + closing). Projections, not guarantees.
Landlord ↔ Tenant lean methodology
- Overall (STATE)
- 87 Strongly Landlord-Friendly
- State Texas
- 87 Strongly Landlord-Friendly · R+5
- County
- — inherits STATE
- City
- — inherits STATE
ZIP-level market 77047
- Home prices YoY
- -10.1%
- Rents YoY
- -0.2%
- Active inventory
- 284
- Price-to-rent
- 8.5×
Monthly cashflow live
- Estimated rent
- $1,859 high interval (Pro) →
- Mortgage (P&I)
- −$991
- Tax from tax record
- −$284 /mo · $3,413/yr
- Insurance
- −$79
- HOA
- −$0
- Vacancy / Maint / Mgmt
- −$390
- Net cashflow
- $114
Break-even live
Sensitivity live
| Price | -10% $221 | -5% $168 | +0% $114 | +5% $61 | +10% $7 |
|---|---|---|---|---|---|
| Rent | -10% $-33 | -5% $41 | +0% $114 | +5% $188 | +10% $261 |
| Rate | -1.0pp $209 | -0.5pp $162 | base $114 | +0.5pp $65 | +1.0pp $15 |
UW: 25.0% down · 7.5% · 30yr · 1.5% tax · 5.0% vac · 8.0% maint · 8.0% mgmt
Financing live
Cash to close
- Down payment
- $47,250
- Closing costs
- $5,670
- Reserves months
- —
- Total cash needed
- —
Loan-product check · same deal, 3 products live
Conventional
25% down · 7.5% · 30yr
- Down + closing
- —
- Monthly P&I
- —
- Monthly cashflow
- —
- DSCR
- —
- Eligible?
- —
Personal DTI + credit; lowest rate.
DSCR
20% down · 8.5% · 30yr
- Down + closing
- —
- Monthly P&I
- —
- Monthly cashflow
- —
- DSCR
- —
- Eligible?
- —
No personal income docs; deal must DSCR.
Hard money
10% down · 12.0% · 12mo
- Down + closing
- —
- Monthly P&I
- —
- Monthly cashflow
- —
- DSCR
- —
- Eligible?
- —
Short-term bridge; refi at stabilization.
Rent comps 15 comps
| Address | Beds | Baths | Sqft | Rent | $/sqft | DOM | Units | Dist |
|---|---|---|---|---|---|---|---|---|
| 4015 Marchant Rd Houston, TX | 3.0 | 2.0 | 1200 | $1,700 | $1.42 | 45d | 1 | 0.28mi |
| 3918 Almeda-Genoa Rd Houston, TX | 1.0–3.0 | 1.0–2.0 | 1038 | $2,220 | $2.14 | 0d | 26 | 0.62mi |
| 11819 Leitrim Way Houston, TX | 3.0 | 1.0 | 1476 | $1,150 | $0.78 | 7d | 1 | 0.65mi |
| 12227 Cape Hyannis Dr Houston, TX | 3.0 | 2.0 | 1432 | $1,705 | $1.19 | 15d | 1 | 0.72mi |
| 13561 Cullen Blvd Houston, TX | 2.0 | 2.0 | 990 | $1,450 | $1.46 | 45d | 1 | 0.92mi |
| 13555 Cullen Blvd Houston, TX | 1.0–3.0 | 1.0–2.0 | 917 | $1,900 | $2.07 | 45d | 35 | 0.93mi |
| 3110 Kainer Meadows Ln Houston, TX | 3.0 | 2.0 | 1469 | $1,900 | $1.29 | 9d | 1 | 1.07mi |
| 4071 Schurmier Rd Unit SLC2 Houston, TX | 2.0 | 2.0 | 990 | $1,575 | $1.59 | 4d | 1 | 1.17mi |
| 4322 Groton Dr Houston, TX | 3.0 | 1.0 | 858 | $1,395 | $1.63 | 45d | 1 | 1.21mi |
| 13351 Cityscape Ave Houston, TX | 1.0–2.0 | 1.0–2.0 | 974 | $1,820 | $1.87 | 0d | 26 | 1.24mi |
| 2620 Almeda-Genoa Rd Houston, TX | 1.0–2.0 | 1.0–2.0 | 788 | $1,650 | $2.09 | 1d | 15 | 1.25mi |
| 13511 Hycohen Rd Unit 13534 Houston, TX | 2.0 | 2.0 | 1153 | $1,704 | $1.48 | 0d | 1 | 1.35mi |
| 13511 Hycohen Rd Unit 424 Houston, TX | 2.0 | 2.0 | 1153 | $1,720 | $1.49 | 6d | 1 | 1.35mi |
| 11319 Murr Way Houston, TX | 3.0 | 1.5 | 1213 | $1,699 | $1.40 | 20d | 1 | 1.35mi |
| 13511 Hycohen Rd Houston, TX | 1.0–2.0 | 1.5–2.5 | 961 | $1,710 | $1.78 | 14d | 26 | 1.36mi |
Listing history 19 events
-
2026-06-16days on market $189,000 Active 50 DOM
-
2026-06-15days on market $189,000 Active 49 DOM
-
2026-06-13days on market $189,000 Active 47 DOM
-
2026-06-10days on market $189,000 Active 43 DOM
-
2026-06-08days on market $189,000 Active 42 DOM
-
2026-06-07days on market $189,000 Active 41 DOM
-
2026-06-04days on market $189,000 Active 38 DOM
-
2026-06-01days on market $189,000 Active 35 DOM
-
2026-05-31days on market $189,000 Active 34 DOM
-
2026-04-28$1,650
-
2026-04-27$189,000 Active
-
2018-10-18status Pending
-
2018-10-09status Option Pending
-
2018-10-05historical
-
2018-09-27$119,000 Active
-
2018-07-05soldstatus
-
2016-10-06historical
-
2016-09-14$85,000 Active
-
1988-01-02soldstatus
ⓘ Source: listings_history table (triggers on properties + properties_extension) + one-shot
backfill from property_details.listing_events for pre-trigger history.
Tax reassessment forecast TX · Resets to sale price
- Current annual tax
- $3,413 · $284/mo
- Projected year-2 tax
- $3,459 · $288/mo
- Expected delta
- +$45/yr (+$4/mo · 1.3%)
ⓘ Screening estimate from a state-policy table — verify with the county assessor before closing.
Climate risk First Street
- Flood 4/10 Moderate FEMA zone X (unshaded) · 20% chance over 30 yrs
- Wildfire 1/10 Low
- Heat 9/10 Extreme 7 d/yr ≥109°F today · 23 d/yr by 30 yrs out
- Wind 9/10 Extreme 99% chance of damaging wind over 30 yrs
- Air quality 2/10 Low 2 unhealthy d/yr today · 2 by 30 yrs out
Nearby sold comps map
Loading sold comps map…
Walkable amenities ~0.75 mi
Loading nearby amenities…
Taxation est. · year 1
- Rental income
- $22,307
- − Mortgage interest
- −$10,587
- − Property taxes
- −$3,413
- − Insurance
- −$945
- − Repairs & maintenance
- −$1,785
- − Management
- −$1,785
- − Depreciation
- −$5,498
- Taxable loss
- −$1,706
- Est. tax savings @ 24.0%
- +$409
- After-tax cash flow
- $1,780/yr
For passive investors: Depreciation is non-cash, so a rental often shows a tax loss while cash-flowing — sheltering income. Rental losses are passive: they offset passive income freely, and up to $25,000/yr can offset ordinary (W-2) income if you actively participate and your MAGI is under $100k (phasing out to $0 by $150k); unused losses carry forward. On sale, claimed depreciation is recaptured at up to 25%, and gains may owe capital-gains tax (a 1031 exchange can defer both). Figures are a year-1 estimate at your 24.0% rate — not tax advice; consult a CPA.
Schools (NCES district)
- District
- Houston ISD
- NCES district ID
- 4823640
- Math proficiency
- 27% ▼ -18.00%
- Reading proficiency
- 35% ▼ -6.00%
- Median HH income
- $46,054
- Composite
- 26.63/100
- National rank
- #7173
- State rank
- #593 of 826 in TX
Livability — Houston
- Score
- 74/100
- State rank
- #184
- US rank
- #4771
Category grades
Schools grade is shown separately in the Schools card above.
Census & demographics
- Census place
- Houston, TX
- County
- Harris County · 4,702,590 people
- City population
- 3,226,434
- Metro
- Houston-The Woodlands-Sugar Land, TX
- Population (ZIP)
- 34,987
- Household income
- $78,538
- Rent vs Own
- Severe rent burden
- 1109.0
Population outlook (Harris County) Hauer SSP2
- Today (2025)
- 5,571,493 people
- By 2030
- 6,089,821 · +9.3%
- By 2040
- 7,142,806 · +28.2%
- By 2050
- 8,185,864 · +46.9%
- By 2075
- 10,574,329 · +89.8%
- By 2100
- 12,109,958 · +117.4%
Race, ethnicity, and origin ACS 2023
- Neighborhood character
- Diverse neighborhood (Simpson 0.58)
- Race & ethnicity
- Black 57% Hispanic / Latino 29% Two or more races 15% White 6% Asian 3% Pacific Islander 1%
- Hispanic origin (detail)
- Mexican 24% Puerto Rican 1%
- Common ancestry
- Lithuanian 1%
- Foreign-born
- 15% · Canada, Vietnam
- Languages at home
- 70% English-only · Spanish 23% Vietnamese 1% Other Indo-European 1%
Political lean MEDSL · Harris
- 2024 margin
- Lean D (+5.5) · D 52.0% · R 46.4% · Other 1.6%
- 2008→2024 swing
- +3.9pp toward D · 2008: 1.6pp · 2024: 5.5pp
- All cycles
- 2024: D+5.5 2020: D+13.3 2016: D+12.4 2012: D+0.1 2008: D+1.6
Not yet ingested
- Civics
- —
Market trends
- HPI YoY
- ▼ -26.76%
- Current HPI
- 239.2287
- Rent YoY
- ▼ -0.21%
- Metro
- Houston-The Woodlands-Sugar Land, TX
- State GDP YoY
- ▲ 3.95%
- F500 in state
- 110
Industry mix (Fortune 500 HQ in TX)
| Industry | F500 HQs | Revenue |
|---|---|---|
| Energy | 16 | $1,198B |
|
||
| Technology | 5 | $198B |
|
||
| Engineering / Construction | 4 | $72B |
|
||
| Energy Services | 3 | $60B |
|
||
| Utilities | 3 | $41B |
|
||
| Healthcare | 2 | $330B |
|
||
Price history
-98.1% since first listed12 events — show timeline
- 2026-06-16 Rental Removed $1,650 HARMLS
- 2026-06-16 Listing Removed — HARMLS
- 2026-04-28 Listed for Rent $1,650 HARMLS
- 2026-04-27 Listed $189,000 HARMLS
- 2018-10-18 Pending — HARMLS
- 2018-10-09 Pending — HARMLS
- 2018-10-05 Listing Removed — HARMLS
- 2018-09-27 Listed $119,000 HARMLS
- 2018-07-05 Sold (Public Records) — Public Records
- 2016-10-06 Listing Removed — HARMLS
- 2016-09-14 Listed $85,000 HARMLS
- 1988-01-02 Sold (Public Records) — Public Records
Property tax history
+4.0%/yrLatest (2025): $3,413 · +6.6% YoY. Source: county tax records.
Cash-flow waterfall
monthlySold comps — $/sqft
last 12 mo · ≤1 miLoading sold comps…