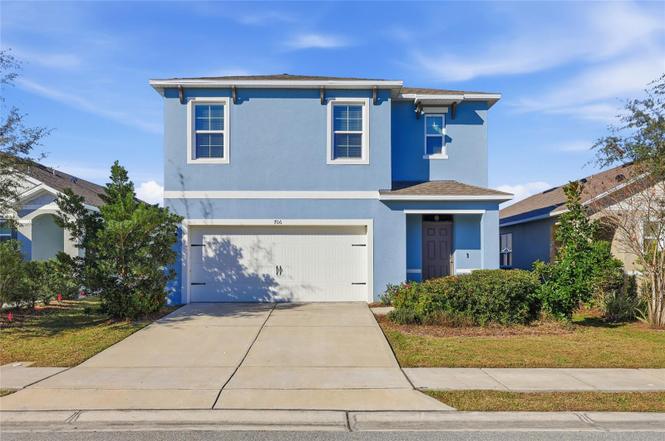
706 Chinoy Rd · Davenport, FL
Flood risk 1/10 · Minimal
- FEMA flood zone
- X (unshaded)
- Chance of flooding over 30 yrs
- 0.0%
- Est. flood insurance / yr
- $507 – $1,088
Fire risk 4/10 · Minor
- Est. fire insurance / yr
- $947 – $1,759
Heat risk 8/10 · Major
- Hot days now (above 108°F)
- 6 days/yr
- Hot days in 30 yrs
- 20 days/yr
Wind risk 9/10 · Severe
- Chance of severe wind over 30 yrs
- 99.0%
Air-quality risk 1/10 · Minimal
- Unhealthy air days now
- 0 days/yr
- Unhealthy air days in 30 yrs
- 0 days/yr
Risk factors via First Street. Map © Google.
Why this score? — see what drove the D grade
The composite is a weighted blend of 9 inputs, each scored 0–100. Each bar is that input's sub-score; the figure is the points it added to the 100-point composite (weight × sub-score).
- Cash flow +12.7/30.0
- ARV discount +7.5/15.0
- 1% rule +5.1/10.0
- DSCR +3.8/10.0
- Schools +3.5/10.0
- Livability +3.5/5.0
- Condition / age +2.5/5.0
- Rent growth +1.8/5.0
- Appreciation +0.0/10.0
$285,000
🖨 Deal sheet (PDF) 📄 Offer letter ✓ Due diligence
Listing remarks
Virtually Staged. Short Sale. Initial Approval by bank! Step into space, comfort, and modern living in this beautiful just-listed Davenport home! Built in 2022, this spacious 5-bedroom, 3-bath, two-story residence offers 2,522 sq. ft. of living space plus a 2-car garage, designed perfectly for today’s lifestyle. The open-concept floor plan creates a seamless flow between the kitchen, dining, and living areas—ideal for gathering with family, hosting guests, and making lasting memories. The living room and bedrooms are carpeted for added comfort, while the home’s modern design delivers both style and functionality. A first-floor bedroom with a full bath provides flexibility
Key facts
- First-floor bedroom
- Large backyard
- Large pantry
Tags
Neighborhood map
What this means for you Summary
Snapshot
- This is a 5-bed/3.0-bath single-family listed at $285k.
Deal economics
- At list price, monthly cash flow is $-34 ($-403/yr) — negative.
- To cash-flow at today's rent, offer at most $279k (2.1% below list).
- Meets the 1% rule at list price ($3k rent vs $285k).
- Recommended offer: $268k (6.0% below list) — sets the bar for market timing.
Location & tenants
- Location reads 70/100 on livability (#423 in FL) — a middle-class / working-renter tenant base. Strengths: crime A+, housing A+, health & safety A+; Watch: employment D+, amenities F, commute F.
- Polk (suburban): math 39% / reading 43% proficiency, ranked #62 of 73 in FL (top 85%) — families likely to look elsewhere, expect single-tenant / working-renter base with shorter leases.
- Zoned schools: Horizons Elementary School (math 37% / reading 39%, grade F, #1,587 of 2,144 statewide, top 74%, 1,468 students, 42% FRL); Shelley S. Boone Middle School (math 25% / reading 25%, grade F, #517 of 571 statewide, top 91%, 1,403 students, 52% FRL); Ridge Community High School (math 12% / reading 33%, grade F, #539 of 667 statewide, top 81%, 2,711 students, 48% FRL).
- Zoned-school proficiency averages 28% at this address vs 41% district-wide (-12 pts) — the specific schools serving this property underperform the Polk average; the district grade overstates school quality for this exact location.
- Market conditions: Rents soft (-2.7%/yr); 1396 active listings in the ZIP; 5 comparable units currently listed for rent nearby; rentals at typical pace (median 17d on market — plan ~3-4 weeks tenant-placement turnaround); solid renter incomes; 10,384 units permitted in Polk County in 2024 (1,716 in 5+ unit buildings).
- This rent runs 43% of the median local income ($81k/yr) — at the standard rent-burdened threshold; future hikes will face affordability resistance.
Forward outlook
- Local home prices are declining (-3.0%/yr); year-one equity from $2k of loan paydown is wiped out by about $9k of value loss. Plan a longer hold.
- Polk County population projected at +33% by 2050 — long-run rental-demand tailwind backs the buy-and-hold thesis.
Negotiation context
- It's been on market 70 days — a 6% lower offer ($268k) is reasonable based on typical stale-listing flexibility.
Risks & watch-outs
- Watch-outs: property tax is 2.9% of price.
- Climate carrying-cost: severe wind risk, 99% chance of damaging wind over 30y; extreme-heat days projected 6→20/yr by 2055 (HVAC capex compounding) — expect insurance premiums to compound above CPI over the hold.
Questions for the listing agent
- What do current leases actually rent for vs. the listed asking? Can we see a recent rent roll and the last 12 months of T-12 income?
- It's been on market 70 days. Have you received any prior offers? Is the seller open to a 6% concession, seller financing, or rate buy-down credit?
- Property tax is high relative to price — has the assessment been appealed recently, and will the sale trigger a re-assessment?
- What does the HOA fee cover, when was the last increase, and are there any pending special assessments or reserve-fund shortfalls?
- Why hasn't it sold? Are there any deal-killer items the seller is aware of (foundation, flood, title, zoning, code violations)?
- Is there a deadline driving the sale (1031 exchange, divorce, estate, relocation)? That informs how much negotiation room exists.
- Schools are D-rated, which usually means shorter tenancies and higher turnover. Who's the typical renter profile here, and what's been the actual vacancy rate?
- The area grade is low — what's the realistic commute time and amenity access for the typical tenant pool here? Any planned neighborhood developments (good or bad) we should know about?
- What's the average days-on-market for RENTAL listings here right now (not sales)? A rising rental-DOM trend means longer vacancies and softer asking-rent achievability than the comps imply.
- What's the recent tenant-quality profile in this submarket — average credit score on applications, eviction rate, late-payment / NSF rate, and stable-employment percentage? A property-management company in the area should have these aggregated.
- How much new for-sale + rental construction is in the pipeline within 1–3 miles? Heavy new supply typically softens prices + rents 12–24 months out; constrained supply supports both.
Investment metrics
- 1% rule
- 1.01% ✓
- Cap rate
- 6.15%
- Cash-on-cash
- -0.50%
- DSCR
- 0.98
- GRM
- 8.2
CMA / ARV
No comps found within radius.
Projected returns pro-forma
-3.0% appreciation · 0.0% rent growth · sell at horizon
- IRR
- -21.1%
- Equity multiple
- 0.29×
- Total profit
- $-56,526
- Equity at exit
- $42,494
- IRR
- -25.8%
- Equity multiple
- -0.05×
- Total profit
- $-83,633
- Equity at exit
- $24,642
Cash invested: $79,800 (down + closing). Projections, not guarantees.
Landlord ↔ Tenant lean methodology
- Overall (STATE)
- 87 Strongly Landlord-Friendly
- State Florida
- 87 Strongly Landlord-Friendly · R+3
- County
- — inherits STATE
- City
- — inherits STATE
ZIP-level market 33837
- Home prices YoY
- -33.9%
- Rents YoY
- -2.7%
- Active inventory
- 1396
- Price-to-rent
- 8.2×
Monthly cashflow live
- Estimated rent
- $2,887 high interval (Pro) →
- Mortgage (P&I)
- −$1,495
- Tax from tax record
- −$694 /mo · $8,327/yr
- Insurance
- −$119
- HOA
- −$7
- Lot rent
- −$0
- Vacancy / Maint / Mgmt
- −$606
- Net cashflow
- $-34
Break-even live
Sensitivity live
| Price | -10% $128 | -5% $47 | +0% $-34 | +5% $-114 | +10% $-195 |
|---|---|---|---|---|---|
| Rent | -10% $-262 | -5% $-148 | +0% $-34 | +5% $80 | +10% $194 |
| Rate | -1.0pp $110 | -0.5pp $39 | base $-34 | +0.5pp $-107 | +1.0pp $-183 |
UW: 25.0% down · 7.5% · 30yr · 1.5% tax · 5.0% vac · 8.0% maint · 8.0% mgmt
Financing live
Cash to close
- Down payment
- $71,250
- Closing costs
- $8,550
- Reserves months
- —
- Total cash needed
- —
Loan-product check · same deal, 3 products live
Conventional
25% down · 7.5% · 30yr
- Down + closing
- —
- Monthly P&I
- —
- Monthly cashflow
- —
- DSCR
- —
- Eligible?
- —
Personal DTI + credit; lowest rate.
DSCR
20% down · 8.5% · 30yr
- Down + closing
- —
- Monthly P&I
- —
- Monthly cashflow
- —
- DSCR
- —
- Eligible?
- —
No personal income docs; deal must DSCR.
Hard money
10% down · 12.0% · 12mo
- Down + closing
- —
- Monthly P&I
- —
- Monthly cashflow
- —
- DSCR
- —
- Eligible?
- —
Short-term bridge; refi at stabilization.
Rent comps 5 comps
| Address | Beds | Baths | Sqft | Rent | $/sqft | DOM | Units | Dist |
|---|---|---|---|---|---|---|---|---|
| 763 Chinoy Rd Davenport, FL | 5.0 | 2.0 | 2446 | $2,500 | $1.02 | 16d | 1 | 0.13mi |
| 1387 Berry Ln Davenport, FL | 5.0 | 3.0 | 2522 | $2,500 | $0.99 | 16d | 1 | 0.56mi |
| 1673 Swan Swim Dr Davenport, FL | 5.0 | 2.5 | 2287 | $2,700 | $1.18 | 25d | 1 | 0.58mi |
| 2007 Handsome Hill Ln Davenport, FL | 4.0 | 2.5 | 2287 | $2,425 | $1.06 | 12d | 1 | 0.61mi |
| 440 Tisone Ln Davenport, FL | 4.0 | 2.0 | 2102 | $3,500 | $1.67 | 16d | 1 | 0.85mi |
HOA detail
- Monthly dues
- $7 · $84/yr
Listing history 9 events
-
2026-06-15status $285,000 Pending 70 DOM
-
2026-06-15days on market $285,000 Active 70 DOM
-
2026-06-13statusdays on market $285,000 Active 68 DOM
-
2026-03-27status Pending
-
2026-03-20price $285,000
-
2026-03-09price $350,000
-
2026-02-28price $358,000
-
2026-02-21price $363,990
-
2026-01-20$440,990 Active
ⓘ Source: listings_history table (triggers on properties + properties_extension) + one-shot
backfill from property_details.listing_events for pre-trigger history.
Tax reassessment forecast FL · Resets to sale price
- Current annual tax
- $8,327 · $694/mo
- Projected year-2 tax
- $8,327 · $694/mo
- Expected delta
- $0/yr ($0/mo · 0.0%)
ⓘ Screening estimate from a state-policy table — verify with the county assessor before closing.
Climate risk First Street
- Flood 1/10 Low FEMA zone X (unshaded) · 0% chance over 30 yrs
- Wildfire 4/10 Moderate
- Heat 8/10 Severe 6 d/yr ≥108°F today · 20 d/yr by 30 yrs out
- Wind 9/10 Extreme 99% chance of damaging wind over 30 yrs
- Air quality 1/10 Low 0 unhealthy d/yr today · 0 by 30 yrs out
Nearby sold comps map
Loading sold comps map…
Walkable amenities ~0.75 mi
Loading nearby amenities…
Taxation est. · year 1
- Rental income
- $34,643
- − Mortgage interest
- −$15,964
- − Property taxes
- −$8,327
- − Insurance
- −$1,425
- − Repairs & maintenance
- −$2,771
- − Management
- −$2,771
- − HOA
- −$84
- − Depreciation
- −$8,291
- Taxable loss
- −$4,991
- Est. tax savings @ 24.0%
- +$1,198
- After-tax cash flow
- $795/yr
For passive investors: Depreciation is non-cash, so a rental often shows a tax loss while cash-flowing — sheltering income. Rental losses are passive: they offset passive income freely, and up to $25,000/yr can offset ordinary (W-2) income if you actively participate and your MAGI is under $100k (phasing out to $0 by $150k); unused losses carry forward. On sale, claimed depreciation is recaptured at up to 25%, and gains may owe capital-gains tax (a 1031 exchange can defer both). Figures are a year-1 estimate at your 24.0% rate — not tax advice; consult a CPA.
Schools (NCES district)
- District
- Polk
- NCES district ID
- 1201590
- Math proficiency
- 39% ▼ -11.00%
- Reading proficiency
- 43% ▼ -4.00%
- Median HH income
- $43,979
- Composite
- 34.74/100
- National rank
- #5132
- State rank
- #62 of 73 in FL
Livability — Davenport
- Score
- 70/100
- State rank
- #423
- US rank
- #7541
Category grades
Schools grade is shown separately in the Schools card above.
Census & demographics
- Census place
- Davenport, FL
- County
- Polk County · 740,051 people
- City population
- 104,279
- Metro
- Lakeland-Winter Haven, FL
- Population (ZIP)
- 47,389
- Household income
- $81,276
- Rent vs Own
- Severe rent burden
- 424.0
Population outlook (Polk County) Hauer SSP2
- Today (2025)
- 752,975 people
- By 2030
- 804,621 · +6.9%
- By 2040
- 906,117 · +20.3%
- By 2050
- 1,000,476 · +32.9%
- By 2075
- 1,197,520 · +59.0%
- By 2100
- 1,271,518 · +68.9%
Race, ethnicity, and origin ACS 2023
- Neighborhood character
- Diverse neighborhood (Simpson 0.68)
- Race & ethnicity
- Hispanic / Latino 42% White 36% Two or more races 16% Black 15% Asian 2%
- Hispanic origin (detail)
- Mexican 7% Puerto Rican 22% Cuban 2% Dominican 1%
- Common ancestry
- Hispanic 5% Romanian 3% Lithuanian 1%
- Foreign-born
- 18% · Canada, Jamaica
- Languages at home
- 55% English-only · Spanish 35% French/Haitian/Cajun 6% Other Indo-European 2%
Political lean MEDSL · Polk
- 2024 margin
- Strong R (+20.7) · D 39.2% · R 59.9%
- 2008→2024 swing
- -14.6pp toward R · 2008: -6.1pp · 2024: -20.7pp
- All cycles
- 2024: R+20.7 2020: R+14.4 2016: R+14.1 2012: R+6.8 2008: R+6.1
Not yet ingested
- Civics
- —
Market trends
- HPI YoY
- ▼ -131.62%
- Current HPI
- 256.8165
- Rent YoY
- ▼ -2.73%
- Metro
- Lakeland-Winter Haven, FL
- State GDP YoY
- ▲ 3.28%
- F500 in state
- 36
Industry mix (Fortune 500 HQ in FL)
| Industry | F500 HQs | Revenue |
|---|---|---|
| Industrial Technology | 2 | $29B |
|
||
| Insurance | 2 | $17B |
|
||
| Retail | 1 | $60B |
|
||
| Technology Distribution | 1 | $58B |
|
||
| Homebuilding | 1 | $35B |
|
||
| Technology Manufacturing | 1 | $35B |
|
||
Price history
-35.4% since first listed6 events — show timeline
- 2026-03-27 Pending — Stellar MLS as Distributed by MLS Grid
- 2026-03-20 Price Changed $285,000 Stellar MLS as Distributed by MLS Grid
- 2026-03-09 Price Changed $350,000 Stellar MLS as Distributed by MLS Grid
- 2026-02-28 Price Changed $358,000 Stellar MLS as Distributed by MLS Grid
- 2026-02-21 Price Changed $363,990 Stellar MLS as Distributed by MLS Grid
- 2026-01-20 Listed $440,990 Stellar MLS as Distributed by MLS Grid
Property tax history
+40.4%/yrLatest (2025): $8,327 · +0.7% YoY. Source: county tax records.
Cash-flow waterfall
monthlySold comps — $/sqft
last 12 mo · ≤1 miLoading sold comps…