 🏷️ Likely Rental
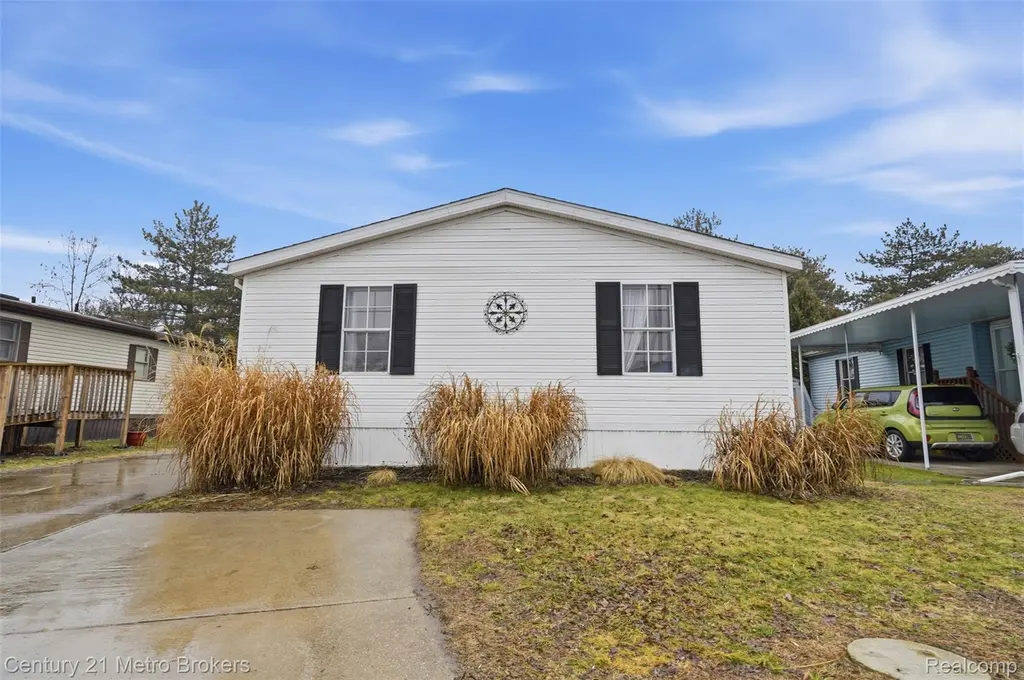
3009 Bay View Dr · Fenton, MI
Flood risk No data
- FEMA flood zone
- —
- Chance of flooding over 30 yrs
- —
- Est. flood insurance / yr
- —
Fire risk No data
- Est. fire insurance / yr
- —
Heat risk No data
- Hot days now (above threshold)
- —
- Hot days in 30 yrs
- —
Wind risk No data
- Chance of severe wind over 30 yrs
- —
Air-quality risk No data
- Unhealthy air days now
- —
- Unhealthy air days in 30 yrs
- —
Risk factors via First Street. Map © Google.
Why this score? — see what drove the B grade
The composite is a weighted blend of 9 inputs, each scored 0–100. Each bar is that input's sub-score; the figure is the points it added to the 100-point composite (weight × sub-score).
- Cash flow +30.0/30.0
- 1% rule +10.0/10.0
- DSCR +10.0/10.0
- ARV discount +7.5/15.0
- Schools +4.2/10.0
- Livability +3.9/5.0
- Rent growth +3.1/5.0
- Condition / age +2.8/5.0
- Appreciation +0.0/10.0
$42,000
🖨 Deal sheet 📄 Offer letter ✓ Due diligence
Listing remarks MLS
Welcome to Bay View Drive! This adorable 3- bedroom , 2-bath home offers about 1,200 sq. ft. of living space in East Bay, a quiet and friendly community with shared lake access! Located just off Lake Ponemah , a charming all sports lake nestled north-northwest Fenton. Perfect for someone who is looking for an affordable place to call home while still enjoying the perks of lake living. * Subject to parks approval * Lot Rent-$850 per month
Key facts
- Shared lake access
- All sports lake
- Quiet community
Tags
Neighborhood map
What this means for you Summary
Snapshot
- This is a 3-bed/2.0-bath single-family listed at $42k. Condition is rated average.
Deal economics
- At list price, monthly cash flow is $990 ($12k/yr) — positive.
- The deal already cash-flows at list — no discount required.
- Meets the 1% rule at list price ($2k rent vs $42k).
- Recommended offer: $39k (6.0% below list) — sets the bar for market timing.
- Cap rate 34.6% vs local median 3.0% in Fenton — top-decile yield for the area; either an underpriced asset or a hidden risk that comps aren't pricing in. Stress-test before assuming the spread holds.
Location & tenants
- Location reads 77/100 on livability (#130 in MI, #3,197 nationally) — a middle-class / working-renter tenant base. Strengths: cost of living A+, housing A+, health & safety A-; Watch: amenities F, commute F.
- Fenton Area Public Schools (suburban): math 38% / reading 57% proficiency, ranked #112 of 540 in MI (top 21%) — families likely to look elsewhere, expect single-tenant / working-renter base with shorter leases.
- Market conditions: Rents rising (+2.6%/yr); 311 active listings in the ZIP; 5 comparable units currently listed for rent nearby; rentals leasing fast (median 2d on market — plan ~1-2 weeks tenant-placement turnaround); solid renter incomes; 419 units permitted in Genesee County in 2024 (68 in 5+ unit buildings).
Forward outlook
- Local home prices are declining (-3.0%/yr); year-one equity from $290 of loan paydown is wiped out by about $1k of value loss. Plan a longer hold.
- Genesee County population projected at -27% by 2050 — secular population decline; favor cash flow + early exit over multi-decade hold.
- At projected returns (-3.0% appreciation + 2.6% rent growth), your $12k cash investment doubles in ~2 years — after that, you're playing with house money.
Negotiation context
- It's been on market 66 days — a 6% lower offer ($39k) is reasonable based on typical stale-listing flexibility.
- 2 sale attempts; this cycle's ask has dropped $17k (29%) from the opening price — seller is motivated, your offer sets the floor, not the list.
Questions for the listing agent
- It's been on market 66 days. Have you received any prior offers? Is the seller open to a 6% concession, seller financing, or rate buy-down credit?
- Why hasn't it sold? Are there any deal-killer items the seller is aware of (foundation, flood, title, zoning, code violations)?
- Is there a deadline driving the sale (1031 exchange, divorce, estate, relocation)? That informs how much negotiation room exists.
- Schools are B-rated — typically a magnet for longer-tenancy family renters. What's the average tenant stay here, and is there a school-zone premium baked into asking?
- What's the average days-on-market for RENTAL listings here right now (not sales)? A rising rental-DOM trend means longer vacancies and softer asking-rent achievability than the comps imply.
- What's the recent tenant-quality profile in this submarket — average credit score on applications, eviction rate, late-payment / NSF rate, and stable-employment percentage? A property-management company in the area should have these aggregated.
- How much new for-sale + rental construction is in the pipeline within 1–3 miles? Heavy new supply typically softens prices + rents 12–24 months out; constrained supply supports both.
Investment metrics
- 1% rule
- 3.86% ✓
- Cap rate
- 34.57%
- Cash-on-cash
- 100.99%
- DSCR
- 5.49
- GRM
- 2.2
CMA / ARV
- ARV (median comp)
- $296,545
- List price
- $42,000
- Delta
- -85.84%
- Verdict
- UNDERPRICED
- Comps
- 20 within 1.0 mi
Show comp detail 6 sales within ~0.75 mi
| Address | Dist | Beds/Ba | Sqft | Sold | Price | $/sf | Match |
|---|---|---|---|---|---|---|---|
| 3036 E Bay Dr Dr | 0.07mi | 3/2.0 | 1,344 (+12%) | 7mo | $76,000 | $57 | 70 |
| 14286 Eastview Dr | 0.26mi | 3/2.0 | 1,201 (+0%) | 23mo | $485,000 | $404 | 69 |
| 3188 Ponemah Dr | 0.44mi | 3/1.5 | 1,350 (+12%) | 1mo | $595,000 | $441 | 56 |
| 3087 Torrey Beach Dr | 0.17mi | 3/1.0 | 1,020 (-15%) | 15mo | $210,000 | $206 | 51 |
| 3127 Ponemah Dr | 0.37mi | 3/2.0 | 1,291 (+8%) | 24mo | $342,000 | $265 | 50 |
| 3187 Ponemah Dr | 0.45mi | 3/1.0 | 1,260 (+5%) | 23mo | $220,000 | $175 | 48 |
Match score weights: distance 35% · size 25% · config 20% · recency 20%. Top-matched comps best support the ARV.
Projected returns pro-forma
-3.0% appreciation · 2.59% rent growth · sell at horizon
- IRR
- —
- Equity multiple
- 5.73×
- Total profit
- $55,587
- Equity at exit
- $6,262
- IRR
- —
- Equity multiple
- 11.80×
- Total profit
- $126,962
- Equity at exit
- $3,631
Cash invested: $11,760 (down + closing). Projections, not guarantees.
Landlord ↔ Tenant lean methodology
- Overall (STATE)
- 62 Landlord-Friendly
- State Michigan
- 62 Landlord-Friendly · EVEN
- County
- — inherits STATE
- City
- — inherits STATE
ZIP-level market 48430
- Rents YoY
- 2.6%
- Active inventory
- 311
- Price-to-rent
- 2.2×
Monthly cashflow live
- Estimated rent
- $1,620 high interval (Pro) →
- Mortgage (P&I)
- −$220
- Tax est. 1.5%
- −$52 /mo · $630/yr
- Insurance
- −$18
- HOA
- −$0
- Vacancy / Maint / Mgmt
- −$340
- Net cashflow
- $990
Break-even live
UW: 25.0% down · 7.5% · 30yr · 1.5% tax · 5.0% vac · 8.0% maint · 8.0% mgmt
Financing live
Cash to close
- Down payment
- $10,500
- Closing costs
- $1,260
- Reserves months
- —
- Total cash needed
- —
Loan-product check · same deal, 3 products live
Conventional
25% down · 7.5% · 30yr
- Down + closing
- —
- Monthly P&I
- —
- Monthly cashflow
- —
- DSCR
- —
- Eligible?
- —
Personal DTI + credit; lowest rate.
DSCR
20% down · 8.5% · 30yr
- Down + closing
- —
- Monthly P&I
- —
- Monthly cashflow
- —
- DSCR
- —
- Eligible?
- —
No personal income docs; deal must DSCR.
Hard money
10% down · 12.0% · 12mo
- Down + closing
- —
- Monthly P&I
- —
- Monthly cashflow
- —
- DSCR
- —
- Eligible?
- —
Short-term bridge; refi at stabilization.
Rent comps 5 comps
| Address | Beds | Baths | Sqft | Rent | $/sqft | DOM | Units | Dist |
|---|---|---|---|---|---|---|---|---|
| 2100 Georgetown Pkwy Fenton, MI | 2.0 | 2.0 | 1130 | $1,340 | $1.19 | 1d | 27 | 0.69mi |
| 3200 Foley Glen Dr Fenton, MI | 1.0–2.0 | 1.0–2.0 | 1137 | $1,828 | $1.61 | 1d | 5 | 0.93mi |
| 1024 North Rd Fenton, MI | 1.0–2.0 | 1.0–2.0 | 815 | $1,400 | $1.72 | 43d | 3 | 0.94mi |
| 1024 North Rd Fenton, MI | 1.0–2.0 | 1.0–2.0 | 815 | $1,400 | $1.72 | 1d | 1 | 0.94mi |
| 3800 Arbor Dr Fenton, MI | 2.0 | 1.0–2.0 | 762 | $1,749 | $2.29 | 1d | 1 | 1.16mi |
Listing history 19 events
-
2026-06-18days on market $42,000 Active 66 DOM
-
2026-06-17days on market $42,000 Active 65 DOM
-
2026-06-16days on market $42,000 Active 64 DOM
-
2026-06-15days on market $42,000 Active 63 DOM
-
2026-06-13days on market $42,000 Active 61 DOM
-
2026-06-09days on market $42,000 Active 57 DOM
-
2026-06-08days on market $42,000 Active 56 DOM
-
2026-06-07days on market $42,000 Active 55 DOM
-
2026-06-04days on market $42,000 Active 52 DOM
-
2026-06-02days on market $42,000 Active 50 DOM
-
2026-06-02price $42,000 Active 49 DOM
-
2026-06-01days on market $45,000 Active 49 DOM
-
2026-05-31days on market $45,000 Active 48 DOM
-
2026-05-13price $45,000 444-char remark
Show marketing remark (445 chars)
Welcome to Bay View Drive! This adorable 3- bedroom , 2-bath home offers about 1,200 sq. ft. of living space in East Bay, a quiet and friendly community with shared lake access! Located just off Lake Ponemah , a charming all sports lake nestled north-northwest Fenton. Perfect for someone who is looking for an affordable place to call home while still enjoying the perks of lake living. * Subject to parks approval * Lot Rent-$850 per month
-
2026-05-13price $45,000 445-char remark
Show marketing remark (445 chars)
Welcome to Bay View Drive! This adorable 3- bedroom , 2-bath home offers about 1,200 sq. ft. of living space in East Bay, a quiet and friendly community with shared lake access! Located just off Lake Ponemah , a charming all sports lake nestled north-northwest Fenton. Perfect for someone who is looking for an affordable place to call home while still enjoying the perks of lake living. * Subject to parks approval * Lot Rent-$850 per month
-
2026-04-20price $49,000 444-char remark
Show marketing remark (445 chars)
Welcome to Bay View Drive! This adorable 3- bedroom , 2-bath home offers about 1,200 sq. ft. of living space in East Bay, a quiet and friendly community with shared lake access! Located just off Lake Ponemah , a charming all sports lake nestled north-northwest Fenton. Perfect for someone who is looking for an affordable place to call home while still enjoying the perks of lake living. * Subject to parks approval * Lot Rent-$850 per month
-
2026-04-20price $49,000 445-char remark
Show marketing remark (445 chars)
Welcome to Bay View Drive! This adorable 3- bedroom , 2-bath home offers about 1,200 sq. ft. of living space in East Bay, a quiet and friendly community with shared lake access! Located just off Lake Ponemah , a charming all sports lake nestled north-northwest Fenton. Perfect for someone who is looking for an affordable place to call home while still enjoying the perks of lake living. * Subject to parks approval * Lot Rent-$850 per month
-
2026-04-13$59,000 Active 445-char remark
Show marketing remark (445 chars)
Welcome to Bay View Drive! This adorable 3- bedroom , 2-bath home offers about 1,200 sq. ft. of living space in East Bay, a quiet and friendly community with shared lake access! Located just off Lake Ponemah , a charming all sports lake nestled north-northwest Fenton. Perfect for someone who is looking for an affordable place to call home while still enjoying the perks of lake living. * Subject to parks approval * Lot Rent-$850 per month
-
2026-04-09$59,000 Active 444-char remark
Show marketing remark (444 chars)
Welcome to Bay View Drive! This adorable 3- bedroom , 2-bath home offers about 1,200 sq. ft. of living space in East Bay, a quiet and friendly community with shared lake access! Located just off Lake Ponemah , a charming all sports lake nestled north-northwest Fenton. Perfect for someone who is looking for an affordable place to call home while still enjoying the perks of lake living. * Subject to parks approval * Lot Rent-$850 per month
ⓘ Source: listings_history table (triggers on properties + properties_extension) + one-shot
backfill from property_details.listing_events for pre-trigger history.
Nearby sold comps map
Loading sold comps map…
Walkable amenities ~0.75 mi
Loading nearby amenities…
Taxation est. · year 1
- Rental income
- $19,442
- − Mortgage interest
- −$2,353
- − Property taxes
- −$630
- − Insurance
- −$210
- − Repairs & maintenance
- −$1,555
- − Management
- −$1,555
- − Depreciation
- −$1,222
- Taxable income
- $11,917
- Est. tax owed @ 24.0%
- −$2,860
- After-tax cash flow
- $9,016/yr
For passive investors: Depreciation is non-cash, so a rental often shows a tax loss while cash-flowing — sheltering income. Rental losses are passive: they offset passive income freely, and up to $25,000/yr can offset ordinary (W-2) income if you actively participate and your MAGI is under $100k (phasing out to $0 by $150k); unused losses carry forward. On sale, claimed depreciation is recaptured at up to 25%, and gains may owe capital-gains tax (a 1031 exchange can defer both). Figures are a year-1 estimate at your 24.0% rate — not tax advice; consult a CPA.
Condition & rehab AI · 12 photos
This 3-bedroom, 2-bath home in East Bay, Fenton, MI, requires moderate repairs and maintenance to improve its condition and value. Key areas for attention include the deck, exterior siding, and interior walls. With some updates, it could be a great investment for both resale and rental.
Repairs flagged
- Major deck — rotting wood
- Moderate exterior siding — some discoloration
Value-add opportunities
- Both paint interior walls — enhances curb appeal and interior aesthetics
- Both repair deck — improves functionality and enhances curb appeal
- Both trim exterior siding — enhances curb appeal and improves home value
Renovation cost estimate screening
| Repair item | Severity | Est. cost |
|---|---|---|
| deck · rotting wood | Major | $15,000–50,000 |
| exterior siding · some discoloration | Moderate | $3,000–15,000 |
| Total estimated repair cost · 2 items | $18,000–65,000 |
Value-add ROI direction
- Both paint interior walls — enhances curb appeal and interior aesthetics ↑
- Both repair deck — improves functionality and enhances curb appeal ↑
- Both trim exterior siding — enhances curb appeal and improves home value ↑
ⓘ Cost ranges are severity-bucket heuristics (US national rule-of-thumb). Get contractor quotes + a written scope before underwriting a rehab budget.
Schools (NCES district)
- District
- Fenton Area Public Schools
- NCES district ID
- 2614250
- Math proficiency
- 38% ▼ -7.00%
- Reading proficiency
- 57% ▼ -2.00%
- Median HH income
- $60,377
- Composite
- 41.63/100
- National rank
- #3426
- State rank
- #112 of 540 in MI
Livability — Fenton
- Score
- 77/100
- State rank
- #130
- US rank
- #3197
Category grades
Schools grade is shown separately in the Schools card above.
Census & demographics
- County
- Livingston County · 121,626 people
- City population
- 39,309
- Metro
- Detroit-Warren-Dearborn, MI
- Population (ZIP)
- 39,309
- Household income
- $100,193
- Rent vs Own
- Severe rent burden
- 642.0
Population outlook (Genesee County) Hauer SSP2
- Today (2025)
- 381,312 people
- By 2030
- 362,731 · -4.9%
- By 2040
- 321,550 · -15.7%
- By 2050
- 279,212 · -26.8%
- By 2075
- 193,336 · -49.3%
- By 2100
- 128,118 · -66.4%
Race, ethnicity, and origin ACS 2023
- Neighborhood character
- Predominantly White (91%)
- Race & ethnicity
- White 91% Two or more races 4% Hispanic / Latino 3% Asian 1% Black 1%
- Common ancestry
- Romanian 10% Lithuanian 5% Slovak 3%
- Foreign-born
- 2% · Canada
- Languages at home
- 97% English-only · Spanish 1% Other Asian/Pacific 1% Other Indo-European 1%
Political lean MEDSL · Genesee
- 2024 margin
- Toss-up / Even · D 51.4% · R 47.2% · Other 1.4%
- 2008→2024 swing
- -28.3pp toward R · 2008: 32.5pp · 2024: 4.2pp
- All cycles
- 2024: D+4.2 2020: D+9.3 2016: D+9.5 2012: D+28.2 2008: D+32.5
Not yet ingested
- Civics
- —
Market trends
- HPI YoY
- ▼ -298.66%
- Current HPI
- 238.8371
- Rent YoY
- ▲ 2.59%
- Metro
- Detroit-Warren-Dearborn, MI
- State GDP YoY
- ▲ 1.37%
- F500 in state
- 28
Industry mix (Fortune 500 HQ in MI)
| Industry | F500 HQs | Revenue |
|---|---|---|
| Automotive Parts | 3 | $48B |
|
||
| Automotive | 2 | $372B |
|
||
| Chemicals | 1 | $45B |
|
||
| Automotive Retail | 1 | $29B |
|
||
| Healthcare / Medical Devices | 1 | $23B |
|
||
| Automotive Technology | 1 | $20B |
|
||
Price history
-23.7% since first listed6 events — show timeline
- 2026-05-13 Price Changed $45,000 MiRealSource-MiMLS
- 2026-05-13 Price Changed $45,000 REALCOMP
- 2026-04-20 Price Changed $49,000 MiRealSource-MiMLS
- 2026-04-20 Price Changed $49,000 REALCOMP
- 2026-04-13 Listed $59,000 REALCOMP
- 2026-04-09 Listed $59,000 MiRealSource-MiMLS
Cash-flow waterfall
monthlySold comps — $/sqft
last 12 mo · ≤1 miLoading sold comps…