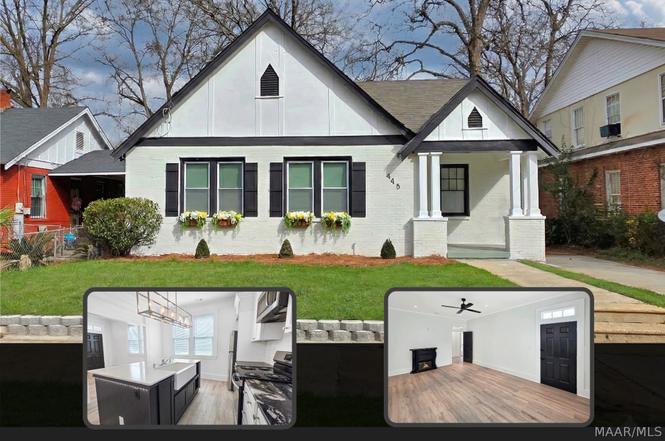
445 Earl Pl · Montgomery, AL
Flood risk 4/10 · Minor
- FEMA flood zone
- X (unshaded)
- Chance of flooding over 30 yrs
- 0.2%
- Est. flood insurance / yr
- $507 – $1,088
Fire risk 1/10 · Minimal
- Est. fire insurance / yr
- $916 – $1,700
Heat risk 7/10 · Major
- Hot days now (above 107°F)
- 7 days/yr
- Hot days in 30 yrs
- 20 days/yr
Wind risk 8/10 · Major
- Chance of severe wind over 30 yrs
- 80.0%
Air-quality risk 3/10 · Minor
- Unhealthy air days now
- 4 days/yr
- Unhealthy air days in 30 yrs
- 4 days/yr
Risk factors via First Street. Map © Google.
Why this score? — see what drove the D+ grade
The composite is a weighted blend of 9 inputs, each scored 0–100. Each bar is that input's sub-score; the figure is the points it added to the 100-point composite (weight × sub-score).
- Cash flow +22.2/30.0
- DSCR +7.1/10.0
- ARV discount +5.7/15.0
- 1% rule +4.4/10.0
- Livability +3.2/5.0
- Rent growth +2.5/5.0
- Condition / age +2.5/5.0
- Schools +1.7/10.0
- Appreciation +0.0/10.0
$145,000
🖨 Deal sheet 📄 Offer letter ✓ Due diligence
Listing remarks
* * HOME QUALIFIES FOR 100% CONVENTIONAL FINANCING * * NEW ROOF * * NEW WATER HEATER * * Experience the perfect blend of historic Garden District charm and high-end modern luxury in this stunningly reimagined Tudor-style cottage. From the moment you arrive, the crisp high-contrast exterior and brand-new privacy fence set the stage for a home that has been transformed with no detail overlooked. Step inside to find seamless new vinyl plank flooring flowing through an open-concept layout anchored by a chef’s dream kitchen. This culinary space is a true showstopper, boasting a sophisticated mix of new quartz and granite countertops, custom cabinetry, and a deep farmhouse sink. Mo
Key facts
- 4,791 sq ft lot
- Parking
- Built 1930
Neighborhood map
What this means for you Summary
Snapshot
- This is a 3-bed/1.0-bath single-family listed at $145k.
Deal economics
- At list price, monthly cash flow is $235 ($3k/yr) — positive.
- The deal already cash-flows at list — no discount required.
- To meet the 1% rule (rent ≥ 1% of price), the offer needs to be $137k (5.7% below list).
- Recommended offer: $137k (5.7% below list) — sets the bar for 1% rule.
- Cap rate 8.2% vs local median 6.0% in Montgomery — top-decile yield for the area; either an underpriced asset or a hidden risk that comps aren't pricing in. Stress-test before assuming the spread holds.
Location & tenants
- Location reads 65/100 on livability (#138 in AL) — a middle-class / working-renter tenant base. Strengths: cost of living A+, housing A+; Watch: schools C-, employment D, crime F.
- Montgomery County (urban): math 9% / reading 31% proficiency, ranked #106 of 129 in AL (top 82%) — low school quality limits family demand, transient renter base, plan for 1-2y turnover; 70% free/reduced lunch — lower-income household profile, screen leases tightly.
- Market conditions: 53 active listings in the ZIP; 36 comparable units currently listed for rent nearby; rentals lingering (median 44d on market — plan ~5-8 weeks vacancy on turnover, expect pricing pressure); 50% of comp listings sitting > 30 days — soft ceiling on asking rent; lower-income renter base — watch delinquency; 460 units permitted in Montgomery County in 2024 (37 in 5+ unit buildings).
- At $1,368/mo this rent would consume 49% of the median local household income ($34k/yr) (locally 641% of renters already pay >50% of income on rent) — very limited rent-growth headroom before tenants either downsize or default.
Forward outlook
- Local home prices are declining (-3.0%/yr); year-one equity from $1k of loan paydown is wiped out by about $4k of value loss. Plan a longer hold.
- Montgomery County population projected to shrink 8% by 2050 — rents likely to lag national; underwrite the cash flow, not the appreciation.
Negotiation context
- It's been on market 50 days — a 3% lower offer ($141k) is reasonable based on typical stale-listing flexibility.
- 3 sale attempts with the ask held roughly flat each time — persistent listings suggest the price (not the market) is what's stuck; bring a comps-based counter.
- Current owner paid $20k; list at $145k implies a 625% gain — meaningful room to come down on a strong offer.
Risks & watch-outs
- Watch-outs: built in 1930 — expect roof / HVAC / electrical / plumbing capex.
- Climate carrying-cost: severe wind risk, 80% chance of damaging wind over 30y; extreme-heat days projected 7→20/yr by 2055 (HVAC capex compounding) — expect insurance premiums to compound above CPI over the hold.
Questions for the listing agent
- It's been on market 50 days. Have you received any prior offers? Is the seller open to a 6% concession, seller financing, or rate buy-down credit?
- Built in 1930 — when were the roof, HVAC, electrical panel, plumbing, and water heater last replaced?
- Is there a deadline driving the sale (1031 exchange, divorce, estate, relocation)? That informs how much negotiation room exists.
- Crime grade is F in this area — have there been break-ins, vandalism, or insurance claims at this property in the last 3 years? What carrier currently insures it and at what premium?
- The area grade is low — what's the realistic commute time and amenity access for the typical tenant pool here? Any planned neighborhood developments (good or bad) we should know about?
- What's the average days-on-market for RENTAL listings here right now (not sales)? A rising rental-DOM trend means longer vacancies and softer asking-rent achievability than the comps imply.
- What's the recent tenant-quality profile in this submarket — average credit score on applications, eviction rate, late-payment / NSF rate, and stable-employment percentage? A property-management company in the area should have these aggregated.
- How much new for-sale + rental construction is in the pipeline within 1–3 miles? Heavy new supply typically softens prices + rents 12–24 months out; constrained supply supports both.
Investment metrics
- 1% rule
- 0.94% ✗
- Cap rate
- 8.24%
- Cash-on-cash
- 6.95%
- DSCR
- 1.31
- GRM
- 8.8
CMA / ARV
- ARV (on-the-fly)
- $139,520
- Comps found
- 12
Show comp detail 12 sales within ~0.75 mi
| Address | Dist | Beds/Ba | Sqft | Sold | Price | $/sf | Match |
|---|---|---|---|---|---|---|---|
| 445 Earl Pl | 0.00mi | 3/2.0 | 1,280 (0%) | 0mo | $145,000 | $113 | 96 |
| 1315 S Mcdonough St | 0.15mi | 3/1.5 | 1,379 (+8%) | 4mo | $203,135 | $147 | 75 |
| 466 Earl Pl | 0.05mi | 2/1.0 (-1) | 1,176 (-8%) | 9mo | $20,000 | $17 | 72 |
| 323 Finley Ave | 0.15mi | 3/2.0 | 1,375 (+7%) | 12mo | $150,000 | $109 | 66 |
| 1549 S Court St | 0.40mi | 2/1.0 (-1) | 1,315 (+3%) | 7mo | $136,000 | $103 | 66 |
| 961 S Lawrence St | 0.35mi | 3/1.0 | 1,426 (+11%) | 1mo | $27,000 | $19 | 64 |
| 24 Flood St | 0.46mi | 2/1.0 (-1) | 1,170 (-9%) | 1mo | $33,000 | $28 | 58 |
| 700 Genetta Ct | 0.46mi | 3/2.0 | 1,148 (-10%) | 6mo | $75,000 | $65 | 53 |
| 1924 Graham St | 0.39mi | 3/2.0 | 1,402 (+10%) | 11mo | $213,100 | $152 | 52 |
| 1142 S Lawrence St | 0.28mi | 2/1.0 (-1) | 1,460 (+14%) | 13mo | $75,000 | $51 | 47 |
| 629 S Mcdonough St | 0.67mi | 3/2.0 | 1,472 (+15%) | 0mo | $165,000 | $112 | 39 |
| 1206 Woodward Ave | 0.75mi | 3/2.0 | 1,452 (+13%) | 8mo | $239,000 | $165 | 32 |
Match score weights: distance 35% · size 25% · config 20% · recency 20%. Top-matched comps best support the ARV.
Projected returns pro-forma
-3.0% appreciation · 3.0% rent growth · sell at horizon
- IRR
- -5.7%
- Equity multiple
- 0.79×
- Total profit
- $-8,596
- Equity at exit
- $21,620
- IRR
- 3.9%
- Equity multiple
- 1.28×
- Total profit
- $11,492
- Equity at exit
- $12,537
Cash invested: $40,600 (down + closing). Projections, not guarantees.
Landlord ↔ Tenant lean methodology
- Overall (STATE)
- 90 Strongly Landlord-Friendly
- State Alabama
- 90 Strongly Landlord-Friendly · R+15
- County
- — inherits STATE
- City
- — inherits STATE
ZIP-level market 36104
- Active inventory
- 53
- Price-to-rent
- 8.8×
Monthly cashflow live
- Estimated rent
- $1,368 high interval (Pro) →
- Mortgage (P&I)
- −$760
- Tax from tax record
- −$25 /mo · $297/yr
- Insurance
- −$60
- HOA
- −$0
- Vacancy / Maint / Mgmt
- −$287
- Net cashflow
- $235
Break-even live
UW: 25.0% down · 7.5% · 30yr · 1.5% tax · 5.0% vac · 8.0% maint · 8.0% mgmt
Financing live
Cash to close
- Down payment
- $36,250
- Closing costs
- $4,350
- Reserves months
- —
- Total cash needed
- —
Loan-product check · same deal, 3 products live
Conventional
25% down · 7.5% · 30yr
- Down + closing
- —
- Monthly P&I
- —
- Monthly cashflow
- —
- DSCR
- —
- Eligible?
- —
Personal DTI + credit; lowest rate.
DSCR
20% down · 8.5% · 30yr
- Down + closing
- —
- Monthly P&I
- —
- Monthly cashflow
- —
- DSCR
- —
- Eligible?
- —
No personal income docs; deal must DSCR.
Hard money
10% down · 12.0% · 12mo
- Down + closing
- —
- Monthly P&I
- —
- Monthly cashflow
- —
- DSCR
- —
- Eligible?
- —
Short-term bridge; refi at stabilization.
Rent comps 36 comps
| Address | Beds | Baths | Sqft | Rent | $/sqft | DOM | Units | Dist |
|---|---|---|---|---|---|---|---|---|
| 1259 S Lawrence St Montgomery, AL | 3.0 | 1.0 | 1728 | $1,300 | $0.75 | 44d | 1 | 0.20mi |
| 1301 S Perry St Unit A Montgomery, AL | 2.0 | 1.0 | 1100 | $950 | $0.86 | 13d | 1 | 0.27mi |
| 1020 S Lawrence St Montgomery, AL | 2.0 | 1.0 | 1711 | $2,000 | $1.17 | 13d | 1 | 0.29mi |
| 1314 S Court St Montgomery, AL | 2.0 | 2.0 | 1650 | $1,495 | $0.91 | 13d | 1 | 0.40mi |
| 24 Flood St Montgomery, AL | 2.0 | 1.0 | 1140 | $1,000 | $0.88 | 21d | 1 | 0.43mi |
| 519 Thorn Pl Montgomery, AL | 2.0 | 1.0 | 1632 | $650 | $0.40 | 21d | 1 | 0.47mi |
| 1919 Norman Bridge Ct Unit 1043838P Montgomery, AL | 4.0 | 3.0 | 1539 | $4,108 | $2.67 | 44d | 1 | 0.48mi |
| 22 W Cromwell St Montgomery, AL | 4.0 | 2.0 | 1645 | $1,350 | $0.82 | 21d | 1 | 0.48mi |
| 428 Thorn Pl Montgomery, AL | 2.0 | 1.0 | 1549 | $1,450 | $0.94 | 44d | 1 | 0.48mi |
| 105 Arlington Rd Unit B Montgomery, AL | 2.0 | 1.0 | 1100 | $925 | $0.84 | 44d | 1 | 0.68mi |
| 906 E Fairview Ave Unit 902 Montgomery, AL | 2.0 | 1.0 | 1100 | $995 | $0.90 | 21d | 1 | 0.74mi |
| 139 Mount Vernon Dr Unit A Montgomery, AL | 4.0 | 2.5 | 1700 | $1,000 | $0.59 | 44d | 1 | 0.74mi |
| 2727 Boultier St Montgomery, AL | 1.0–3.0 | 1.0–2.0 | 1070 | $1,582 | $1.48 | 13d | 3 | 0.84mi |
| 3235 Norman Bridge Rd Montgomery, AL | 3.0 | 1.0 | 1873 | $900 | $0.48 | 44d | 1 | 0.86mi |
| 1343 Felder Ave Montgomery, AL | 2.0 | 1.0 | 1000 | $1,095 | $1.09 | 13d | 1 | 0.89mi |
| 1347 Felder Ave Montgomery, AL | 2.0 | 1.0 | 1000 | $1,095 | $1.09 | 13d | 1 | 0.90mi |
| 3256 Montezuma Rd Montgomery, AL | 3.0 | 2.0 | 1515 | $1,450 | $0.96 | 44d | 1 | 0.92mi |
| 3338 S Hull St Montgomery, AL | 2.0 | 2.0 | 1311 | $1,150 | $0.88 | 21d | 1 | 0.96mi |
| 3357 Lexington Rd Montgomery, AL | 2.0 | 1.0 | 1200 | $1,175 | $0.98 | 13d | 1 | 1.03mi |
| 3369 Montezuma Rd Montgomery, AL | 3.0 | 1.0 | 1281 | $1,150 | $0.90 | 44d | 1 | 1.10mi |
| 1425 Blairwood Montgomery, AL | 3.0 | 2.0 | 1700 | $1,850 | $1.09 | 13d | 1 | 1.16mi |
| 3356 Audubon Rd Montgomery, AL | 2.0 | 1.5 | 1340 | $950 | $0.71 | 44d | 1 | 1.17mi |
| 2020 E 3rd St Montgomery, AL | 2.0 | 1.0 | 1186 | $750 | $0.63 | 21d | 1 | 1.17mi |
| 1450 Crenshaw Pl S Montgomery, AL | 3.0 | 2.0 | 1641 | $1,775 | $1.08 | 44d | 1 | 1.23mi |
| 207 Montgomery St Montgomery, AL | 1.0–2.0 | 1.0–2.0 | 890 | $1,785 | $2.01 | 13d | 4 | 1.26mi |
| 1008 Pelham St Montgomery, AL | 4.0 | 2.0 | 1288 | $1,300 | $1.01 | 44d | 1 | 1.26mi |
| 2205 E 5th St Montgomery, AL | 3.0 | 1.0 | 1020 | $800 | $0.78 | 44d | 1 | 1.32mi |
| 2226 Carter Hill Rd Montgomery, AL | 2.0 | 1.0 | 1506 | $905 | $0.60 | 44d | 1 | 1.34mi |
| 2000 Cherry St Montgomery, AL | 2.0 | 1.0 | 1106 | $950 | $0.86 | 44d | 1 | 1.38mi |
| 3445 Le Bron Rd Montgomery, AL | 4.0 | 1.0 | 1100 | $1,050 | $0.95 | 21d | 1 | 1.38mi |
| 3515 Norman Bridge Rd Unit A Montgomery, AL | 2.0 | 1.0 | 1150 | $1,150 | $1.00 | 44d | 1 | 1.39mi |
| 3544 Southmont Dr Montgomery, AL | 4.0 | 1.5 | 1774 | $1,300 | $0.73 | 21d | 1 | 1.44mi |
| 2045 Bullard St Unit 1043526P Montgomery, AL | 3.0 | 2.0 | 1797 | $2,198 | $1.22 | 44d | 1 | 1.47mi |
| 718 W Edgemont Ave Unit B Montgomery, AL | 2.0 | 1.0 | 875 | $800 | $0.91 | 21d | 1 | 1.47mi |
| 718 W Edgemont Ave Unit A Montgomery, AL | 3.0 | 1.0 | 875 | $875 | $1.00 | 44d | 1 | 1.47mi |
| 545 Clay St Montgomery, AL | 2.0 | 2.0 | 1104 | $1,050 | $0.95 | 44d | 1 | 1.48mi |
Listing history 11 events
-
2026-06-08days on market $145,000 Active 50 DOM
-
2026-06-07statusdays on market $145,000 Active 49 DOM
-
2026-04-16status Pending
-
2026-03-25historical Contingent
-
2026-03-07status Active
-
2026-03-05historical Contingent
-
2026-02-27$145,000 Active
-
2025-10-01status Pending
-
2025-09-30soldstatus $20,000 Closed
-
2025-08-31historical Contingent
-
2025-08-28$20,000 Active
ⓘ Source: listings_history table (triggers on properties + properties_extension) + one-shot
backfill from property_details.listing_events for pre-trigger history.
Tax reassessment forecast AL · Resets to sale price
- Current annual tax
- $297 · $25/mo
- Projected year-2 tax
- $594 · $50/mo
- Expected delta
- +$298/yr (+$25/mo · 100.3%)
ⓘ Screening estimate from a state-policy table — verify with the county assessor before closing.
Climate risk First Street
- Flood 4/10 Moderate FEMA zone X (unshaded) · 20% chance over 30 yrs
- Wildfire 1/10 Low
- Heat 7/10 Severe 7 d/yr ≥107°F today · 20 d/yr by 30 yrs out
- Wind 8/10 Severe 80% chance of damaging wind over 30 yrs
- Air quality 3/10 Moderate 4 unhealthy d/yr today · 4 by 30 yrs out
Nearby sold comps map
Loading sold comps map…
Walkable amenities ~0.75 mi
Loading nearby amenities…
Taxation est. · year 1
- Rental income
- $16,415
- − Mortgage interest
- −$8,122
- − Property taxes
- −$297
- − Insurance
- −$725
- − Repairs & maintenance
- −$1,313
- − Management
- −$1,313
- − Depreciation
- −$4,218
- Taxable income
- $427
- Est. tax owed @ 24.0%
- −$102
- After-tax cash flow
- $2,719/yr
For passive investors: Depreciation is non-cash, so a rental often shows a tax loss while cash-flowing — sheltering income. Rental losses are passive: they offset passive income freely, and up to $25,000/yr can offset ordinary (W-2) income if you actively participate and your MAGI is under $100k (phasing out to $0 by $150k); unused losses carry forward. On sale, claimed depreciation is recaptured at up to 25%, and gains may owe capital-gains tax (a 1031 exchange can defer both). Figures are a year-1 estimate at your 24.0% rate — not tax advice; consult a CPA.
Schools (NCES district)
- District
- Montgomery County
- NCES district ID
- 0102430
- Math proficiency
- 9% ▼ -21.00%
- Reading proficiency
- 31% ▼ -1.00%
- Median HH income
- $43,902
- Composite
- 17.24/100
- National rank
- #9093
- State rank
- #106 of 129 in AL
Livability — Montgomery
- Score
- 65/100
- State rank
- #138
- US rank
- #13416
Category grades
Schools grade is shown separately in the Schools card above.
Census & demographics
- Census place
- Montgomery, AL
- County
- Montgomery County · 190,016 people
- City population
- 175,913
- Metro
- Montgomery, AL
- Population (ZIP)
- 10,535
- Household income
- $33,823
- Rent vs Own
- Severe rent burden
- 641.0
Population outlook (Montgomery County) Hauer SSP2
- Today (2025)
- 224,008 people
- By 2030
- 221,460 · -1.1%
- By 2040
- 214,179 · -4.4%
- By 2050
- 204,912 · -8.5%
- By 2075
- 177,821 · -20.6%
- By 2100
- 145,134 · -35.2%
Race, ethnicity, and origin ACS 2023
- Neighborhood character
- Predominantly Black (72%)
- Race & ethnicity
- Black 72% White 20% Two or more races 6% Hispanic / Latino 2%
- Common ancestry
- Swedish 2% Russian 1% Lithuanian 1%
- Foreign-born
- 2% · Canada
- Languages at home
- 97% English-only · Spanish 1% Other Indo-European 1%
Political lean MEDSL · Montgomery
- 2024 margin
- Solid D (+30.7) · D 64.8% · R 34.1% · Other 1.1%
- 2008→2024 swing
- +11.5pp toward D · 2008: 19.2pp · 2024: 30.7pp
- All cycles
- 2024: D+30.7 2020: D+31.5 2016: D+26.2 2012: D+24.3 2008: D+19.2
Not yet ingested
- Civics
- —
Market trends
- HPI YoY
- ▼ -101.13%
- Current HPI
- 27.2384
- Rent YoY
- —
- Metro
- Montgomery, AL
- State GDP YoY
- ▲ 2.94%
- F500 in state
- 4
Industry mix (Fortune 500 HQ in AL)
| Industry | F500 HQs | Revenue |
|---|---|---|
| Financial Services | 1 | $8B |
|
||
| Healthcare | 1 | $5B |
|
||
Price history
+625.0% since first listed9 events — show timeline
- 2026-04-16 Pending — MAAR
- 2026-03-25 Contingent — MAAR
- 2026-03-07 Relisted — MAAR
- 2026-03-05 Contingent — MAAR
- 2026-02-27 Listed $145,000 MAAR
- 2025-10-01 Pending — MAAR
- 2025-09-30 Sold (MLS) $20,000 MAAR
- 2025-08-31 Contingent — MAAR
- 2025-08-28 Listed $20,000 MAAR
Property tax history
+4.3%/yrLatest (2025): $297 · +0.0% YoY. Source: county tax records.
Cash-flow waterfall
monthlySold comps — $/sqft
last 12 mo · ≤1 miLoading sold comps…