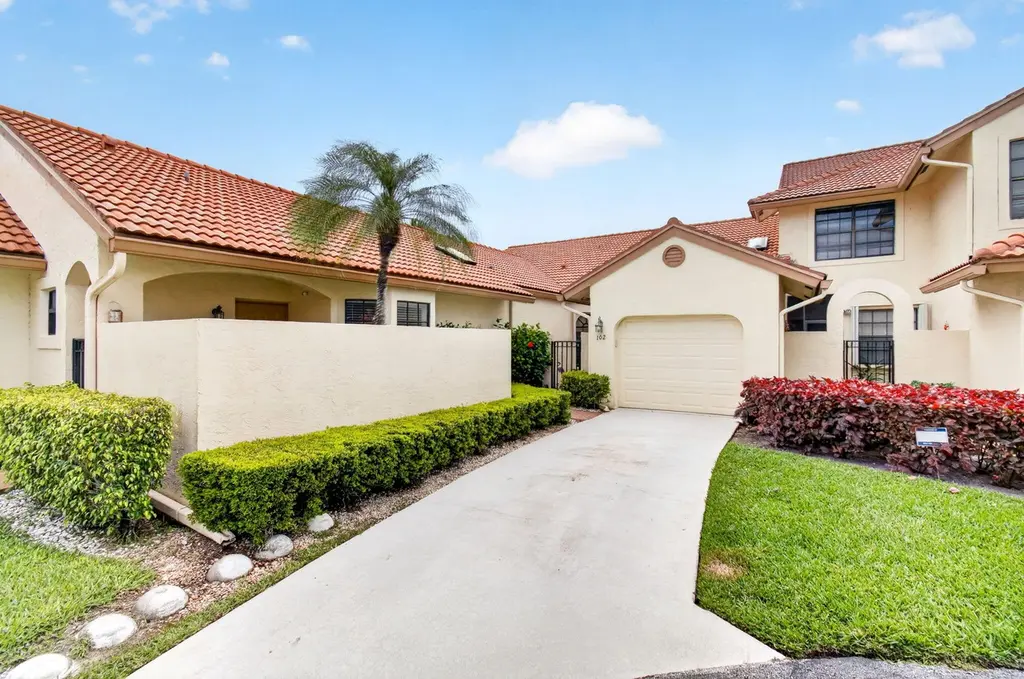
8316 Waterline Dr #102 · Boynton Beach, FL
Flood risk 1/10 · Minimal
- FEMA flood zone
- X (unshaded)
- Chance of flooding over 30 yrs
- 0.0%
- Est. flood insurance / yr
- $507 – $1,088
Fire risk 1/10 · Minimal
- Est. fire insurance / yr
- $947 – $1,759
Heat risk 9/10 · Severe
- Hot days now (above 106°F)
- 6 days/yr
- Hot days in 30 yrs
- 22 days/yr
Wind risk 10/10 · Severe
- Chance of severe wind over 30 yrs
- 99.0%
Air-quality risk 2/10 · Minimal
- Unhealthy air days now
- 0 days/yr
- Unhealthy air days in 30 yrs
- 2 days/yr
Risk factors via First Street. Map © Google.
Why this score? — see what drove the D grade
The composite is a weighted blend of 9 inputs, each scored 0–100. Each bar is that input's sub-score; the figure is the points it added to the 100-point composite (weight × sub-score).
- Cash flow +9.8/30.0
- ARV discount +7.5/15.0
- 1% rule +5.3/10.0
- Appreciation +5.1/10.0
- Schools +4.3/10.0
- Livability +3.6/5.0
- DSCR +2.8/10.0
- Rent growth +2.5/5.0
- Condition / age +2.5/5.0
$330,000
🖨 Deal sheet (PDF) 📄 Offer letter ✓ Due diligence
Listing remarks MLS
Bank addendum once offer is accepted. Seller chooses title and must hold escrow. Buyer pays doc stamps. 15 first look period ends 2/10/2012.
Key facts
- Custom cabinetry
- Lake view lot
- Clubhouse amenities
Tags
Property features AI
Finance
- Other: Pets allowed (possible pet restrictions); Located in a senior community
- HOA & community: HOA managed by GRS Management; Monthly HOA fee; Community amenities include pool (heated), fitness center, clubhouse, game room, billiard room, library, community room, bocce ball, pickleball and tennis courts, jogging path, sidewalks, management/manager on site, recreation facilities
Exterior
- Parking: Attached garage (1 garage space); Driveway; Covered parking space
- Security: Security system
- Utilities: Public water; Public sewer; Electricity available
- Home design: Villa (single-story); One level; Resale property; Faces east
- Construction: Stucco and CBS construction; Tile barrel roof; Slab foundation; Built as a villa
- Exterior features: Covered patio; Open patio; Screened patio; Deck; Glass-enclosed patio; Paved road access; Waterfront location
Interior
- Kitchen: Dishwasher; Electric range; Refrigerator; Garbage disposal; Electric water heater
- Bedrooms: 3 bedrooms on the main level
- Flooring: Tile flooring; Wood flooring
- Bathrooms: 2 full bathrooms on the main level
- Heating & cooling: Central heating (electric); Central air conditioning; Ceiling fans
- Interior features: Cathedral ceilings; Vaulted ceiling; High ceilings; Entrance foyer; Walk-in closets; Split bedroom layout; Custom mirrors; Roman tub
- Laundry & utility: Dedicated laundry room
Neighborhood map
What this means for you Summary
Snapshot
- This is a 3-bed/2.0-bath condo listed at $330k.
Deal economics
- At list price, monthly cash flow is $-213 ($-3k/yr) — negative.
- To cash-flow at today's rent, offer at most $292k (11.4% below list).
- Meets the 1% rule at list price ($3k rent vs $330k).
- Recommended offer: $292k (11.4% below list) — sets the bar for cash-flow.
- Cap rate 5.5% vs local median 4.3% in Boynton Beach — meaningfully above typical; check what's discounted (condition, days-on-market, listing class) to confirm the premium yield is real.
Location & tenants
- Location reads 72/100 on livability (#351 in FL) — a middle-class / working-renter tenant base. Strengths: housing A+, health & safety B+, cost of living B; Watch: amenities D+, crime D-, commute F.
- Palm Beach (suburban): math 46% / reading 53% proficiency, ranked #34 of 73 in FL (top 47%) — families likely to look elsewhere, expect single-tenant / working-renter base with shorter leases.
- Zoned schools: Crystal Lakes Elementary School (math 55% / reading 64%, grade B-, #690 of 2,144 statewide, top 34%, 788 students, 37% FRL); Christa Mcauliffe Middle School (math 63% / reading 63%, grade B+, #111 of 571 statewide, top 20%, 1,387 students, 35% FRL); Park Vista Community High School (math 43% / reading 64%, grade C-, #146 of 667 statewide, top 22%, 3,191 students, 28% FRL) — zoned schools average 34% FRL vs 52% district-wide (18 pts lower); this property's tenant base skews higher-income than the district average.
- Market conditions: 173 active listings in the ZIP; 30 comparable units currently listed for rent nearby; rentals at typical pace (median 21d on market — plan ~3-4 weeks tenant-placement turnaround); 3,974 units permitted in Palm Beach County in 2024 (1,012 in 5+ unit buildings).
Forward outlook
- In year one you build about $3k of equity ($2k loan paydown + $654 appreciation (0.2% local appreciation)).
- Palm Beach County population projected at +30% by 2050 — long-run rental-demand tailwind backs the buy-and-hold thesis.
- By year 9, paydown + projected appreciation supports a ~$33k cash-out refi (75% LTV) — recoverable capital for the next deal without selling this one.
Negotiation context
- It's been on market 55 days — a 3% lower offer ($320k) is reasonable based on typical stale-listing flexibility.
- 2 sale attempts since 14y ago with the ask held roughly flat each time — persistent listings suggest the price (not the market) is what's stuck; bring a comps-based counter.
- Current owner paid $108k; list at $330k implies a 206% gain — meaningful room to come down on a strong offer.
Risks & watch-outs
- Watch-outs: HOA is 26% of rent.
- Climate carrying-cost: severe wind risk, 99% chance of damaging wind over 30y; extreme-heat days projected 6→22/yr by 2055 (HVAC capex compounding) — expect insurance premiums to compound above CPI over the hold.
Questions for the listing agent
- What do current leases actually rent for vs. the listed asking? Can we see a recent rent roll and the last 12 months of T-12 income?
- It's been on market 55 days. Have you received any prior offers? Is the seller open to a 11% concession, seller financing, or rate buy-down credit?
- What does the HOA fee cover, when was the last increase, and are there any pending special assessments or reserve-fund shortfalls?
- Any open or pending special assessments — roof, HVAC, plumbing, elevator, façade? What's the per-unit balance and payoff schedule, and is the seller paying it off at close or rolling it to the buyer?
- Is there a deadline driving the sale (1031 exchange, divorce, estate, relocation)? That informs how much negotiation room exists.
- Crime grade is D in this area — have there been break-ins, vandalism, or insurance claims at this property in the last 3 years? What carrier currently insures it and at what premium?
- The area grade is low — what's the realistic commute time and amenity access for the typical tenant pool here? Any planned neighborhood developments (good or bad) we should know about?
- What's the average days-on-market for RENTAL listings here right now (not sales)? A rising rental-DOM trend means longer vacancies and softer asking-rent achievability than the comps imply.
- What's the recent tenant-quality profile in this submarket — average credit score on applications, eviction rate, late-payment / NSF rate, and stable-employment percentage? A property-management company in the area should have these aggregated.
- How much new apartment / multifamily construction is in the pipeline within 1–3 miles? Heavy new supply (>2% of stock underway) typically softens rents 12–24 months out; light construction supports rent growth.
Investment metrics
- 1% rule
- 1.03% ✓
- Cap rate
- 5.52%
- Cash-on-cash
- -2.77%
- DSCR
- 0.88
- GRM
- 8.1
CMA / ARV
No comps found within radius.
Projected returns pro-forma
0.2% appreciation · 3.0% rent growth · sell at horizon
- IRR
- -4.5%
- Equity multiple
- 0.79×
- Total profit
- $-19,737
- Equity at exit
- $99,103
- IRR
- 1.4%
- Equity multiple
- 1.15×
- Total profit
- $13,845
- Equity at exit
- $121,778
Cash invested: $92,400 (down + closing). Projections, not guarantees.
Landlord ↔ Tenant lean methodology
- Overall (STATE)
- 87 Strongly Landlord-Friendly
- State Florida
- 87 Strongly Landlord-Friendly · R+3
- County
- — inherits STATE
- City
- — inherits STATE
ZIP-level market 33472
- Home prices YoY
- 0.1%
- Active inventory
- 173
- Price-to-rent
- 8.1×
Monthly cashflow live
- Estimated rent
- $3,388 high interval (Pro) →
- Mortgage (P&I)
- −$1,731
- Tax from tax record
- −$151 /mo · $1,812/yr
- Insurance
- −$138
- HOA
- −$871
- Lot rent
- −$0
- Vacancy / Maint / Mgmt
- −$712
- Net cashflow
- $-213
Break-even live
Sensitivity live
| Price | -10% $-27 | -5% $-120 | +0% $-213 | +5% $-307 | +10% $-400 |
|---|---|---|---|---|---|
| Rent | -10% $-481 | -5% $-347 | +0% $-213 | +5% $-80 | +10% $54 |
| Rate | -1.0pp $-47 | -0.5pp $-130 | base $-213 | +0.5pp $-299 | +1.0pp $-386 |
UW: 25.0% down · 7.5% · 30yr · 1.5% tax · 5.0% vac · 8.0% maint · 8.0% mgmt
Financing live
Cash to close
- Down payment
- $82,500
- Closing costs
- $9,900
- Reserves months
- —
- Total cash needed
- —
Loan-product check · same deal, 3 products live
Conventional
25% down · 7.5% · 30yr
- Down + closing
- —
- Monthly P&I
- —
- Monthly cashflow
- —
- DSCR
- —
- Eligible?
- —
Personal DTI + credit; lowest rate.
DSCR
20% down · 8.5% · 30yr
- Down + closing
- —
- Monthly P&I
- —
- Monthly cashflow
- —
- DSCR
- —
- Eligible?
- —
No personal income docs; deal must DSCR.
Hard money
10% down · 12.0% · 12mo
- Down + closing
- —
- Monthly P&I
- —
- Monthly cashflow
- —
- DSCR
- —
- Eligible?
- —
Short-term bridge; refi at stabilization.
Rent comps 30 comps
| Address | Beds | Baths | Sqft | Rent | $/sqft | DOM | Units | Dist |
|---|---|---|---|---|---|---|---|---|
| 7888 Sonoma Springs Cir #105 Lake Worth, FL | 2.0 | 2.0 | 1105 | $2,200 | $1.99 | 26d | 1 | 0.37mi |
| 8082 Aberdeen Dr #102 Boynton Beach, FL | 2.0 | 2.0 | 1619 | $8,500 | $5.25 | 26d | 1 | 0.37mi |
| 6581 Marissa Cir Lake Worth, FL | 3.0 | 2.0 | 1414 | $3,300 | $2.33 | 21d | 1 | 0.41mi |
| 7856 Sonoma Springs Cir #205 Lake Worth, FL | 2.0 | 2.0 | 1105 | $2,100 | $1.90 | 1d | 1 | 0.43mi |
| 7840 Sonoma Springs Cir #103 Lake Worth, FL | 2.0 | 2.0 | 1105 | $2,200 | $1.99 | 26d | 1 | 0.48mi |
| 5945 Parkwalk Dr Boynton Beach, FL | 2.0 | 2.0 | 1178 | $2,500 | $2.12 | 24d | 1 | 0.51mi |
| 6143 Windlass Cir Boynton Beach, FL | 4.0 | 2.5 | 2245 | $4,200 | $1.87 | 21d | 1 | 0.52mi |
| 6731 Southport Dr Boynton Beach, FL | 3.0 | 2.0 | 1727 | $3,600 | $2.08 | 26d | 1 | 0.57mi |
| 7085 Merganser Ct Lake Worth, FL | 2.0 | 2.0 | 1155 | $2,110 | $1.83 | 3d | 1 | 0.71mi |
| 8520 Tourmaline Blvd Boynton Beach, FL | 4.0 | 2.0 | 1699 | $4,000 | $2.35 | 21d | 1 | 0.84mi |
| 7366 Ashley Shores Cir Lake Worth, FL | 3.0 | 2.5 | 1945 | $4,200 | $2.16 | 0d | 1 | 0.86mi |
| 7366 Ashley Shores Cir Lake Worth, FL | 3.0 | 2.5 | 1945 | $4,200 | $2.16 | 10d | 1 | 0.86mi |
| 6365 Lansdowne Cir Boynton Beach, FL | 3.0 | 2.0 | 1769 | $3,200 | $1.81 | 5d | 1 | 0.90mi |
| 7418 Wescott Ter Lake Worth, FL | 3.0 | 2.5 | 2170 | $3,250 | $1.50 | 10d | 1 | 0.95mi |
| 6836 Long Key St Lake Worth, FL | 3.0 | 2.5 | 1637 | $2,950 | $1.80 | 20d | 1 | 0.96mi |
| 9121 Paragon Way Boynton Beach, FL | 4.0 | 2.0 | 2154 | $4,950 | $2.30 | 26d | 1 | 1.00mi |
| 5537 Pebble Brook Ln Boynton Beach, FL | 3.0 | 2.0 | 1166 | $2,825 | $2.42 | 17d | 1 | 1.03mi |
| 5072 Arbor Glen Cir Lake Worth, FL | 3.0 | 2.0 | 1232 | $3,300 | $2.68 | 17d | 1 | 1.32mi |
| 9336 Water Course Way Boynton Beach, FL | 3.0 | 2.0 | 1779 | $3,600 | $2.02 | 26d | 1 | 1.33mi |
| 9336 Water Course Way Boynton Beach, FL | 3.0 | 2.0 | 1779 | $3,600 | $2.02 | 24d | 1 | 1.33mi |
| 8884 Shoal Creek Ln Boynton Beach, FL | 3.0 | 2.0 | 1936 | $4,750 | $2.45 | 1d | 1 | 1.44mi |
| 8884 Shoal Creek Ln Boynton Beach, FL | 3.0 | 2.0 | 1936 | $5,000 | $2.58 | 13d | 1 | 1.44mi |
| 8884 Shoal Creek Ln Boynton Beach, FL | 3.0 | 2.0 | 1936 | $4,900 | $2.53 | 26d | 1 | 1.44mi |
| 7218 Michigan Isle Rd Lake Worth, FL | 3.0 | 2.0 | 1656 | $3,500 | $2.11 | 16d | 1 | 1.44mi |
| 7218 Michigan Isle Rd Lake Worth, FL | 3.0 | 2.0 | 1656 | $3,500 | $2.11 | 17d | 1 | 1.44mi |
| 8657 Rosalie Ct Boynton Beach, FL | 4.0 | 2.0 | 2021 | $3,499 | $1.73 | 21d | 1 | 1.47mi |
| 9215 Sun Pointe Dr Boynton Beach, FL | 4.0 | 2.0 | 2142 | $4,650 | $2.17 | 26d | 1 | 1.47mi |
| 9215 Sun Pointe Dr Boynton Beach, FL | 4.0 | 2.0 | 2142 | $4,650 | $2.17 | 13d | 1 | 1.47mi |
| 7192 Summer Tree Dr Boynton Beach, FL | 2.0 | 2.0 | 1722 | $3,000 | $1.74 | 26d | 1 | 1.48mi |
| 9629 El Clair Ranch Rd Boynton Beach, FL | 4.0 | 2.0 | 2231 | $4,800 | $2.15 | 26d | 1 | 1.50mi |
HOA detail condo
- Monthly dues
- $871 · $10,452/yr
- Assessments
- None detected in remarks — confirm with the listing agent.
Listing history 21 events
-
2026-06-22days on market $330,000 Active 55 DOM
-
2026-06-21days on market $330,000 Active 54 DOM
-
2026-06-18days on market $330,000 Active 51 DOM
-
2026-06-17days on market $330,000 Active 50 DOM
-
2026-06-16days on market $330,000 Active 49 DOM
-
2026-06-15days on market $330,000 Active 48 DOM
-
2026-06-13days on market $330,000 Active 46 DOM
-
2026-06-09days on market $330,000 Active 42 DOM
-
2026-06-08days on market $330,000 Active 41 DOM
-
2026-06-07days on market $330,000 Active 40 DOM
-
2026-06-04days on market $330,000 Active 37 DOM
-
2026-06-03days on market $330,000 Active 36 DOM
-
2026-06-02days on market $330,000 Active 35 DOM
-
2026-06-01days on market $330,000 Active 34 DOM
-
2026-05-31days on market $330,000 Active 33 DOM
-
2026-04-24$330,000 Active
-
2012-04-10soldstatus $108,000 140-char remark
Show marketing remark (140 chars)
Bank addendum once offer is accepted. Seller chooses title and must hold escrow. Buyer pays doc stamps. 15 first look period ends 2/10/2012.
-
2012-03-20historical 140-char remark
Show marketing remark (140 chars)
Bank addendum once offer is accepted. Seller chooses title and must hold escrow. Buyer pays doc stamps. 15 first look period ends 2/10/2012.
-
2012-01-26$112,000 140-char remark
Show marketing remark (140 chars)
Bank addendum once offer is accepted. Seller chooses title and must hold escrow. Buyer pays doc stamps. 15 first look period ends 2/10/2012.
-
2000-12-15soldstatus $154,000
-
1991-05-30soldstatus $137,900
ⓘ Source: listings_history table (triggers on properties + properties_extension) + one-shot
backfill from property_details.listing_events for pre-trigger history.
Tax reassessment forecast FL · Resets to sale price
- Current annual tax
- $1,812 · $151/mo
- Projected year-2 tax
- $2,739 · $228/mo
- Expected delta
- +$927/yr (+$77/mo · 51.1%)
ⓘ Screening estimate from a state-policy table — verify with the county assessor before closing.
Climate risk First Street
- Flood 1/10 Low FEMA zone X (unshaded) · 0% chance over 30 yrs
- Wildfire 1/10 Low
- Heat 9/10 Extreme 6 d/yr ≥106°F today · 22 d/yr by 30 yrs out
- Wind 10/10 Extreme 99% chance of damaging wind over 30 yrs
- Air quality 2/10 Low 0 unhealthy d/yr today · 2 by 30 yrs out
Nearby sold comps map
Loading sold comps map…
Walkable amenities ~0.75 mi
Loading nearby amenities…
Taxation est. · year 1
- Rental income
- $40,658
- − Mortgage interest
- −$18,485
- − Property taxes
- −$1,812
- − Insurance
- −$1,650
- − Repairs & maintenance
- −$3,253
- − Management
- −$3,253
- − HOA
- −$10,452
- − Depreciation
- −$9,600
- Taxable loss
- −$7,847
- Est. tax savings @ 24.0%
- +$1,883
- After-tax cash flow
- $-678/yr
For passive investors: Depreciation is non-cash, so a rental often shows a tax loss while cash-flowing — sheltering income. Rental losses are passive: they offset passive income freely, and up to $25,000/yr can offset ordinary (W-2) income if you actively participate and your MAGI is under $100k (phasing out to $0 by $150k); unused losses carry forward. On sale, claimed depreciation is recaptured at up to 25%, and gains may owe capital-gains tax (a 1031 exchange can defer both). Figures are a year-1 estimate at your 24.0% rate — not tax advice; consult a CPA.
Schools (NCES district)
- District
- Palm Beach
- NCES district ID
- 1201500
- Math proficiency
- 46% ▼ -16.00%
- Reading proficiency
- 53% ▼ -4.00%
- Median HH income
- $53,943
- Composite
- 42.72/100
- National rank
- #3160
- State rank
- #34 of 73 in FL
Livability — Boynton Beach
- Score
- 72/100
- State rank
- #351
- US rank
- #6098
Category grades
Schools grade is shown separately in the Schools card above.
Census & demographics
- City population
- 148,060
- Population (ZIP)
- 18,689
Population outlook (Palm Beach County) Hauer SSP2
- Today (2025)
- 1,637,487 people
- By 2030
- 1,743,255 · +6.5%
- By 2040
- 1,948,712 · +19.0%
- By 2050
- 2,132,979 · +30.3%
- By 2075
- 2,530,027 · +54.5%
- By 2100
- 2,706,979 · +65.3%
Race, ethnicity, and origin ACS 2023
- Neighborhood character
- Diverse neighborhood (Simpson 0.56)
- Race & ethnicity
- White 63% Hispanic / Latino 18% Two or more races 14% Black 10% Asian 4%
- Hispanic origin (detail)
- Mexican 2% Puerto Rican 2% Cuban 7%
- Common ancestry
- Romanian 5% Scotch-Irish 4% Hispanic 3%
- Foreign-born
- 24% · Canada, China, Jamaica
- Languages at home
- 77% English-only · Spanish 11% Other Indo-European 4% French/Haitian/Cajun 3%
Political lean MEDSL · Palm Beach
- 2024 margin
- Toss-up / Even · D 50.0% · R 49.2%
- 2008→2024 swing
- -22.1pp toward R · 2008: 22.9pp · 2024: 0.8pp
- All cycles
- 2024: D+0.8 2020: D+12.8 2016: D+15.3 2012: D+17.0 2008: D+22.9
Not yet ingested
- Civics
- —
Market trends
- HPI YoY
- ▲ 0.20%
- Current HPI
- 268.1142
- Rent YoY
- —
- Metro
- —
- State GDP YoY
- ▲ 3.28%
- F500 in state
- 36
Industry mix (Fortune 500 HQ in FL)
| Industry | F500 HQs | Revenue |
|---|---|---|
| Industrial Technology | 2 | $29B |
|
||
| Insurance | 2 | $17B |
|
||
| Retail | 1 | $60B |
|
||
| Technology Distribution | 1 | $58B |
|
||
| Homebuilding | 1 | $35B |
|
||
| Technology Manufacturing | 1 | $35B |
|
||
Price history
+139.3% since first listed6 events — show timeline
- 2026-04-24 Listed $330,000 Beaches MLS
- 2012-04-10 Sold (MLS) $108,000 Beaches MLS
- 2012-03-20 Listing Removed — Beaches MLS
- 2012-01-26 Listed $112,000 Beaches MLS
- 2000-12-15 Sold (Public Records) $154,000 Public Records
- 1991-05-30 Sold (Public Records) $137,900 Public Records
Property tax history
-2.1%/yrLatest (2025): $1,812 · +3.6% YoY. Source: county tax records.
Cash-flow waterfall
monthlySold comps — $/sqft
last 12 mo · ≤1 miLoading sold comps…