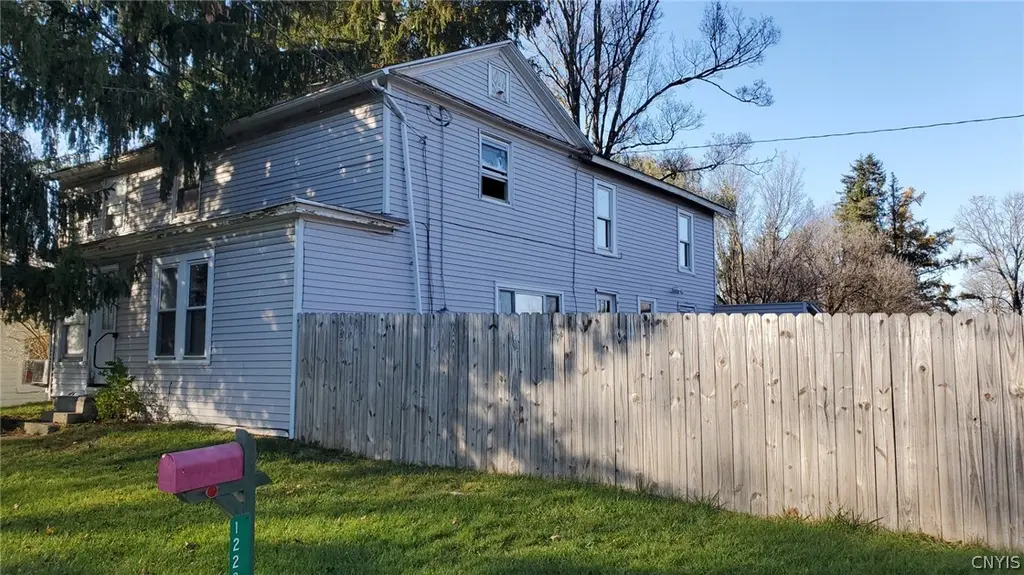
1229 State Route 392 · Virgil, NY
Flood risk 10/10 · Severe
- FEMA flood zone
- X (unshaded)
- Chance of flooding over 30 yrs
- 0.99%
- Est. flood insurance / yr
- $473 – $860
Fire risk 2/10 · Minimal
- Est. fire insurance / yr
- $691 – $1,283
Heat risk 1/10 · Minimal
- Hot days now (above 90°F)
- 7 days/yr
- Hot days in 30 yrs
- 16 days/yr
Wind risk 2/10 · Minimal
- Chance of severe wind over 30 yrs
- 1.0%
Air-quality risk 2/10 · Minimal
- Unhealthy air days now
- 0 days/yr
- Unhealthy air days in 30 yrs
- 1 days/yr
Risk factors via First Street. Map © Google.
Why this score? — see what drove the B- grade
The composite is a weighted blend of 9 inputs, each scored 0–100. Each bar is that input's sub-score; the figure is the points it added to the 100-point composite (weight × sub-score).
- Cash flow +28.8/30.0
- DSCR +10.0/10.0
- 1% rule +9.2/10.0
- ARV discount +7.5/15.0
- Rent growth +4.6/5.0
- Schools +4.3/10.0
- Livability +3.0/5.0
- Condition / age +2.5/5.0
- Appreciation +0.0/10.0
$149,900
🖨 Deal sheet (PDF) 📄 Offer letter ✓ Due diligence
Listing remarks MLS
This is a Fannie Mae HomePath property! Nice two story home that is situated on a spacious lot! Large barn provides ample room for extra storage. Home offers a nice open floor plan with gleaming hardwood floors! Located near your needed amenities!
Key facts
- Laminate flooring
- Barn roof replaced
- Hot water heater
Tags
Property features AI
Finance
- Other: 3.16-acre rural, irregular lot (approx. 408 x 307)
Exterior
- Parking: Detached garage; One garage space
- Utilities: Electric service with circuit breakers; Private well; Septic tank
- Home design: Two-story home; Existing construction
- Construction: Shingle roof; Vinyl siding; Stone foundation; Attic/crawl hatchway(s) insulated
- Exterior features: Dirt driveway; Barn(s) on property; Outbuilding
Interior
- Kitchen: Gas range; Gas oven; Refrigerator
- Flooring: Hardwood flooring; Laminate flooring; Varied flooring
- Bathrooms: Two full bathrooms; One main-level bathroom
- Heating & cooling: Gas heating with forced air; Ductless heating; Ductless cooling
- Interior features: Separate/formal dining room; Separate/formal living room; Country kitchen; Full dirt-floor basement
- Laundry & utility: Main-level laundry
Neighborhood map
What this means for you Summary
Snapshot
- This is a 6-bed/2.0-bath single-family listed at $150k.
Deal economics
- At list price, monthly cash flow is $449 ($5k/yr) — positive.
- The deal already cash-flows at list — no discount required.
- Meets the 1% rule at list price ($2k rent vs $150k).
- Recommended offer: $145k (3.0% below list) — sets the bar for market timing.
Location & tenants
- Location reads 60/100 on livability (#963 in NY) — a middle-class / working-renter tenant base. Strengths: housing A+, cost of living B+; Watch: health & safety D, crime F, amenities F.
- Cortland City School District (town): math 49% / reading 54% proficiency, ranked #368 of 590 in NY (top 62%) — acceptable for families but not a draw, mixed tenant base, ~2y average lease.
- Zoned schools: Cortland High School (math 92% / reading 92%, grade A+, #171 of 1,100 statewide, top 18%, 596 students, 42% FRL) — zoned schools at 42% FRL track the district average.
- Zoned-school proficiency averages 92% at this address vs 52% district-wide (+40 pts) — the actual schools serving this property are materially stronger than the Cortland City School District average implies; a family-tenant draw the district grade alone would hide.
- Market conditions: Rents rising fast (+8.4%/yr); 141 active listings in the ZIP; 45 units permitted in Cortland County in 2024 (12 in 5+ unit buildings).
Forward outlook
- Local home prices are declining (-3.0%/yr); year-one equity from $1k of loan paydown is wiped out by about $4k of value loss. Plan a longer hold.
- Cortland County population projected at -15% by 2050 — secular population decline; favor cash flow + early exit over multi-decade hold.
- At projected returns (-3.0% appreciation + 8.0% rent growth), your $42k cash investment doubles in ~7 years — after that, you're playing with house money.
Negotiation context
- It's been on market 43 days — a 3% lower offer ($145k) is reasonable based on typical stale-listing flexibility.
- 3 sale attempts since 10y ago with the ask held roughly flat each time — persistent listings suggest the price (not the market) is what's stuck; bring a comps-based counter.
- Current owner paid $43k; list at $150k implies a 249% gain — meaningful room to come down on a strong offer.
Risks & watch-outs
- Watch-outs: property tax is 2.7% of price; flood insurance adds $56/mo; built in 1885 — expect roof / HVAC / electrical / plumbing capex.
- Climate carrying-cost: severe flood risk — expect insurance premiums to compound above CPI over the hold.
Questions for the listing agent
- It's been on market 43 days. Have you received any prior offers? Is the seller open to a 3% concession, seller financing, or rate buy-down credit?
- Built in 1885 — when were the roof, HVAC, electrical panel, plumbing, and water heater last replaced?
- Property tax is high relative to price — has the assessment been appealed recently, and will the sale trigger a re-assessment?
- What's the actual annual flood-insurance premium (NFIP or private), and is the property in a SFHA with mandatory coverage?
- Is there a deadline driving the sale (1031 exchange, divorce, estate, relocation)? That informs how much negotiation room exists.
- Crime grade is F in this area — have there been break-ins, vandalism, or insurance claims at this property in the last 3 years? What carrier currently insures it and at what premium?
- What's the average days-on-market for RENTAL listings here right now (not sales)? A rising rental-DOM trend means longer vacancies and softer asking-rent achievability than the comps imply.
- What's the recent tenant-quality profile in this submarket — average credit score on applications, eviction rate, late-payment / NSF rate, and stable-employment percentage? A property-management company in the area should have these aggregated.
- How much new for-sale + rental construction is in the pipeline within 1–3 miles? Heavy new supply typically softens prices + rents 12–24 months out; constrained supply supports both.
Investment metrics
- 1% rule
- 1.42% ✓
- Cap rate
- 10.33%
- Cash-on-cash
- 14.42%
- DSCR
- 1.64
- GRM
- 5.9
CMA / ARV
- ARV (median comp)
- $445,613
- List price
- $149,900
- Delta
- -66.36%
- Verdict
- UNDERPRICED
- Comps
- 6 within 1.0 mi
Projected returns pro-forma
-3.0% appreciation · 8.0% rent growth · sell at horizon
- IRR
- 8.9%
- Equity multiple
- 1.37×
- Total profit
- $15,725
- Equity at exit
- $22,351
- IRR
- 22.4%
- Equity multiple
- 3.44×
- Total profit
- $102,481
- Equity at exit
- $12,961
Cash invested: $41,972 (down + closing). Projections, not guarantees.
Landlord ↔ Tenant lean methodology
- Overall (STATE)
- 15 Strongly Tenant-Friendly
- State New York
- 15 Strongly Tenant-Friendly · D+10
- County
- — inherits STATE
- City
- — inherits STATE
ZIP-level market 13045
- Home prices YoY
- -9.3%
- Rents YoY
- 8.4%
- Active inventory
- 141
- Price-to-rent
- 5.9×
Monthly cashflow live
- Estimated rent
- $2,135 medium interval (Pro) →
- Mortgage (P&I)
- −$786
- Tax from tax record
- −$334 /mo · $4,009/yr
- Insurance
- −$62
- Flood insurance flood zone
- −$56 /mo · $666/yr
- HOA
- −$0
- Vacancy / Maint / Mgmt
- −$448
- Net cashflow
- $449
Break-even live
Sensitivity live
| Price | -10% $534 | -5% $491 | +0% $449 | +5% $406 | +10% $364 |
|---|---|---|---|---|---|
| Rent | -10% $280 | -5% $364 | +0% $449 | +5% $533 | +10% $617 |
| Rate | -1.0pp $524 | -0.5pp $487 | base $449 | +0.5pp $410 | +1.0pp $370 |
UW: 25.0% down · 7.5% · 30yr · 1.5% tax · 5.0% vac · 8.0% maint · 8.0% mgmt
Financing live
Cash to close
- Down payment
- $37,475
- Closing costs
- $4,497
- Reserves months
- —
- Total cash needed
- —
Loan-product check · same deal, 3 products live
Conventional
25% down · 7.5% · 30yr
- Down + closing
- —
- Monthly P&I
- —
- Monthly cashflow
- —
- DSCR
- —
- Eligible?
- —
Personal DTI + credit; lowest rate.
DSCR
20% down · 8.5% · 30yr
- Down + closing
- —
- Monthly P&I
- —
- Monthly cashflow
- —
- DSCR
- —
- Eligible?
- —
No personal income docs; deal must DSCR.
Hard money
10% down · 12.0% · 12mo
- Down + closing
- —
- Monthly P&I
- —
- Monthly cashflow
- —
- DSCR
- —
- Eligible?
- —
Short-term bridge; refi at stabilization.
Listing history 24 events
-
2026-06-21days on market $149,900 Active 43 DOM
-
2026-06-19days on market $149,900 Active 41 DOM
-
2026-06-18days on market $149,900 Active 40 DOM
-
2026-06-17days on market $149,900 Active 39 DOM
-
2026-06-16days on market $149,900 Active 38 DOM
-
2026-06-15days on market $149,900 Active 37 DOM
-
2026-06-14days on market $149,900 Active 35 DOM
-
2026-06-12days on market $149,900 Active 34 DOM
-
2026-06-09days on market $149,900 Active 31 DOM
-
2026-06-08days on market $149,900 Active 30 DOM
-
2026-06-07days on market $149,900 Active 29 DOM
-
2026-06-05days on market $149,900 Active 26 DOM
-
2026-06-03days on market $149,900 Active 25 DOM
-
2026-06-02days on market $149,900 Active 24 DOM
-
2026-06-01days on market $149,900 Active 23 DOM
-
2026-05-31days on market $149,900 Active 22 DOM
-
2026-05-30days on market $149,900 Active 21 DOM
-
2026-05-09$149,900 Active 484-char remark
-
2026-04-29historical
-
2026-04-07price $155,000
-
2025-11-01$170,000 Active
-
2017-06-14soldstatus $43,000
Show marketing remark (247 chars)
This is a Fannie Mae HomePath property! Nice two story home that is situated on a spacious lot! Large barn provides ample room for extra storage. Home offers a nice open floor plan with gleaming hardwood floors! Located near your needed amenities!
-
2016-10-21$42,900
Show marketing remark (247 chars)
This is a Fannie Mae HomePath property! Nice two story home that is situated on a spacious lot! Large barn provides ample room for extra storage. Home offers a nice open floor plan with gleaming hardwood floors! Located near your needed amenities!
-
2002-10-10soldstatus $50,000
ⓘ Source: listings_history table (triggers on properties + properties_extension) + one-shot
backfill from property_details.listing_events for pre-trigger history.
Tax reassessment forecast NY · Partial reset (capped growth)
- Current annual tax
- $4,009 · $334/mo
- Projected year-2 tax
- $4,009 · $334/mo
- Expected delta
- $0/yr ($0/mo · 0.0%)
ⓘ Screening estimate from a state-policy table — verify with the county assessor before closing.
Climate risk First Street
- Flood 10/10 Extreme FEMA zone X (unshaded) · 99% chance over 30 yrs
- Wildfire 2/10 Low
- Heat 1/10 Low 7 d/yr ≥90°F today · 16 d/yr by 30 yrs out
- Wind 2/10 Low 100% chance of damaging wind over 30 yrs
- Air quality 2/10 Low 0 unhealthy d/yr today · 1 by 30 yrs out
Nearby sold comps map
Loading sold comps map…
Walkable amenities ~0.75 mi
Loading nearby amenities…
Taxation est. · year 1
- Rental income
- $25,622
- − Mortgage interest
- −$8,397
- − Property taxes
- −$4,009
- − Insurance
- −$1,416
- − Repairs & maintenance
- −$2,050
- − Management
- −$2,050
- − Depreciation
- −$4,361
- Taxable income
- $3,341
- Est. tax owed @ 24.0%
- −$802
- After-tax cash flow
- $4,582/yr
For passive investors: Depreciation is non-cash, so a rental often shows a tax loss while cash-flowing — sheltering income. Rental losses are passive: they offset passive income freely, and up to $25,000/yr can offset ordinary (W-2) income if you actively participate and your MAGI is under $100k (phasing out to $0 by $150k); unused losses carry forward. On sale, claimed depreciation is recaptured at up to 25%, and gains may owe capital-gains tax (a 1031 exchange can defer both). Figures are a year-1 estimate at your 24.0% rate — not tax advice; consult a CPA.
Schools (NCES district)
- District
- Cortland City School District
- NCES district ID
- 3608460
- Math proficiency
- 49% ▲ 6.00%
- Reading proficiency
- 54% ▲ 17.00%
- Median HH income
- $42,413
- Composite
- 43.29/100
- National rank
- #3041
- State rank
- #368 of 590 in NY
Livability — Virgil
- Score
- 60/100
- State rank
- #963
- US rank
- #18876
Category grades
Schools grade is shown separately in the Schools card above.
Census & demographics
- Census place
- Virgil, NY
- County
- Cortland County · 28,361 people
- Metro
- Cortland, NY
- Population (ZIP)
- 28,361
- Household income
- $69,961
- Rent vs Own
- Severe rent burden
- 1488.0
Population outlook (Cortland County) Hauer SSP2
- Today (2025)
- 47,543 people
- By 2030
- 46,107 · -3.0%
- By 2040
- 43,122 · -9.3%
- By 2050
- 40,216 · -15.4%
- By 2075
- 34,717 · -27.0%
- By 2100
- 28,953 · -39.1%
Race, ethnicity, and origin ACS 2023
- Neighborhood character
- Predominantly White (87%)
- Race & ethnicity
- White 87% Two or more races 5% Hispanic / Latino 5% Black 3% Asian 2%
- Common ancestry
- Romanian 4% Lithuanian 2% Italian 2%
- Foreign-born
- 3% · Canada, China
- Languages at home
- 94% English-only · Spanish 2% Russian/Polish/Slavic 2% Other Indo-European 1%
Political lean MEDSL · Cortland
- 2024 margin
- Lean R (+6.4) · D 46.8% · R 53.2%
- 2008→2024 swing
- -16.4pp toward R · 2008: 10.0pp · 2024: -6.4pp
- All cycles
- 2024: R+6.4 2020: R+1.9 2016: R+6.7 2012: D+8.8 2008: D+10.0
Not yet ingested
- Civics
- —
Market trends
- HPI YoY
- ▼ -29.78%
- Current HPI
- 289.515
- Rent YoY
- ▲ 8.37%
- Metro
- Cortland, NY
- State GDP YoY
- ▲ 2.60%
- F500 in state
- 92
Industry mix (Fortune 500 HQ in NY)
| Industry | F500 HQs | Revenue |
|---|---|---|
| Financial Services | 10 | $950B |
|
||
| Consumer Goods | 9 | $162B |
|
||
| Insurance | 4 | $225B |
|
||
| Telecommunications | 2 | $144B |
|
||
| Pharmaceuticals | 2 | $112B |
|
||
| Media / Entertainment | 2 | $69B |
|
||
Price history
+199.8% since first listed7 events — show timeline
- 2026-05-09 Listed $149,900 CNYIS
- 2026-04-29 Listing Removed — CNYIS
- 2026-04-07 Price Changed $155,000 CNYIS
- 2025-11-01 Listed $170,000 CNYIS
- 2017-06-14 Sold (MLS) $43,000 CNYIS
- 2016-10-21 Listed $42,900 CNYIS
- 2002-10-10 Sold (Public Records) $50,000 Public Records
Property tax history
-0.1%/yrLatest (2025): $4,009 · +36.0% YoY. Source: county tax records.
Cash-flow waterfall
monthlySold comps — $/sqft
last 12 mo · ≤1 miLoading sold comps…