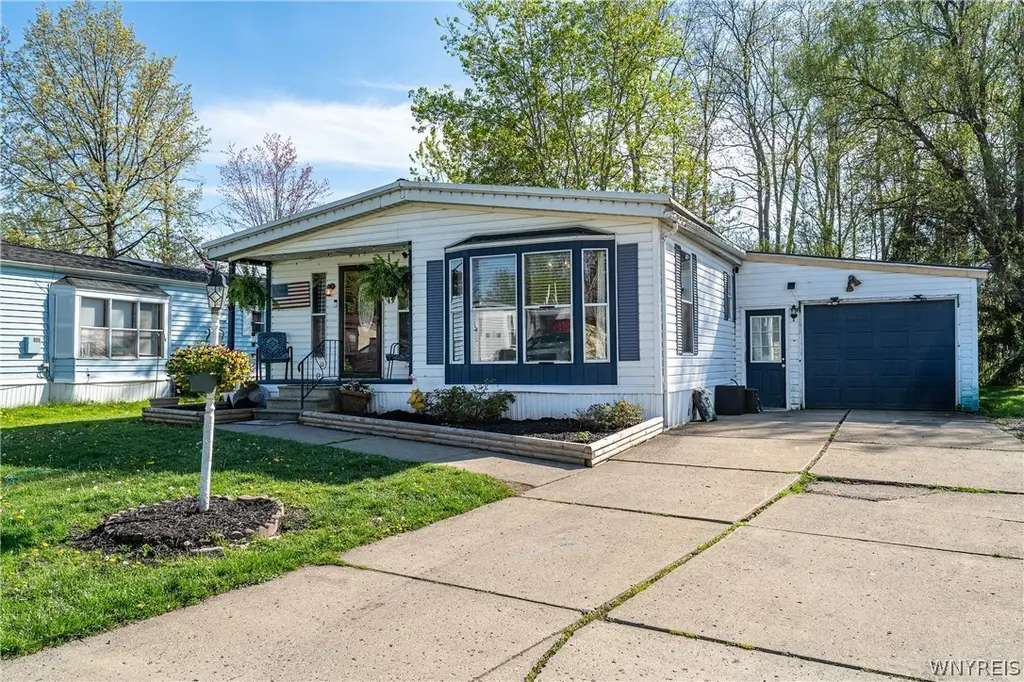
45 Waterview Pkwy · Wanakah, NY
Flood risk 1/10 · Minimal
- FEMA flood zone
- X (unshaded)
- Chance of flooding over 30 yrs
- 0.0%
- Est. flood insurance / yr
- $507 – $1,088
Fire risk 1/10 · Minimal
- Est. fire insurance / yr
- $691 – $1,283
Heat risk 2/10 · Minimal
- Hot days now (above 93°F)
- 7 days/yr
- Hot days in 30 yrs
- 16 days/yr
Wind risk 1/10 · Minimal
- Chance of severe wind over 30 yrs
- —
Air-quality risk 4/10 · Minor
- Unhealthy air days now
- 4 days/yr
- Unhealthy air days in 30 yrs
- 9 days/yr
Risk factors via First Street. Map © Google.
Why this score? — see what drove the B+ grade
The composite is a weighted blend of 9 inputs, each scored 0–100. Each bar is that input's sub-score; the figure is the points it added to the 100-point composite (weight × sub-score).
- Cash flow +30.0/30.0
- ARV discount +11.0/15.0
- 1% rule +10.0/10.0
- DSCR +10.0/10.0
- Schools +4.7/10.0
- Rent growth +3.8/5.0
- Livability +3.5/5.0
- Condition / age +2.5/5.0
- Appreciation +0.0/10.0
$69,900
🖨 Deal sheet (PDF) 📄 Offer letter ✓ Due diligence
Listing remarks
Welcome to 45 Waterview in Brook Gardens Park! Anyone looking for a spacious, move-in-ready 3-bedroom, 2-full-bath double-wide will find this is it. The kitchen is bright and features white cabinets. The open layout of the living room and dining room combo makes the whole space feel huge. The primary bedroom features its own private, full en-suite bathroom, and both bathrooms have been beautifully updated over the past few years. The big mechanical updates are already taken care of, including a durable metal roof from 2015, a reliable furnace from 2016, and a brand-new hot water tank installed this year (2026). Outside, there is a nice concrete driveway and a convenient 1-car attached garag
Key facts
- Bright kitchen
- Metal roof
- White cabinets
Tags
Property features AI
Finance
- HOA & community: Land lease (monthly) — $810
Exterior
- Parking: Attached garage with 1 garage space
- Utilities: Public water connected; Sewer connected
- Home design: Single-story (1 story); Double-wide mobile home; Resale property
- Construction: Vinyl siding; Metal roof; Existing construction
- Exterior features: Concrete driveway; Shed(s)/storage
Interior
- Kitchen: Gas oven and gas range; Dishwasher; Refrigerator
- Bedrooms: 3 main-level bedrooms; Bedroom sizes approx. 12 x 12; 12 x 13; 12 x 17 (all on first level)
- Flooring: Carpet; Luxury vinyl; Vinyl; Varies
- Bathrooms: 2 full bathrooms on the main level
- Heating & cooling: Forced-air gas heating
- Interior features: Living/Dining room
- Laundry & utility: Main-level laundry; Washer and dryer; Gas water heater
Neighborhood map
What this means for you Summary
Snapshot
- This is a 3-bed/2.0-bath manufactured listed at $70k.
Deal economics
- At list price, monthly cash flow is $900 ($11k/yr) — positive.
- The deal already cash-flows at list — no discount required.
- Meets the 1% rule at list price ($2k rent vs $70k).
- Cap rate 21.7% vs local median 3.1% in Wanakah — top-decile yield for the area; either an underpriced asset or a hidden risk that comps aren't pricing in. Stress-test before assuming the spread holds.
Location & tenants
- Location reads 69/100 on livability (#508 in NY) — a middle-class / working-renter tenant base. Strengths: employment A+, housing A+, crime B+; Watch: amenities F, commute F, health & safety F.
- Frontier Central School District (suburban): math 54% / reading 55% proficiency, ranked #301 of 590 in NY (top 51%) — acceptable for families but not a draw, mixed tenant base, ~2y average lease; only 20% free/reduced lunch — higher-income household profile.
- Zoned schools: Big Tree Elementary School (math 42% / reading 57%, grade D, #1,085 of 2,108 statewide, top 56%, 540 students, 38% FRL); Frontier Middle School (math 38% / reading 53%, grade D+, #337 of 729 statewide, top 47%, 1,071 students, 34% FRL); Frontier Senior High School (math 97% / reading 95%, grade A+, #68 of 1,100 statewide, top 6%, 1,352 students, 31% FRL).
- Market conditions: Rents rising fast (+5.2%/yr); 264 active listings in the ZIP; 2 comparable units currently listed for rent nearby; solid renter incomes; 1,244 units permitted in Erie County in 2024 (563 in 5+ unit buildings).
Forward outlook
- Local home prices are declining (-3.0%/yr); year-one equity from $483 of loan paydown is wiped out by about $2k of value loss. Plan a longer hold.
- At projected returns (-3.0% appreciation + 5.2% rent growth), your $20k cash investment doubles in ~3 years — after that, you're playing with house money.
Negotiation context
- Only 12 days on market — expect competitive offers; lowballing is unlikely to land.
Questions for the listing agent
- Is there a deadline driving the sale (1031 exchange, divorce, estate, relocation)? That informs how much negotiation room exists.
- What's the average days-on-market for RENTAL listings here right now (not sales)? A rising rental-DOM trend means longer vacancies and softer asking-rent achievability than the comps imply.
- What's the recent tenant-quality profile in this submarket — average credit score on applications, eviction rate, late-payment / NSF rate, and stable-employment percentage? A property-management company in the area should have these aggregated.
- How much new for-sale + rental construction is in the pipeline within 1–3 miles? Heavy new supply typically softens prices + rents 12–24 months out; constrained supply supports both.
Investment metrics
- 1% rule
- 2.50% ✓
- Cap rate
- 21.74%
- Cash-on-cash
- 55.15%
- DSCR
- 3.45
- GRM
- 3.3
CMA / ARV
- ARV (on-the-fly)
- $75,712
- Comps found
- 12
Show comp detail 12 sales within ~0.75 mi
| Address | Dist | Beds/Ba | Sqft | Sold | Price | $/sf | Match |
|---|---|---|---|---|---|---|---|
| 15 Waterview Pkwy | 0.09mi | 3/2.0 | 1,456 (0%) | 14mo | $54,900 | $38 | 84 |
| 40 Brookridge Dr | 0.26mi | 3/2.0 | 1,456 (0%) | 7mo | $75,000 | $52 | 82 |
| 74 Waterview Pkwy | 0.20mi | 2/1.0 (-1) | 1,452 (-0%) | 5mo | $80,000 | $55 | 77 |
| 28 N Eaglecrest Dr | 0.43mi | 3/2.0 | 1,456 (0%) | 8mo | $80,000 | $55 | 74 |
| 54 N Eaglecrest Dr | 0.45mi | 3/2.0 | 1,456 (0%) | 7mo | $95,000 | $65 | 73 |
| 24 W Canyon Dr | 0.17mi | 3/2.0 | 1,352 (-7%) | 15mo | $103,000 | $76 | 67 |
| 68 S Eaglecrest Dr | 0.43mi | 3/2.0 | 1,456 (0%) | 17mo | $47,100 | $32 | 66 |
| 1 N Roxbury Dr | 0.23mi | 3/2.0 | 1,372 (-6%) | 17mo | $48,000 | $35 | 66 |
| 47 Waterview Pkwy | 0.07mi | 2/1.0 (-1) | 1,350 (-7%) | 13mo | $70,000 | $52 | 65 |
| 37 Brookridge Dr | 0.38mi | 3/2.0 | 1,352 (-7%) | 8mo | $77,700 | $57 | 64 |
| 7 Jean Dr | 0.06mi | 3/2.0 | 1,274 (-12%) | 16mo | $55,000 | $43 | 63 |
| 38 Highridge Ter | 0.26mi | 2/2.0 (-1) | 1,392 (-4%) | 16mo | $48,500 | $35 | 62 |
Match score weights: distance 35% · size 25% · config 20% · recency 20%. Top-matched comps best support the ARV.
Projected returns pro-forma
-3.0% appreciation · 5.21% rent growth · sell at horizon
- IRR
- 55.9%
- Equity multiple
- 3.55×
- Total profit
- $49,954
- Equity at exit
- $10,422
- IRR
- 61.7%
- Equity multiple
- 7.87×
- Total profit
- $134,392
- Equity at exit
- $6,044
Cash invested: $19,572 (down + closing). Projections, not guarantees.
Landlord ↔ Tenant lean methodology
- Overall (STATE)
- 15 Strongly Tenant-Friendly
- State New York
- 15 Strongly Tenant-Friendly · D+10
- County
- — inherits STATE
- City
- — inherits STATE
ZIP-level market 14075
- Rents YoY
- 5.2%
- Active inventory
- 264
- Price-to-rent
- 3.3×
Monthly cashflow live
- Estimated rent
- $1,745 medium interval (Pro) →
- Mortgage (P&I)
- −$367
- Tax from tax record
- −$83 /mo · $997/yr
- Insurance
- −$29
- HOA
- −$0
- Vacancy / Maint / Mgmt
- −$366
- Net cashflow
- $900
Break-even live
Sensitivity live
| Price | -10% $939 | -5% $919 | +0% $900 | +5% $880 | +10% $860 |
|---|---|---|---|---|---|
| Rent | -10% $762 | -5% $831 | +0% $900 | +5% $968 | +10% $1,037 |
| Rate | -1.0pp $935 | -0.5pp $917 | base $900 | +0.5pp $881 | +1.0pp $863 |
UW: 25.0% down · 7.5% · 30yr · 1.5% tax · 5.0% vac · 8.0% maint · 8.0% mgmt
Financing live
Cash to close
- Down payment
- $17,475
- Closing costs
- $2,097
- Reserves months
- —
- Total cash needed
- —
Loan-product check · same deal, 3 products live
Conventional
25% down · 7.5% · 30yr
- Down + closing
- —
- Monthly P&I
- —
- Monthly cashflow
- —
- DSCR
- —
- Eligible?
- —
Personal DTI + credit; lowest rate.
DSCR
20% down · 8.5% · 30yr
- Down + closing
- —
- Monthly P&I
- —
- Monthly cashflow
- —
- DSCR
- —
- Eligible?
- —
No personal income docs; deal must DSCR.
Hard money
10% down · 12.0% · 12mo
- Down + closing
- —
- Monthly P&I
- —
- Monthly cashflow
- —
- DSCR
- —
- Eligible?
- —
Short-term bridge; refi at stabilization.
Rent comps 2 comps
| Address | Beds | Baths | Sqft | Rent | $/sqft | DOM | Units | Dist |
|---|---|---|---|---|---|---|---|---|
| 4819 Southwestern Blvd Hamburg, NY | 2.0 | 2.0 | 1170 | $2,055 | $1.76 | 0d | 1 | 1.09mi |
| 4591 Southwestern Blvd Hamburg, NY | 1.0–2.0 | 1.0 | 737 | $1,445 | $1.96 | 0d | 11 | 1.42mi |
Listing history 8 events
-
2026-06-21days on market $69,900 Active 12 DOM
-
2026-06-18days on market $69,900 Active 9 DOM
-
2026-06-17days on market $69,900 Active 8 DOM
-
2026-06-16days on market $69,900 Active 7 DOM
-
2026-06-15days on market $69,900 Active 6 DOM
-
2026-06-13days on market $69,900 Active 4 DOM
-
2026-06-10remarks 699-char remark
-
2026-06-10$69,900 Active 1 DOM
ⓘ Source: listings_history table (triggers on properties + properties_extension) + one-shot
backfill from property_details.listing_events for pre-trigger history.
Tax reassessment forecast NY · Partial reset (capped growth)
- Current annual tax
- $997 · $83/mo
- Projected year-2 tax
- $1,089 · $91/mo
- Expected delta
- +$92/yr (+$8/mo · 9.2%)
ⓘ Screening estimate from a state-policy table — verify with the county assessor before closing.
Climate risk First Street
- Flood 1/10 Low FEMA zone X (unshaded) · 0% chance over 30 yrs
- Wildfire 1/10 Low
- Heat 2/10 Low 7 d/yr ≥93°F today · 16 d/yr by 30 yrs out
- Wind 1/10 Low
- Air quality 4/10 Moderate 4 unhealthy d/yr today · 9 by 30 yrs out
Nearby sold comps map
Loading sold comps map…
Walkable amenities ~0.75 mi
Loading nearby amenities…
Taxation est. · year 1
- Rental income
- $20,937
- − Mortgage interest
- −$3,915
- − Property taxes
- −$997
- − Insurance
- −$350
- − Repairs & maintenance
- −$1,675
- − Management
- −$1,675
- − Depreciation
- −$2,033
- Taxable income
- $10,291
- Est. tax owed @ 24.0%
- −$2,470
- After-tax cash flow
- $8,325/yr
For passive investors: Depreciation is non-cash, so a rental often shows a tax loss while cash-flowing — sheltering income. Rental losses are passive: they offset passive income freely, and up to $25,000/yr can offset ordinary (W-2) income if you actively participate and your MAGI is under $100k (phasing out to $0 by $150k); unused losses carry forward. On sale, claimed depreciation is recaptured at up to 25%, and gains may owe capital-gains tax (a 1031 exchange can defer both). Figures are a year-1 estimate at your 24.0% rate — not tax advice; consult a CPA.
Schools (NCES district)
- District
- Frontier Central School District
- NCES district ID
- 3611670
- Math proficiency
- 54% ▼ -16.00%
- Reading proficiency
- 55% ▼ -10.00%
- Median HH income
- $58,807
- Composite
- 47.36/100
- National rank
- #2291
- State rank
- #301 of 590 in NY
Livability — Wanakah
- Score
- 69/100
- State rank
- #508
- US rank
- #8972
Category grades
Schools grade is shown separately in the Schools card above.
Census & demographics
- County
- Erie County · 714,559 people
- Metro
- Buffalo-Cheektowaga, NY
- Population (ZIP)
- 44,520
- Household income
- $83,383
- Rent vs Own
- Severe rent burden
- 824.0
Population outlook (Erie County) Hauer SSP2
- Today (2025)
- 933,037 people
- By 2030
- 935,181 · +0.2%
- By 2040
- 928,531 · -0.5%
- By 2050
- 905,725 · -2.9%
- By 2075
- 834,037 · -10.6%
- By 2100
- 708,033 · -24.1%
Race, ethnicity, and origin ACS 2023
- Neighborhood character
- Predominantly White (92%)
- Race & ethnicity
- White 92% Two or more races 4% Hispanic / Latino 3% Black 1%
- Common ancestry
- Romanian 20% Lithuanian 2% Slovak 2%
- Foreign-born
- 2% · Canada
- Languages at home
- 97% English-only · Spanish 1% Other Indo-European 1%
Political lean MEDSL · Erie
- 2024 margin
- Lean D (+9.7) · D 54.8% · R 45.2%
- 2008→2024 swing
- -7.9pp toward R · 2008: 17.5pp · 2024: 9.7pp
- All cycles
- 2024: D+9.7 2020: D+14.7 2016: D+4.8 2012: D+15.6 2008: D+17.5
Not yet ingested
- Civics
- —
Market trends
- HPI YoY
- ▼ -261.10%
- Current HPI
- 300.2852
- Rent YoY
- ▲ 5.21%
- Metro
- Buffalo-Cheektowaga, NY
- State GDP YoY
- ▲ 2.60%
- F500 in state
- 92
Industry mix (Fortune 500 HQ in NY)
| Industry | F500 HQs | Revenue |
|---|---|---|
| Financial Services | 10 | $950B |
|
||
| Consumer Goods | 9 | $162B |
|
||
| Insurance | 4 | $225B |
|
||
| Telecommunications | 2 | $144B |
|
||
| Pharmaceuticals | 2 | $112B |
|
||
| Media / Entertainment | 2 | $69B |
|
||
Price history
1 event — show timeline
- 2026-06-09 Listed $69,900 WNYREIS
Property tax history
+2.7%/yrLatest (2025): $997 · +3.9% YoY. Source: county tax records.
Cash-flow waterfall
monthlySold comps — $/sqft
last 12 mo · ≤1 miLoading sold comps…