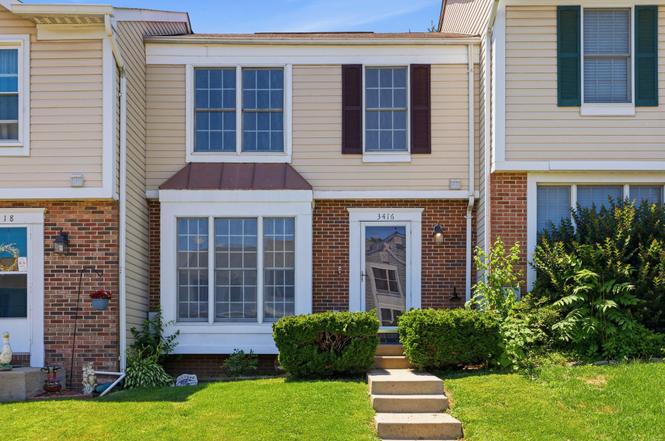
3416 Clairborne Way · Bel Air South, MD
Flood risk 1/10 · Minimal
- FEMA flood zone
- X (unshaded)
- Chance of flooding over 30 yrs
- 0.0%
- Est. flood insurance / yr
- $473 – $860
Fire risk 2/10 · Minimal
- Est. fire insurance / yr
- $755 – $1,403
Heat risk 7/10 · Major
- Hot days now (above 104°F)
- 7 days/yr
- Hot days in 30 yrs
- 15 days/yr
Wind risk 6/10 · Moderate
- Chance of severe wind over 30 yrs
- 27.0%
Air-quality risk 3/10 · Minor
- Unhealthy air days now
- 2 days/yr
- Unhealthy air days in 30 yrs
- 3 days/yr
Risk factors via First Street. Map © Google.
Why this score? — see what drove the C grade
The composite is a weighted blend of 9 inputs, each scored 0–100. Each bar is that input's sub-score; the figure is the points it added to the 100-point composite (weight × sub-score).
- Cash flow +19.9/30.0
- ARV discount +14.0/15.0
- DSCR +6.3/10.0
- 1% rule +5.1/10.0
- Rent growth +4.3/5.0
- Livability +4.1/5.0
- Schools +2.9/10.0
- Condition / age +2.5/5.0
- Appreciation +0.0/10.0
$225,000
🖨 Deal sheet 📄 Offer letter ✓ Due diligence
Key facts
- Unfinished basement
- $79 HOA
- 2 parking spots
Tags
Property features AI
Finance
- Other: Total below-grade area approximately 620 (unfinished); Above-grade finished area approximately 1,240; Ground rent paid annually
- HOA & community: HOA fee of $79 per month
Exterior
- Parking: Parking lot with 2 spaces (total 2 garage/parking spaces)
- Utilities: Public water; Public sewer; No municipal trash service
- Home design: Interior townhouse/rowhouse; Fee simple ownership; Year built: estimated
- Construction: Brick, combination, and vinyl siding exterior; Slab foundation
- Exterior features: Above grade and below grade structural elements
Interior
- Kitchen: Dishwasher; Wall oven; Cooktop; Refrigerator; Freezer
- Bedrooms: Three bedrooms on the upper level (Master Bedroom, Bedroom 2, Bedroom 3)
- Flooring: Luxury vinyl plank; Ceramic tile; Vinyl
- Bathrooms: Two full bathrooms (all upper levels); Two half bathrooms (one on main level, one on lower level)
- Heating & cooling: Heat pump(s); Central air conditioning; Electric heating and cooling; Electric hot water
- Interior features: Unfinished basement; Basement laundry; Rooms include: Master bedroom, two additional bedrooms, family room, kitchen, basement, and multiple bathrooms
- Laundry & utility: Washer and dryer (laundry located in basement)
Neighborhood map
What this means for you Summary
Snapshot
- This is a 3-bed/1.5-bath townhouse listed at $225k.
Deal economics
- At list price, monthly cash flow is $271 ($3k/yr) — positive.
- The deal already cash-flows at list — no discount required.
- Meets the 1% rule at list price ($2k rent vs $225k).
- Cap rate 7.7% vs local median 4.1% in Bel Air South — top-decile yield for the area; either an underpriced asset or a hidden risk that comps aren't pricing in. Stress-test before assuming the spread holds.
Location & tenants
- Location reads 82/100 on livability (#33 in MD, #1,172 nationally) — a professional / high-income tenant draw. Strengths: employment A+, housing A+, health & safety A+; Watch: crime D, cost of living D.
- Harford County Public Schools (suburban): math 22% / reading 39% proficiency, ranked #9 of 24 in MD (top 38%) — families likely to look elsewhere, expect single-tenant / working-renter base with shorter leases.
- Market conditions: Rents rising fast (+7.1%/yr); 158 active listings in the ZIP; 13 comparable units currently listed for rent nearby; rentals at typical pace (median 18d on market — plan ~3-4 weeks tenant-placement turnaround); high-income renter base; 803 units permitted in Harford County in 2024 (26 in 5+ unit buildings).
Forward outlook
- Local home prices are declining (-3.0%/yr); year-one equity from $2k of loan paydown is wiped out by about $7k of value loss. Plan a longer hold.
- At projected returns (-3.0% appreciation + 7.1% rent growth), your $63k cash investment doubles in ~10 years — after that, you're playing with house money.
Negotiation context
- Only 1 days on market — expect competitive offers; lowballing is unlikely to land.
- Current owner paid $97k; list at $225k implies a 132% gain — meaningful room to come down on a strong offer.
Risks & watch-outs
- Climate carrying-cost: major wind risk, 27% chance of damaging wind over 30y; extreme-heat days projected 7→15/yr by 2055 (HVAC capex compounding) — expect insurance premiums to compound above CPI over the hold.
Questions for the listing agent
- What does the HOA fee cover, when was the last increase, and are there any pending special assessments or reserve-fund shortfalls?
- Is there a deadline driving the sale (1031 exchange, divorce, estate, relocation)? That informs how much negotiation room exists.
- Schools are B-rated — typically a magnet for longer-tenancy family renters. What's the average tenant stay here, and is there a school-zone premium baked into asking?
- Crime grade is D in this area — have there been break-ins, vandalism, or insurance claims at this property in the last 3 years? What carrier currently insures it and at what premium?
- What's the average days-on-market for RENTAL listings here right now (not sales)? A rising rental-DOM trend means longer vacancies and softer asking-rent achievability than the comps imply.
- What's the recent tenant-quality profile in this submarket — average credit score on applications, eviction rate, late-payment / NSF rate, and stable-employment percentage? A property-management company in the area should have these aggregated.
- How much new for-sale + rental construction is in the pipeline within 1–3 miles? Heavy new supply typically softens prices + rents 12–24 months out; constrained supply supports both.
Investment metrics
- 1% rule
- 1.01% ✓
- Cap rate
- 7.74%
- Cash-on-cash
- 5.16%
- DSCR
- 1.23
- GRM
- 8.2
CMA / ARV
- ARV (on-the-fly)
- $262,880
- Comps found
- 12
Show comp detail 12 sales within ~0.75 mi
| Address | Dist | Beds/Ba | Sqft | Sold | Price | $/sf | Match |
|---|---|---|---|---|---|---|---|
| 3455 Howell Ct | 0.13mi | 3/2.5 | 1,240 (0%) | 3mo | $304,000 | $245 | 88 |
| 3500 Thomas Pointe Ct Unit 2B | 0.16mi | 3/2.0 | 1,230 (-1%) | 5mo | $233,000 | $189 | 85 |
| 631 Nanticoke Ct | 0.32mi | 3/2.0 | 1,240 (0%) | 0mo | $318,000 | $256 | 83 |
| 3500 Thomas Pointe Ct Unit 1C | 0.16mi | 3/2.0 | 1,215 (-2%) | 9mo | $235,000 | $193 | 79 |
| 203 Star Pointe Ct Unit 2C | 0.22mi | 3/2.0 | 1,300 (+5%) | 3mo | $235,000 | $181 | 77 |
| 3506 Back Pointe Ct Unit 3D | 0.23mi | 3/2.0 | 1,186 (-4%) | 6mo | $220,000 | $185 | 75 |
| 3361 Garrison Cir | 0.19mi | 3/1.5 | 1,166 (-6%) | 12mo | $315,000 | $270 | 72 |
| 3508 Back Pointe Ct Unit 3A | 0.26mi | 3/2.0 | 1,177 (-5%) | 8mo | $232,900 | $198 | 71 |
| 3363 Garrison Cir | 0.18mi | 2/2.5 (-1) | 1,296 (+4%) | 6mo | $325,000 | $251 | 70 |
| 3109 Eden Dr | 0.69mi | 2/2.0 (-1) | 1,342 (+8%) | 3mo | $284,000 | $212 | 44 |
| 3020 Benefit Ct | 0.72mi | 2/2.0 (-1) | 1,362 (+10%) | 8mo | $288,662 | $212 | 36 |
| 3620 Marpat Dr | 0.71mi | 3/2.0 | 1,080 (-13%) | 12mo | $275,000 | $255 | 34 |
Match score weights: distance 35% · size 25% · config 20% · recency 20%. Top-matched comps best support the ARV.
Projected returns pro-forma
-3.0% appreciation · 7.12% rent growth · sell at horizon
- IRR
- -3.8%
- Equity multiple
- 0.85×
- Total profit
- $-9,346
- Equity at exit
- $33,548
- IRR
- 10.0%
- Equity multiple
- 1.92×
- Total profit
- $58,083
- Equity at exit
- $19,454
Cash invested: $63,000 (down + closing). Projections, not guarantees.
Landlord ↔ Tenant lean methodology
- Overall (STATE)
- 27 Tenant-Leaning
- State Maryland
- 27 Tenant-Leaning · D+14
- County
- — inherits STATE
- City
- — inherits STATE
ZIP-level market 21009
- Rents YoY
- 7.1%
- Active inventory
- 158
- Price-to-rent
- 8.2×
Monthly cashflow live
- Estimated rent
- $2,277 high interval (Pro) →
- Mortgage (P&I)
- −$1,180
- Tax from tax record
- −$175 /mo · $2,099/yr
- Insurance
- −$94
- HOA
- −$79
- Vacancy / Maint / Mgmt
- −$478
- Net cashflow
- $271
Break-even live
UW: 25.0% down · 7.5% · 30yr · 1.5% tax · 5.0% vac · 8.0% maint · 8.0% mgmt
Financing live
Cash to close
- Down payment
- $56,250
- Closing costs
- $6,750
- Reserves months
- —
- Total cash needed
- —
Loan-product check · same deal, 3 products live
Conventional
25% down · 7.5% · 30yr
- Down + closing
- —
- Monthly P&I
- —
- Monthly cashflow
- —
- DSCR
- —
- Eligible?
- —
Personal DTI + credit; lowest rate.
DSCR
20% down · 8.5% · 30yr
- Down + closing
- —
- Monthly P&I
- —
- Monthly cashflow
- —
- DSCR
- —
- Eligible?
- —
No personal income docs; deal must DSCR.
Hard money
10% down · 12.0% · 12mo
- Down + closing
- —
- Monthly P&I
- —
- Monthly cashflow
- —
- DSCR
- —
- Eligible?
- —
Short-term bridge; refi at stabilization.
Rent comps 13 comps
| Address | Beds | Baths | Sqft | Rent | $/sqft | DOM | Units | Dist |
|---|---|---|---|---|---|---|---|---|
| 3361 Cheverly Ct Abingdon, MD | 3.0 | 2.5 | 1500 | $2,195 | $1.46 | 43d | 1 | 0.29mi |
| 499 Crisfield Dr Abingdon, MD | 1.0–3.0 | 1.0–2.0 | 898 | $2,020 | $2.25 | 2d | 11 | 0.30mi |
| 499 Crisfield Dr Abingdon, MD | 1.0–3.0 | 1.0–2.0 | 898 | $2,309 | $2.57 | 43d | 20 | 0.30mi |
| 158 Glen View Ter Abingdon, MD | 2.0 | 2.5 | 1176 | $1,995 | $1.70 | 17d | 1 | 0.62mi |
| 3103 Cardinal Way Unit 1 Abingdon, MD | 2.0 | 1.0 | 976 | $1,800 | $1.84 | 17d | 1 | 0.63mi |
| 102 Waldon Rd Abingdon, MD | 1.0–2.0 | 1.0–1.5 | 794 | $1,675 | $2.11 | 1d | 38 | 0.91mi |
| 3405 McCurley Dr Abingdon, MD | 1.0–3.0 | 1.0–2.5 | 1263 | $3,264 | $2.58 | 2d | 29 | 0.98mi |
| 307L Tall Pines Ct Unit L Abingdon, MD | 3.0 | 2.0 | 1300 | $2,399 | $1.85 | 14d | 1 | 1.00mi |
| 3101 White Oak Dr Abingdon, MD | 2.0 | 1.0–2.0 | 576 | $1,630 | $2.83 | 3d | 5 | 1.07mi |
| 2814 Meredith Ct Abingdon, MD | 3.0 | 2.5 | 1320 | $2,300 | $1.74 | 24d | 1 | 1.23mi |
| 644 Berwick Ct Abingdon, MD | 3.0 | 2.5 | 1500 | $2,395 | $1.60 | 43d | 1 | 1.26mi |
| 2509 Merrick Ct Abingdon, MD | 3.0 | 1.5 | 1230 | $1,900 | $1.54 | 43d | 1 | 1.39mi |
| 129 Long Meadow Ct Abingdon, MD | 3.0 | 1.5 | 1240 | $2,200 | $1.77 | 43d | 1 | 1.40mi |
HOA detail
- Monthly dues
- $79 · $948/yr
Listing history 2 events
-
2026-06-19status $225,000 Active 1 DOM
-
2026-06-17$225,000 Coming Soon 1 DOM
ⓘ Source: listings_history table (triggers on properties + properties_extension) + one-shot
backfill from property_details.listing_events for pre-trigger history.
Tax reassessment forecast MD · Partial reset (capped growth)
- Current annual tax
- $2,099 · $175/mo
- Projected year-2 tax
- $2,276 · $190/mo
- Expected delta
- +$177/yr (+$15/mo · 8.4%)
ⓘ Screening estimate from a state-policy table — verify with the county assessor before closing.
Climate risk First Street
- Flood 1/10 Low FEMA zone X (unshaded) · 0% chance over 30 yrs
- Wildfire 2/10 Low
- Heat 7/10 Severe 7 d/yr ≥104°F today · 15 d/yr by 30 yrs out
- Wind 6/10 Major 27% chance of damaging wind over 30 yrs
- Air quality 3/10 Moderate 2 unhealthy d/yr today · 3 by 30 yrs out
Nearby sold comps map
Loading sold comps map…
Walkable amenities ~0.75 mi
Loading nearby amenities…
Taxation est. · year 1
- Rental income
- $27,322
- − Mortgage interest
- −$12,603
- − Property taxes
- −$2,099
- − Insurance
- −$1,125
- − Repairs & maintenance
- −$2,186
- − Management
- −$2,186
- − HOA
- −$948
- − Depreciation
- −$6,545
- Taxable loss
- −$370
- Est. tax savings @ 24.0%
- +$89
- After-tax cash flow
- $3,342/yr
For passive investors: Depreciation is non-cash, so a rental often shows a tax loss while cash-flowing — sheltering income. Rental losses are passive: they offset passive income freely, and up to $25,000/yr can offset ordinary (W-2) income if you actively participate and your MAGI is under $100k (phasing out to $0 by $150k); unused losses carry forward. On sale, claimed depreciation is recaptured at up to 25%, and gains may owe capital-gains tax (a 1031 exchange can defer both). Figures are a year-1 estimate at your 24.0% rate — not tax advice; consult a CPA.
Schools (NCES district)
- District
- Harford County Public Schools
- NCES district ID
- 2400390
- Math proficiency
- 22% ▼ -23.00%
- Reading proficiency
- 39% ▼ -12.00%
- Median HH income
- $79,569
- Composite
- 29.38/100
- National rank
- #6527
- State rank
- #9 of 24 in MD
Livability — Bel Air South
- Score
- 82/100
- State rank
- #33
- US rank
- #1172
Category grades
Schools grade is shown separately in the Schools card above.
Census & demographics
- Census place
- Bel Air South, MD
- County
- Harford County · 198,512 people
- City population
- 63,895
- Metro
- Baltimore-Columbia-Towson, MD
- Population (ZIP)
- 33,679
- Household income
- $121,660
- Rent vs Own
- Severe rent burden
- 437.0
Population outlook (Harford County) Hauer SSP2
- Today (2025)
- 262,292 people
- By 2030
- 266,437 · +1.6%
- By 2040
- 269,954 · +2.9%
- By 2050
- 265,659 · +1.3%
- By 2075
- 252,886 · -3.6%
- By 2100
- 224,014 · -14.6%
Race, ethnicity, and origin ACS 2023
- Neighborhood character
- Predominantly White (68%)
- Race & ethnicity
- White 68% Black 18% Hispanic / Latino 6% Asian 4% Two or more races 4%
- Hispanic origin (detail)
- Mexican 2% Puerto Rican 1%
- Common ancestry
- Romanian 5% Lithuanian 2% Slovak 2%
- Foreign-born
- 7% · Canada, South Korea, China
- Languages at home
- 89% English-only · Spanish 3% Other Indo-European 2% Other Asian/Pacific 1%
Political lean MEDSL · Harford
- 2024 margin
- R (+13.8) · D 41.9% · R 55.7% · Other 2.4%
- 2008→2024 swing
- +5.0pp toward D · 2008: -18.8pp · 2024: -13.8pp
- All cycles
- 2024: R+13.8 2020: R+12.0 2016: R+24.5 2012: R+19.5 2008: R+18.8
Not yet ingested
- Civics
- —
Market trends
- HPI YoY
- ▼ -176.25%
- Current HPI
- 251.4376
- Rent YoY
- ▲ 7.12%
- Metro
- Baltimore-Columbia-Towson, MD
- State GDP YoY
- ▲ 2.97%
- F500 in state
- 12
Industry mix (Fortune 500 HQ in MD)
| Industry | F500 HQs | Revenue |
|---|---|---|
| Aerospace / Defense | 1 | $71B |
|
||
| Utilities | 1 | $25B |
|
||
| Hotels | 1 | $24B |
|
||
| Consumer Goods | 1 | $7B |
|
||
| Real Estate | 1 | $6B |
|
||
| Chemicals | 1 | $2B |
|
||
Price history
+172.8% since first listed3 events — show timeline
- 2026-06-17 Coming Soon $225,000 BRIGHT MLS
- 1994-12-07 Sold (Public Records) $96,900 Public Records
- 1987-12-28 Sold (Public Records) $82,465 Public Records
Property tax history
+1.7%/yrLatest (2025): $2,099 · +5.1% YoY. Source: county tax records.
Cash-flow waterfall
monthlySold comps — $/sqft
last 12 mo · ≤1 miLoading sold comps…