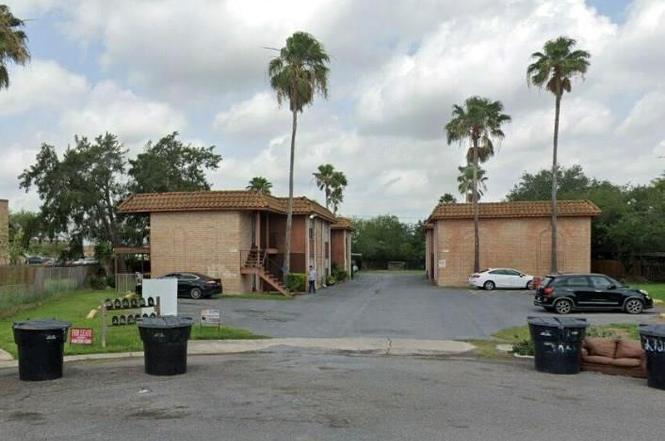
2721 Quail Run #4 · Harlingen, TX
Flood risk 3/10 · Minor
- FEMA flood zone
- X (unshaded)
- Chance of flooding over 30 yrs
- 0.2%
- Est. flood insurance / yr
- $507 – $1,088
Fire risk 3/10 · Minor
- Est. fire insurance / yr
- $1,222 – $2,270
Heat risk 9/10 · Severe
- Hot days now (above 110°F)
- 7 days/yr
- Hot days in 30 yrs
- 25 days/yr
Wind risk 8/10 · Major
- Chance of severe wind over 30 yrs
- 99.0%
Air-quality risk 1/10 · Minimal
- Unhealthy air days now
- 0 days/yr
- Unhealthy air days in 30 yrs
- 0 days/yr
Risk factors via First Street. Map © Google.
Why this score? — see what drove the B- grade
The composite is a weighted blend of 9 inputs, each scored 0–100. Each bar is that input's sub-score; the figure is the points it added to the 100-point composite (weight × sub-score).
- Cash flow +30.0/30.0
- DSCR +10.0/10.0
- 1% rule +9.2/10.0
- ARV discount +7.5/15.0
- Livability +3.7/5.0
- Rent growth +3.4/5.0
- Schools +2.5/10.0
- Condition / age +2.5/5.0
- Appreciation +0.0/10.0
$73,000
🖨 Deal sheet (PDF) 📄 Offer letter ✓ Due diligence
Listing remarks
AGENTS THIS IS A CONDOMINIUM YOU DON'T WANT TO MISS TO SHOW TO YOUR CLIENTS, VERY CLOSE TO SU CLINICA, HOSPITALS, TREASURE HILLS ELEMENTARY, VALLEY INTERNATIONAL AIRPORT & EXPRESSWAY. HOA covers water, sewer, trash and landscaping. Property is selling as is. Showing available 10/30/2024 FINANCING IS CASH OR OTHER (call for details)
Key facts
- Hoa covers utilities
- Near schools
- Proximity to airport
Tags
Property features AI
Finance
- HOA & community: Homeowners association with monthly fee
Exterior
- Parking: Detached parking
- Utilities: Public water; Public sewer
- Home design: Condominium; 2 stories; Residential property
- Construction: Brick veneer exterior; Composition roof; Slab foundation
- Exterior features: Balcony
Interior
- Flooring: Tile
- Bathrooms: 1 full bathroom
- Heating & cooling: Central heating; Central air
- Interior features: Ceiling fans; Balcony
- Laundry & utility: Washer; Dryer
Neighborhood map
What this means for you Summary
Snapshot
- This is a 2-bed/1.0-bath condo listed at $73k.
Deal economics
- At list price, monthly cash flow is $290 ($3k/yr) — positive.
- The deal already cash-flows at list — no discount required.
- Meets the 1% rule at list price ($1k rent vs $73k).
- Recommended offer: $64k (12.0% below list) — sets the bar for market timing.
- Cap rate 11.1% vs local median 3.8% in Harlingen — top-decile yield for the area; either an underpriced asset or a hidden risk that comps aren't pricing in. Stress-test before assuming the spread holds.
Location & tenants
- Location reads 73/100 on livability (#217 in TX) — a middle-class / working-renter tenant base. Strengths: amenities A+, cost of living A+, housing A+; Watch: crime C-, commute F, employment F.
- Harlingen CISD (urban): math 25% / reading 35% proficiency, ranked #647 of 826 in TX (top 78%) — families likely to look elsewhere, expect single-tenant / working-renter base with shorter leases; 74% free/reduced lunch — lower-income household profile, screen leases tightly.
- Zoned schools: Treasure Hills El (math 24% / reading 37%, grade F, #2,464 of 4,322 statewide, top 58%, 858 students, 72% FRL); Coakley Middle (math 22% / reading 33%, grade F, #1,156 of 1,662 statewide, top 71%, 660 students, 83% FRL); Harlingen H S - South (math 47% / reading 17%, grade F, #1,044 of 1,632 statewide, top 66%, 1,571 students, 75% FRL) — zoned schools at 77% FRL track the district average.
- Market conditions: Rents rising (+3.5%/yr); 468 active listings in the ZIP; 40 comparable units currently listed for rent nearby; rentals at typical pace (median 23d on market — plan ~3-4 weeks tenant-placement turnaround); 45% of comp listings sitting > 30 days — soft ceiling on asking rent; 2,326 units permitted in Cameron County in 2024 (503 in 5+ unit buildings).
Forward outlook
- Local home prices are declining (-3.0%/yr); year-one equity from $505 of loan paydown is wiped out by about $2k of value loss. Plan a longer hold.
- Cameron County population projected at +3% by 2050 — modest demand growth; plan on rents tracking national, not racing it.
- At projected returns (-3.0% appreciation + 3.5% rent growth), your $20k cash investment doubles in ~7 years — after that, you're playing with house money.
Negotiation context
- It's been on market 398 days — a 12% lower offer ($64k) is reasonable based on typical stale-listing flexibility.
- 5 sale attempts since 2y ago with the ask held roughly flat each time — persistent listings suggest the price (not the market) is what's stuck; bring a comps-based counter.
Risks & watch-outs
- Climate carrying-cost: severe wind risk, 99% chance of damaging wind over 30y; extreme-heat days projected 7→25/yr by 2055 (HVAC capex compounding) — expect insurance premiums to compound above CPI over the hold.
Questions for the listing agent
- It's been on market 398 days. Have you received any prior offers? Is the seller open to a 12% concession, seller financing, or rate buy-down credit?
- Any open or pending special assessments — roof, HVAC, plumbing, elevator, façade? What's the per-unit balance and payoff schedule, and is the seller paying it off at close or rolling it to the buyer?
- Why hasn't it sold? Are there any deal-killer items the seller is aware of (foundation, flood, title, zoning, code violations)?
- Is there a deadline driving the sale (1031 exchange, divorce, estate, relocation)? That informs how much negotiation room exists.
- Schools are D-rated, which usually means shorter tenancies and higher turnover. Who's the typical renter profile here, and what's been the actual vacancy rate?
- What's the average days-on-market for RENTAL listings here right now (not sales)? A rising rental-DOM trend means longer vacancies and softer asking-rent achievability than the comps imply.
- What's the recent tenant-quality profile in this submarket — average credit score on applications, eviction rate, late-payment / NSF rate, and stable-employment percentage? A property-management company in the area should have these aggregated.
- How much new apartment / multifamily construction is in the pipeline within 1–3 miles? Heavy new supply (>2% of stock underway) typically softens rents 12–24 months out; light construction supports rent growth.
Investment metrics
- 1% rule
- 1.42% ✓
- Cap rate
- 11.07%
- Cash-on-cash
- 17.05%
- DSCR
- 1.76
- GRM
- 5.9
CMA / ARV
No comps found within radius.
Projected returns pro-forma
-3.0% appreciation · 3.45% rent growth · sell at horizon
- IRR
- 8.9%
- Equity multiple
- 1.35×
- Total profit
- $7,169
- Equity at exit
- $10,885
- IRR
- 18.5%
- Equity multiple
- 2.57×
- Total profit
- $32,132
- Equity at exit
- $6,312
Cash invested: $20,440 (down + closing). Projections, not guarantees.
Landlord ↔ Tenant lean methodology
- Overall (STATE)
- 87 Strongly Landlord-Friendly
- State Texas
- 87 Strongly Landlord-Friendly · R+5
- County
- — inherits STATE
- City
- — inherits STATE
ZIP-level market 78550
- Rents YoY
- 3.5%
- Active inventory
- 468
- Price-to-rent
- 5.9×
Monthly cashflow live
- Estimated rent
- $1,035 high interval (Pro) →
- Mortgage (P&I)
- −$383
- Tax from tax record
- −$114 /mo · $1,368/yr
- Insurance
- −$30
- HOA
- −$0
- Vacancy / Maint / Mgmt
- −$217
- Net cashflow
- $290
Break-even live
Sensitivity live
| Price | -10% $332 | -5% $311 | +0% $290 | +5% $270 | +10% $249 |
|---|---|---|---|---|---|
| Rent | -10% $209 | -5% $250 | +0% $290 | +5% $331 | +10% $372 |
| Rate | -1.0pp $327 | -0.5pp $309 | base $290 | +0.5pp $272 | +1.0pp $252 |
UW: 25.0% down · 7.5% · 30yr · 1.5% tax · 5.0% vac · 8.0% maint · 8.0% mgmt
Financing live
Cash to close
- Down payment
- $18,250
- Closing costs
- $2,190
- Reserves months
- —
- Total cash needed
- —
Loan-product check · same deal, 3 products live
Conventional
25% down · 7.5% · 30yr
- Down + closing
- —
- Monthly P&I
- —
- Monthly cashflow
- —
- DSCR
- —
- Eligible?
- —
Personal DTI + credit; lowest rate.
DSCR
20% down · 8.5% · 30yr
- Down + closing
- —
- Monthly P&I
- —
- Monthly cashflow
- —
- DSCR
- —
- Eligible?
- —
No personal income docs; deal must DSCR.
Hard money
10% down · 12.0% · 12mo
- Down + closing
- —
- Monthly P&I
- —
- Monthly cashflow
- —
- DSCR
- —
- Eligible?
- —
Short-term bridge; refi at stabilization.
Rent comps 40 comps
| Address | Beds | Baths | Sqft | Rent | $/sqft | DOM | Units | Dist |
|---|---|---|---|---|---|---|---|---|
| 2805 Treasure Hills Blvd Unit 1 Harlingen, TX | 2.0 | 1.0 | 1100 | $900 | $0.82 | 23d | 1 | 0.05mi |
| 2906 Treasure Hills Blvd Unit D Harlingen, TX | 2.0 | 1.0 | 1100 | $925 | $0.84 | 45d | 1 | 0.12mi |
| 2906 Treasure Hills Blvd Unit D Harlingen, TX | 2.0 | 1.0 | 1100 | $950 | $0.86 | 23d | 1 | 0.12mi |
| 2901 Haine Dr Harlingen, TX | 3.0 | 2.0 | 1111 | $1,389 | $1.25 | 15d | 1 | 0.37mi |
| 2020 S 23rd St Harlingen, TX | 3.0 | 1.0 | 961 | $1,200 | $1.25 | 23d | 1 | 0.38mi |
| 1802 Bobcat Ln Harlingen, TX | 3.0 | 2.0 | 1100 | $1,450 | $1.32 | 15d | 1 | 0.38mi |
| 2901 Haine Dr Apt 108 Harlingen, TX | 2.0 | 1.5 | 858 | $1,129 | $1.32 | 15d | 1 | 0.42mi |
| 2218 Bell St Unit 14 Harlingen, TX | 1.0 | 1.0 | 620 | $625 | $1.01 | 45d | 1 | 0.61mi |
| 2218 Bell St Apt 15 Harlingen, TX | 1.0 | 1.0 | 620 | $625 | $1.01 | 23d | 1 | 0.61mi |
| 1810 Atrium Place Dr Unit 12 Harlingen, TX | 2.0 | 1.0 | 788 | $1,100 | $1.40 | 45d | 1 | 0.64mi |
| 1802 Atrium Place Dr Unit 3 Harlingen, TX | 3.0 | 2.0 | 1068 | $1,400 | $1.31 | 45d | 1 | 0.66mi |
| 1802 Atrium Place Dr Unit 11 Harlingen, TX | 2.0 | 1.0 | 817 | $1,150 | $1.41 | 45d | 1 | 0.66mi |
| 1809 Atrium Place Dr Unit 3 Harlingen, TX | 2.0 | 2.0 | 950 | $1,250 | $1.32 | 45d | 1 | 0.71mi |
| 1801 Atrium Place Dr Unit 12 Harlingen, TX | 2.0 | 2.0 | 1100 | $1,295 | $1.18 | 15d | 1 | 0.72mi |
| 1801 Atrium Place Dr Unit 17 Harlingen, TX | 2.0 | 2.0 | 1100 | $1,335 | $1.21 | 45d | 1 | 0.72mi |
| 1608 Sam Houston Dr Harlingen, TX | 1.0–2.0 | 1.0–2.0 | 790 | $839 | $1.06 | 15d | 11 | 0.74mi |
| 902 S Loop 499 Harlingen, TX | 1.0–2.0 | 1.0–2.5 | 971 | $995 | $1.02 | 15d | 16 | 0.87mi |
| 1402 Vermont Harlingen, TX | 2.0 | 2.0 | 834 | $1,050 | $1.26 | 15d | 1 | 0.89mi |
| 1402 Vermont Unit 3 Harlingen, TX | 3.0 | 2.0 | 1016 | $1,200 | $1.18 | 15d | 1 | 0.93mi |
| 2712 E Harrison Ave Unit 4 Harlingen, TX | 3.0 | 2.0 | 1118 | $1,225 | $1.10 | 45d | 1 | 0.95mi |
| 2712 E Harrison Ave Unit 3 Harlingen, TX | 2.0 | 2.0 | 908 | $1,075 | $1.18 | 23d | 1 | 0.95mi |
| 2712 E Harrison Ave Unit 3 Harlingen, TX | 2.0 | 2.0 | 908 | $1,075 | $1.18 | 45d | 1 | 0.95mi |
| 2708 E Harrison Ave Unit 2 Harlingen, TX | 3.0 | 2.0 | 1118 | $1,225 | $1.10 | 45d | 1 | 0.96mi |
| 2708 E Harrison Ave Unit 1 Harlingen, TX | 2.0 | 2.0 | 998 | $1,075 | $1.08 | 45d | 1 | 0.96mi |
| 2708 E Harrison Ave Unit 3 Harlingen, TX | 2.0 | 2.0 | 908 | $1,075 | $1.18 | 23d | 1 | 0.96mi |
| 2612 E Harrison Ave Unit 4 Harlingen, TX | 3.0 | 2.0 | 1118 | $1,225 | $1.10 | 45d | 1 | 0.98mi |
| 2809 E Harrison Ave Unit 2 Harlingen, TX | 3.0 | 2.0 | 1118 | $1,225 | $1.10 | 45d | 1 | 0.99mi |
| 2805 E Harrison Ave Apt 3 Harlingen, TX | 2.0 | 2.0 | 908 | $1,075 | $1.18 | 15d | 1 | 0.99mi |
| 2805 E Harrison Ave Apt 4 Harlingen, TX | 3.0 | 2.0 | 1118 | $1,225 | $1.10 | 23d | 1 | 0.99mi |
| 1501 Sam Houston Dr Apt 6H Harlingen, TX | 2.0 | 1.5 | 1015 | $775 | $0.76 | 45d | 1 | 1.06mi |
| 1501 Sam Houston Dr Harlingen, TX | 1.0 | 1.0 | 752 | $650 | $0.86 | 45d | 1 | 1.07mi |
| 1501 Sam Houston Dr Harlingen, TX | 1.0 | 1.0 | 752 | $650 | $0.86 | 15d | 1 | 1.07mi |
| 1902 E Tyler Ave Harlingen, TX | 2.0–3.0 | 1.0–2.0 | 1007 | $903 | $0.90 | 15d | 6 | 1.08mi |
| 4402 Glasscock Ave Harlingen, TX | 2.0 | 2.0 | 845 | $895 | $1.06 | 45d | 1 | 1.10mi |
| 1722 Stone Dr Unit 2 Harlingen, TX | 2.0 | 2.5 | 1100 | $1,000 | $0.91 | 45d | 1 | 1.14mi |
| 504 Rock Cir Unit 1 Harlingen, TX | 2.0 | 1.5 | 1050 | $925 | $0.88 | 23d | 1 | 1.20mi |
| 2002 E Van Buren Ave Harlingen, TX | 2.0 | 1.0 | 1062 | $1,150 | $1.08 | 23d | 1 | 1.24mi |
| 3936 Bourbon St Harlingen, TX | 2.0 | 2.0 | 880 | $750 | $0.85 | 23d | 1 | 1.35mi |
| 602 Scotch St Unit 16 Harlingen, TX | 2.0 | 1.0 | 900 | $600 | $0.67 | 23d | 1 | 1.41mi |
| 602 Scotch St Unit 8 Harlingen, TX | 2.0 | 1.0 | 900 | $650 | $0.72 | 45d | 1 | 1.41mi |
HOA detail condo
- Monthly dues
- $0 · $0/yr
- Likely covers
- watersewertrashlandscaping
- Assessments
- None detected in remarks — confirm with the listing agent.
Listing history 6 events
-
2026-06-09statusdays on market $73,000 Pending 398 DOM
-
2026-06-03days on market $73,000 Active 404 DOM
-
2026-06-02days on market $73,000 Active 403 DOM
-
2026-06-01days on market $73,000 Active 402 DOM
-
2026-05-31days on market $73,000 Active 401 DOM
-
2026-05-30days on market $73,000 Active 400 DOM
ⓘ Source: listings_history table (triggers on properties + properties_extension) + one-shot
backfill from property_details.listing_events for pre-trigger history.
Tax reassessment forecast TX · Resets to sale price
- Current annual tax
- $1,368 · $114/mo
- Projected year-2 tax
- $1,368 · $114/mo
- Expected delta
- $0/yr ($0/mo · 0.0%)
ⓘ Screening estimate from a state-policy table — verify with the county assessor before closing.
Climate risk First Street
- Flood 3/10 Moderate FEMA zone X (unshaded) · 20% chance over 30 yrs
- Wildfire 3/10 Moderate
- Heat 9/10 Extreme 7 d/yr ≥110°F today · 25 d/yr by 30 yrs out
- Wind 8/10 Severe 99% chance of damaging wind over 30 yrs
- Air quality 1/10 Low 0 unhealthy d/yr today · 0 by 30 yrs out
Nearby sold comps map
Loading sold comps map…
Walkable amenities ~0.75 mi
Loading nearby amenities…
Taxation est. · year 1
- Rental income
- $12,421
- − Mortgage interest
- −$4,089
- − Property taxes
- −$1,368
- − Insurance
- −$365
- − Repairs & maintenance
- −$994
- − Management
- −$994
- − Depreciation
- −$2,124
- Taxable income
- $2,487
- Est. tax owed @ 24.0%
- −$597
- After-tax cash flow
- $2,888/yr
For passive investors: Depreciation is non-cash, so a rental often shows a tax loss while cash-flowing — sheltering income. Rental losses are passive: they offset passive income freely, and up to $25,000/yr can offset ordinary (W-2) income if you actively participate and your MAGI is under $100k (phasing out to $0 by $150k); unused losses carry forward. On sale, claimed depreciation is recaptured at up to 25%, and gains may owe capital-gains tax (a 1031 exchange can defer both). Figures are a year-1 estimate at your 24.0% rate — not tax advice; consult a CPA.
Schools (NCES district)
- District
- Harlingen CISD
- NCES district ID
- 4822530
- Math proficiency
- 25% ▼ -28.00%
- Reading proficiency
- 35% ▼ -11.00%
- Median HH income
- $37,182
- Composite
- 24.94/100
- National rank
- #7566
- State rank
- #647 of 826 in TX
Livability — Harlingen
- Score
- 73/100
- State rank
- #217
- US rank
- #5347
Category grades
Schools grade is shown separately in the Schools card above.
Census & demographics
- Census place
- Harlingen, TX
- County
- Cameron County · 310,734 people
- City population
- 95,667
- Metro
- Brownsville-Harlingen, TX
- Population (ZIP)
- 53,335
- Household income
- $49,007
- Rent vs Own
- Severe rent burden
- 2251.0
Population outlook (Cameron County) Hauer SSP2
- Today (2025)
- 441,603 people
- By 2030
- 448,113 · +1.5%
- By 2040
- 456,385 · +3.3%
- By 2050
- 456,294 · +3.3%
- By 2075
- 423,851 · -4.0%
- By 2100
- 342,787 · -22.4%
Race, ethnicity, and origin ACS 2023
- Neighborhood character
- Predominantly Hispanic (83%)
- Race & ethnicity
- Hispanic / Latino 83% Two or more races 29% White 14% Black 1%
- Hispanic origin (detail)
- Mexican 76%
- Common ancestry
- Italian 1% Lithuanian 1%
- Foreign-born
- 14% · Canada
- Languages at home
- 51% English-only · Spanish 48%
Political lean MEDSL · Cameron
- 2024 margin
- Lean R (+5.8) · D 46.7% · R 52.5%
- 2008→2024 swing
- -34.6pp toward R · 2008: 28.8pp · 2024: -5.8pp
- All cycles
- 2024: R+5.8 2020: D+13.2 2016: D+32.5 2012: D+32.4 2008: D+28.8
Not yet ingested
- Civics
- —
Market trends
- HPI YoY
- ▼ -142.60%
- Current HPI
- 167.7038
- Rent YoY
- ▲ 3.45%
- Metro
- Brownsville-Harlingen, TX
- State GDP YoY
- ▲ 3.95%
- F500 in state
- 110
Industry mix (Fortune 500 HQ in TX)
| Industry | F500 HQs | Revenue |
|---|---|---|
| Energy | 16 | $1,198B |
|
||
| Technology | 5 | $198B |
|
||
| Engineering / Construction | 4 | $72B |
|
||
| Energy Services | 3 | $60B |
|
||
| Utilities | 3 | $41B |
|
||
| Healthcare | 2 | $330B |
|
||
Price history
-2.7% since first listed13 events — show timeline
- 2026-05-29 Relisted — RGVMLS
- 2026-05-29 Price Changed $73,000 RGVMLS
- 2026-01-01 Delisted — RGVMLS
- 2025-10-25 Price Changed $69,500 RGVMLS
- 2025-09-18 Price Changed $70,000 RGVMLS
- 2025-06-12 Price Changed $74,995 RGVMLS
- 2025-04-02 Relisted — RGVMLS
- 2025-04-01 Delisted — RGVMLS
- 2025-02-15 Price Changed $74,999 RGVMLS
- 2025-02-01 Relisted — RGVMLS
- 2025-01-03 Relisted — RGVMLS
- 2025-01-01 Delisted — RGVMLS
- 2024-10-29 Listed $75,000 RGVMLS
Property tax history
+3.7%/yrLatest (2025): $1,368 · -0.2% YoY. Source: county tax records.
Cash-flow waterfall
monthlySold comps — $/sqft
last 12 mo · ≤1 miLoading sold comps…