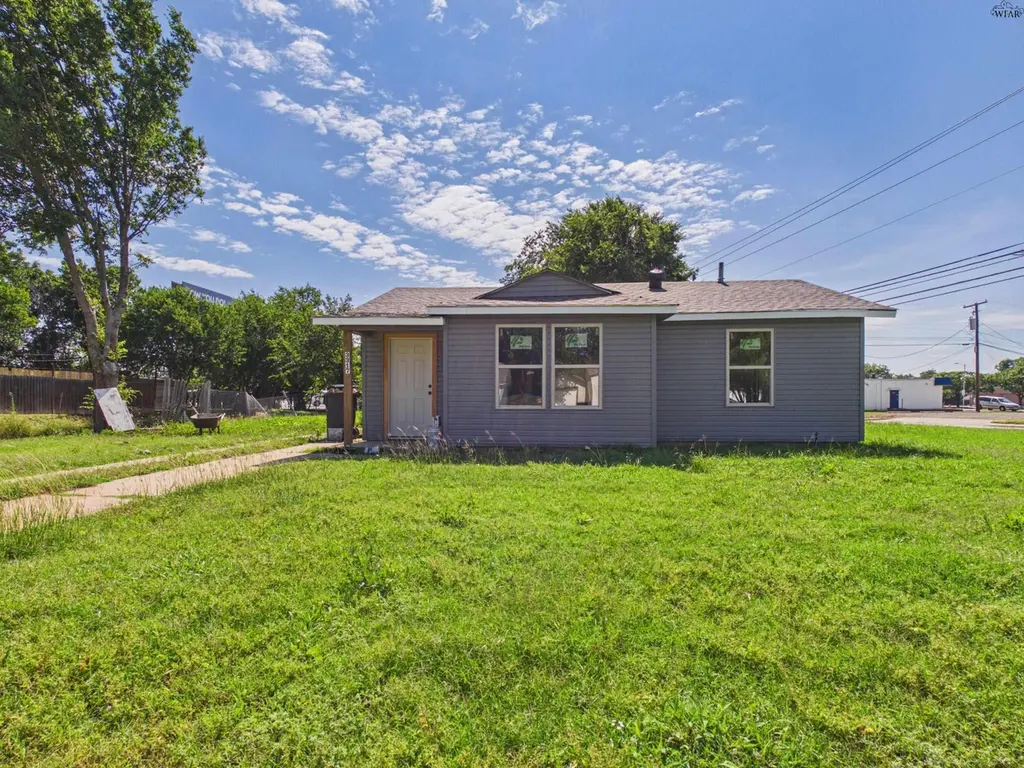
3317 Buchanan St · Wichita Falls, TX
Flood risk 6/10 · Moderate
- FEMA flood zone
- AE
- Chance of flooding over 30 yrs
- 0.67%
- Est. flood insurance / yr
- $1,737 – $8,500
Fire risk 2/10 · Minimal
- Est. fire insurance / yr
- $1,222 – $2,270
Heat risk 7/10 · Major
- Hot days now (above 109°F)
- 7 days/yr
- Hot days in 30 yrs
- 20 days/yr
Wind risk 4/10 · Minor
- Chance of severe wind over 30 yrs
- 8.0%
Air-quality risk 1/10 · Minimal
- Unhealthy air days now
- 0 days/yr
- Unhealthy air days in 30 yrs
- 0 days/yr
Risk factors via First Street. Map © Google.
Why this score? — see what drove the B+ grade
The composite is a weighted blend of 9 inputs, each scored 0–100. Each bar is that input's sub-score; the figure is the points it added to the 100-point composite (weight × sub-score).
- Cash flow +30.0/30.0
- ARV discount +15.0/15.0
- DSCR +10.0/10.0
- 1% rule +9.6/10.0
- Livability +3.5/5.0
- Rent growth +3.4/5.0
- Schools +2.7/10.0
- Condition / age +2.5/5.0
- Appreciation +0.0/10.0
$82,000
🖨 Deal sheet (PDF) 📄 Offer letter ✓ Due diligence
Listing remarks
Investor opportunity in a prime location! Renovations have been started, making this the perfect chance to finish the project and build instant equity. Exterior updates include new vinyl siding, windows, paint, and a covered front entry. Inside offers updated flooring, fresh paint, modern trim, and an open-concept layout filled with natural light. Kitchen and some bath finishes remain incomplete. Ideal for a flip, rental, or STR with excellent income potential. Sold AS-IS.
Key facts
- Income potential
- Natural light
- Vinyl siding
Tags
Property features AI
Exterior
- Utilities: Public water; Public sewer
- Home design: Single-family residence; One story
- Construction: Vinyl siding
- Exterior features: Composition roof; Zoned Limited Commercial
Interior
- Flooring: Laminate
- Interior features: Laminate flooring
Neighborhood map
What this means for you Summary
Snapshot
- This is a 3-bed/1.0-bath single-family listed at $82k.
Deal economics
- At list price, monthly cash flow is $-59 ($-708/yr) — negative.
- To cash-flow at today's rent, offer at most $72k (12.7% below list).
- Meets the 1% rule at list price ($1k rent vs $82k).
- Recommended offer: $72k (12.7% below list) — sets the bar for cash-flow.
- Cap rate 11.7% vs local median 4.7% in Wichita Falls — top-decile yield for the area; either an underpriced asset or a hidden risk that comps aren't pricing in. Stress-test before assuming the spread holds.
Location & tenants
- Location reads 69/100 on livability (#437 in TX) — a middle-class / working-renter tenant base. Strengths: cost of living A+, housing A+; Watch: health & safety C-, employment D+, schools D.
- Wichita Falls ISD (urban): math 31% / reading 33% proficiency, ranked #585 of 826 in TX (top 71%) — families likely to look elsewhere, expect single-tenant / working-renter base with shorter leases.
- Market conditions: Rents rising (+3.8%/yr); 130 active listings in the ZIP; 17 comparable units currently listed for rent nearby; rentals lingering (median 45d on market — plan ~5-8 weeks vacancy on turnover, expect pricing pressure); 100% of comp listings sitting > 30 days — soft ceiling on asking rent; 231 units permitted in Wichita County in 2024 (10 in 5+ unit buildings).
Forward outlook
- Local home prices are declining (-3.0%/yr); year-one equity from $567 of loan paydown is wiped out by about $2k of value loss. Plan a longer hold.
- Wichita County population projected to shrink 7% by 2050 — rents likely to lag national; underwrite the cash flow, not the appreciation.
Negotiation context
- Only 13 days on market — expect competitive offers; lowballing is unlikely to land.
Risks & watch-outs
- Watch-outs: flood insurance adds $427/mo; built in 1954 — expect roof / HVAC / electrical / plumbing capex.
- Climate carrying-cost: in FEMA flood zone AE (mandatory federal flood insurance); extreme-heat days projected 7→20/yr by 2055 (HVAC capex compounding) — expect insurance premiums to compound above CPI over the hold.
Questions for the listing agent
- What do current leases actually rent for vs. the listed asking? Can we see a recent rent roll and the last 12 months of T-12 income?
- Built in 1954 — when were the roof, HVAC, electrical panel, plumbing, and water heater last replaced?
- What's the actual annual flood-insurance premium (NFIP or private), and is the property in a SFHA with mandatory coverage?
- Is there a deadline driving the sale (1031 exchange, divorce, estate, relocation)? That informs how much negotiation room exists.
- Schools are D-rated, which usually means shorter tenancies and higher turnover. Who's the typical renter profile here, and what's been the actual vacancy rate?
- Crime grade is D in this area — have there been break-ins, vandalism, or insurance claims at this property in the last 3 years? What carrier currently insures it and at what premium?
- What's the average days-on-market for RENTAL listings here right now (not sales)? A rising rental-DOM trend means longer vacancies and softer asking-rent achievability than the comps imply.
- What's the recent tenant-quality profile in this submarket — average credit score on applications, eviction rate, late-payment / NSF rate, and stable-employment percentage? A property-management company in the area should have these aggregated.
- How much new for-sale + rental construction is in the pipeline within 1–3 miles? Heavy new supply typically softens prices + rents 12–24 months out; constrained supply supports both.
Investment metrics
- 1% rule
- 1.46% ✓
- Cap rate
- 11.67%
- Cash-on-cash
- 19.21%
- DSCR
- 1.85
- GRM
- 5.7
CMA / ARV
- ARV (on-the-fly)
- $111,360
- Comps found
- 2
Show comp detail 2 sales within ~0.75 mi
| Address | Dist | Beds/Ba | Sqft | Sold | Price | $/sf | Match |
|---|---|---|---|---|---|---|---|
| 3105 Grant St | 0.25mi | 2/1.0 (-1) | 988 (+3%) | 4mo | $115,000 | $116 | 75 |
| 2801 Sherman Rd | 0.67mi | 2/1.0 (-1) | 966 (+1%) | 16mo | $25,000 | $26 | 49 |
Match score weights: distance 35% · size 25% · config 20% · recency 20%. Top-matched comps best support the ARV.
Projected returns pro-forma
-3.0% appreciation · 3.77% rent growth · sell at horizon
- IRR
- -19.4%
- Equity multiple
- 0.31×
- Total profit
- $-15,827
- Equity at exit
- $12,226
- IRR
- -8.8%
- Equity multiple
- 0.41×
- Total profit
- $-13,570
- Equity at exit
- $7,090
Cash invested: $22,960 (down + closing). Projections, not guarantees.
Landlord ↔ Tenant lean methodology
- Overall (STATE)
- 87 Strongly Landlord-Friendly
- State Texas
- 87 Strongly Landlord-Friendly · R+5
- County
- — inherits STATE
- City
- — inherits STATE
ZIP-level market 76308
- Rents YoY
- 3.8%
- Active inventory
- 130
- Price-to-rent
- 5.7×
Monthly cashflow live
- Estimated rent
- $1,195 high interval (Pro) →
- Mortgage (P&I)
- −$430
- Tax from tax record
- −$112 /mo · $1,350/yr
- Insurance
- −$34
- Flood insurance flood zone
- −$427 /mo · $5,118/yr
- HOA
- −$0
- Vacancy / Maint / Mgmt
- −$251
- Net cashflow
- $-59
Break-even live
Sensitivity live
| Price | -10% $-13 | -5% $-36 | +0% $-59 | +5% $-82 | +10% $-105 |
|---|---|---|---|---|---|
| Rent | -10% $-153 | -5% $-106 | +0% $-59 | +5% $-12 | +10% $35 |
| Rate | -1.0pp $-18 | -0.5pp $-38 | base $-59 | +0.5pp $-80 | +1.0pp $-102 |
UW: 25.0% down · 7.5% · 30yr · 1.5% tax · 5.0% vac · 8.0% maint · 8.0% mgmt
Financing live
Cash to close
- Down payment
- $20,500
- Closing costs
- $2,460
- Reserves months
- —
- Total cash needed
- —
Loan-product check · same deal, 3 products live
Conventional
25% down · 7.5% · 30yr
- Down + closing
- —
- Monthly P&I
- —
- Monthly cashflow
- —
- DSCR
- —
- Eligible?
- —
Personal DTI + credit; lowest rate.
DSCR
20% down · 8.5% · 30yr
- Down + closing
- —
- Monthly P&I
- —
- Monthly cashflow
- —
- DSCR
- —
- Eligible?
- —
No personal income docs; deal must DSCR.
Hard money
10% down · 12.0% · 12mo
- Down + closing
- —
- Monthly P&I
- —
- Monthly cashflow
- —
- DSCR
- —
- Eligible?
- —
Short-term bridge; refi at stabilization.
Rent comps 17 comps
| Address | Beds | Baths | Sqft | Rent | $/sqft | DOM | Units | Dist |
|---|---|---|---|---|---|---|---|---|
| 2812 Avenue R Unit R Wichita Falls, TX | 2.0 | 1.0 | 1044 | $925 | $0.89 | 45d | 1 | 0.57mi |
| 2500 Taylor St Unit 2500 Taylor A Wichita Falls, TX | 2.0 | 1.0 | 910 | $800 | $0.88 | 45d | 1 | 0.73mi |
| 2809 Lebanon Rd Wichita Falls, TX | 2.0 | 1.0 | 600 | $800 | $1.33 | 45d | 1 | 0.78mi |
| 2204 Tilden St Unit A Wichita Falls, TX | 3.0 | 2.0 | 872 | $930 | $1.07 | 45d | 1 | 0.99mi |
| 2304 Avenue K Wichita Falls, TX | 3.0 | 2.0 | 1040 | $1,050 | $1.01 | 45d | 1 | 1.02mi |
| 2912 Avenue L Unit L Wichita Falls, TX | 2.0 | 1.0 | 1104 | $895 | $0.81 | 45d | 1 | 1.04mi |
| 2003 Buchanan St Wichita Falls, TX | 3.0 | 2.0 | 1118 | $1,100 | $0.98 | 45d | 1 | 1.12mi |
| 4000 Weeks Park Ln Wichita Falls, TX | 1.0–3.0 | 1.0–2.0 | 870 | $1,425 | $1.64 | 45d | 12 | 1.14mi |
| 1813 Polk St Wichita Falls, TX | 3.0 | 2.0 | 1090 | $1,364 | $1.25 | 45d | 1 | 1.20mi |
| 2006 Bell St Wichita Falls, TX | 3.0 | 1.0 | 1120 | $1,000 | $0.89 | 45d | 1 | 1.24mi |
| 2130 Avenue K Wichita Falls, TX | 3.0 | 2.0 | 1090 | $1,390 | $1.28 | 45d | 1 | 1.26mi |
| 3706 Seymour Rd Wichita Falls, TX | 1.0–3.0 | 1.0–2.5 | 1100 | $1,375 | $1.25 | 45d | 13 | 1.27mi |
| 2612 Southwest Pkwy Wichita Falls, TX | 1.0–2.0 | 1.0–2.0 | 987 | $1,250 | $1.27 | 45d | 23 | 1.36mi |
| 1901 Giddings St Wichita Falls, TX | 3.0 | 2.0 | 909 | $1,175 | $1.29 | 45d | 1 | 1.39mi |
| 4611 Taft Blvd Wichita Falls, TX | 2.0 | 2.0 | 952 | $735 | $0.77 | 45d | 1 | 1.44mi |
| 1515 Fillmore St Wichita Falls, TX | 3.0 | 2.0 | 909 | $1,225 | $1.35 | 45d | 1 | 1.47mi |
| 1901 Wenonah Ave Unit B Wichita Falls, TX | 2.0 | 1.0 | 946 | $1,000 | $1.06 | 45d | 1 | 1.49mi |
Listing history 10 events
-
2026-06-10days on market $82,000 Active 13 DOM
-
2026-06-09days on market $82,000 Active 12 DOM
-
2026-06-08days on market $82,000 Active 11 DOM
-
2026-06-07days on market $82,000 Active 10 DOM
-
2026-06-05days on market $82,000 Active 7 DOM
-
2026-06-02days on market $82,000 Active 5 DOM
-
2026-06-01days on market $82,000 Active 4 DOM
-
2026-05-31days on market $82,000 Active 3 DOM
-
2026-05-30days on market $82,000 Active 2 DOM
-
2026-05-28$82,000 Active
ⓘ Source: listings_history table (triggers on properties + properties_extension) + one-shot
backfill from property_details.listing_events for pre-trigger history.
Tax reassessment forecast TX · Resets to sale price
- Current annual tax
- $1,350 · $112/mo
- Projected year-2 tax
- $1,501 · $125/mo
- Expected delta
- +$151/yr (+$13/mo · 11.2%)
ⓘ Screening estimate from a state-policy table — verify with the county assessor before closing.
Climate risk First Street
- Flood 6/10 Major FEMA zone AE · 67% chance over 30 yrs
- Wildfire 2/10 Low
- Heat 7/10 Severe 7 d/yr ≥109°F today · 20 d/yr by 30 yrs out
- Wind 4/10 Moderate 8% chance of damaging wind over 30 yrs
- Air quality 1/10 Low 0 unhealthy d/yr today · 0 by 30 yrs out
Nearby sold comps map
Loading sold comps map…
Walkable amenities ~0.75 mi
Loading nearby amenities…
Taxation est. · year 1
- Rental income
- $14,342
- − Mortgage interest
- −$4,593
- − Property taxes
- −$1,350
- − Insurance
- −$5,528
- − Repairs & maintenance
- −$1,147
- − Management
- −$1,147
- − Depreciation
- −$2,385
- Taxable loss
- −$1,810
- Est. tax savings @ 24.0%
- +$434
- After-tax cash flow
- $-274/yr
For passive investors: Depreciation is non-cash, so a rental often shows a tax loss while cash-flowing — sheltering income. Rental losses are passive: they offset passive income freely, and up to $25,000/yr can offset ordinary (W-2) income if you actively participate and your MAGI is under $100k (phasing out to $0 by $150k); unused losses carry forward. On sale, claimed depreciation is recaptured at up to 25%, and gains may owe capital-gains tax (a 1031 exchange can defer both). Figures are a year-1 estimate at your 24.0% rate — not tax advice; consult a CPA.
Schools (NCES district)
- District
- Wichita Falls ISD
- NCES district ID
- 4845780
- Math proficiency
- 31% ▼ -10.00%
- Reading proficiency
- 33% ▼ -7.00%
- Median HH income
- $41,604
- Composite
- 27.06/100
- National rank
- #7051
- State rank
- #585 of 826 in TX
Livability — Wichita Falls
- Score
- 69/100
- State rank
- #437
- US rank
- #8940
Category grades
Schools grade is shown separately in the Schools card above.
Census & demographics
- Census place
- Wichita Falls, TX
- County
- Wichita County · 95,694 people
- City population
- 95,694
- Metro
- Wichita Falls, TX
- Population (ZIP)
- 21,896
- Household income
- $74,772
- Rent vs Own
- Severe rent burden
- 708.0
Population outlook (Wichita County) Hauer SSP2
- Today (2025)
- 129,638 people
- By 2030
- 128,366 · -1.0%
- By 2040
- 124,466 · -4.0%
- By 2050
- 120,499 · -7.0%
- By 2075
- 113,884 · -12.2%
- By 2100
- 101,818 · -21.5%
Race, ethnicity, and origin ACS 2023
- Neighborhood character
- Predominantly White (72%)
- Race & ethnicity
- White 72% Hispanic / Latino 16% Black 9% Two or more races 7% Asian 1%
- Hispanic origin (detail)
- Mexican 13%
- Common ancestry
- Serbian 2% Italian 2% Slovak 1%
- Foreign-born
- 6% · Canada
- Languages at home
- 90% English-only · Spanish 6% Arabic 1% German/W. Germanic 1%
Political lean MEDSL · Wichita
- 2024 margin
- Solid R (+44.0) · D 27.5% · R 71.5%
- 2008→2024 swing
- -5.2pp toward R · 2008: -38.9pp · 2024: -44.0pp
- All cycles
- 2024: R+44.0 2020: R+41.1 2016: R+49.7 2012: R+47.1 2008: R+38.9
Not yet ingested
- Civics
- —
Market trends
- HPI YoY
- ▼ -118.47%
- Current HPI
- 177.1989
- Rent YoY
- ▲ 3.77%
- Metro
- Wichita Falls, TX
- State GDP YoY
- ▲ 3.95%
- F500 in state
- 110
Industry mix (Fortune 500 HQ in TX)
| Industry | F500 HQs | Revenue |
|---|---|---|
| Energy | 16 | $1,198B |
|
||
| Technology | 5 | $198B |
|
||
| Engineering / Construction | 4 | $72B |
|
||
| Energy Services | 3 | $60B |
|
||
| Utilities | 3 | $41B |
|
||
| Healthcare | 2 | $330B |
|
||
Price history
1 event — show timeline
- 2026-05-28 Listed $82,000 WFAOR
Property tax history
+4.3%/yrLatest (2025): $1,350 · -1.0% YoY. Source: county tax records.
Cash-flow waterfall
monthlySold comps — $/sqft
last 12 mo · ≤1 miLoading sold comps…