 🔨 Auction
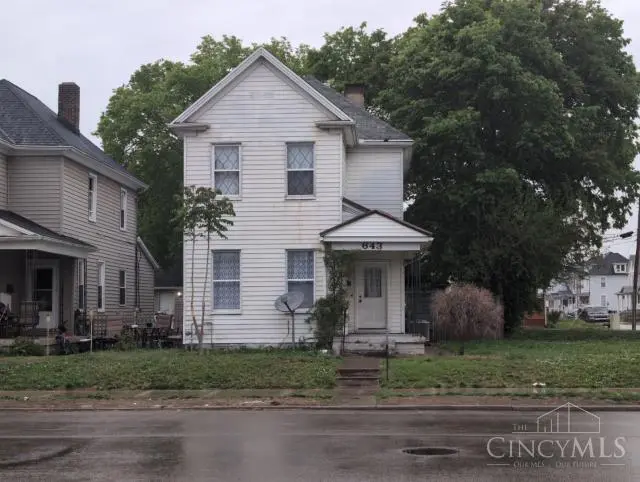
643 Huffman Ave · Dayton, OH
Flood risk 1/10 · Minimal
- FEMA flood zone
- X (unshaded)
- Chance of flooding over 30 yrs
- 0.0%
- Est. flood insurance / yr
- $473 – $860
Fire risk 1/10 · Minimal
- Est. fire insurance / yr
- $713 – $1,323
Heat risk 4/10 · Minor
- Hot days now (above 101°F)
- 7 days/yr
- Hot days in 30 yrs
- 18 days/yr
Wind risk 2/10 · Minimal
- Chance of severe wind over 30 yrs
- 1.0%
Air-quality risk 3/10 · Minor
- Unhealthy air days now
- 2 days/yr
- Unhealthy air days in 30 yrs
- 4 days/yr
Risk factors via First Street. Map © Google.
Why this score? — see what drove the D+ grade
The composite is a weighted blend of 9 inputs, each scored 0–100. Each bar is that input's sub-score; the figure is the points it added to the 100-point composite (weight × sub-score).
- Cash flow +20.0/30.0
- ARV discount +7.5/15.0
- DSCR +6.3/10.0
- 1% rule +5.3/10.0
- Rent growth +3.4/5.0
- Livability +3.2/5.0
- Condition / age +2.5/5.0
- Schools +1.3/10.0
- Appreciation +0.0/10.0
$7,767
🖨 Deal sheet 📄 Offer letter ✓ Due diligence
Listing remarks
Court Ordered Sale by Private Selling Officer. Auction ends on May 27, 2026. All information we have on the property is included. We have no additional information, property condition is unknown. NO SHOWINGS, NO trespassing for any reason. Information is thought to be correct but not guaranteed. 10% Buyer Premium added to the high bid, $5,000 deposit is due within 24 hours of bidding end.
Key facts
- 4,251 sq ft lot
- Built 1905
- Listed 7 days
Property features AI
Finance
- Financial info: Auction: Yes; Lease not considered
- HOA & community: No HOA
Exterior
- Utilities: Public water; Public sewer; Natural gas
- Home design: Traditional style single-family home; Two levels
- Construction: Shingle roof; Block foundation
- Exterior features: Aluminum windows; Vinyl siding
Interior
- Kitchen: Kitchen approximately 10 x 10
- Bedrooms: Four bedrooms total; Primary bedroom approximately 10 x 10 (on level 1); Bedroom 2 approximately 10 x 10 (level 2); Bedroom 3 approximately 10 x 10 (level 2); Bedroom 4 approximately 9 x 9 (level 2); Primary bedroom features: Other
- Bathrooms: One full bathroom; One half bathroom; Primary bathroom with shower; A full bathroom located on level 2 and a partial bath on level 1
- Heating & cooling: Steam heating; Water heating: Other
- Interior features: Partial basement; Seven total rooms
Neighborhood map
What this means for you Summary
Snapshot
- This is a 4-bed/1.5-bath single-family listed at $8k.
Deal economics
- At list price, monthly cash flow is $158 ($2k/yr) — positive.
- The deal already cash-flows at list — no discount required.
- Meets the 1% rule at list price ($1k rent vs $8k).
Location & tenants
- Location reads 65/100 on livability (#716 in OH) — a middle-class / working-renter tenant base. Strengths: cost of living A+, housing A+, health & safety A; Watch: schools C-, amenities C-, crime F.
- Dayton City (urban): math 12% / reading 21% proficiency, ranked #641 of 656 in OH (top 98%) — low school quality limits family demand, transient renter base, plan for 1-2y turnover; 74% free/reduced lunch — lower-income household profile, screen leases tightly.
- Market conditions: Rents rising (+3.7%/yr); 77 active listings in the ZIP; 35 comparable units currently listed for rent nearby; rentals at typical pace (median 24d on market — plan ~3-4 weeks tenant-placement turnaround); lower-income renter base — watch delinquency; 907 units permitted in Montgomery County in 2024 (416 in 5+ unit buildings).
- This rent runs 41% of the median local income ($38k/yr) — at the standard rent-burdened threshold; future hikes will face affordability resistance.
Forward outlook
- Local home prices are declining (-3.0%/yr); year-one equity from $886 of loan paydown is wiped out by about $4k of value loss. Plan a longer hold.
- Montgomery County population projected at -10% by 2050 — secular population decline; favor cash flow + early exit over multi-decade hold.
Negotiation context
- Only 8 days on market — expect competitive offers; lowballing is unlikely to land.
- 3 sale attempts since 11y ago with the ask held roughly flat each time — persistent listings suggest the price (not the market) is what's stuck; bring a comps-based counter.
Risks & watch-outs
- Watch-outs: property tax is 24.7% of price; built in 1905 — expect roof / HVAC / electrical / plumbing capex.
Questions for the listing agent
- Built in 1905 — when were the roof, HVAC, electrical panel, plumbing, and water heater last replaced?
- Property tax is high relative to price — has the assessment been appealed recently, and will the sale trigger a re-assessment?
- Is there a deadline driving the sale (1031 exchange, divorce, estate, relocation)? That informs how much negotiation room exists.
- Crime grade is F in this area — have there been break-ins, vandalism, or insurance claims at this property in the last 3 years? What carrier currently insures it and at what premium?
- The area grade is low — what's the realistic commute time and amenity access for the typical tenant pool here? Any planned neighborhood developments (good or bad) we should know about?
- What's the average days-on-market for RENTAL listings here right now (not sales)? A rising rental-DOM trend means longer vacancies and softer asking-rent achievability than the comps imply.
- What's the recent tenant-quality profile in this submarket — average credit score on applications, eviction rate, late-payment / NSF rate, and stable-employment percentage? A property-management company in the area should have these aggregated.
- How much new for-sale + rental construction is in the pipeline within 1–3 miles? Heavy new supply typically softens prices + rents 12–24 months out; constrained supply supports both.
Investment metrics
- 1% rule
- 1.03% ✓
- Cap rate
- 7.77%
- Cash-on-cash
- 5.28%
- DSCR
- 1.23
- GRM
- 8.1
CMA / ARV
- ARV (on-the-fly)
- $128,152
- Comps found
- 12
Show comp detail 12 sales within ~0.75 mi
| Address | Dist | Beds/Ba | Sqft | Sold | Price | $/sf | Match |
|---|---|---|---|---|---|---|---|
| 1609 Xenia Ave | 0.41mi | 3/1.0 (-1) | 1,533 (-1%) | 4mo | $110,000 | $72 | 70 |
| 800 Linden Ave | 0.41mi | 3/1.5 (-1) | 1,472 (-5%) | 0mo | $62,500 | $42 | 68 |
| 107 Sherman St | 0.37mi | 3/1.5 (-1) | 1,446 (-6%) | 2mo | $73,000 | $50 | 65 |
| 523 Carlisle Ave | 0.50mi | 4/2.0 | 1,438 (-7%) | 4mo | $110,000 | $76 | 60 |
| 804 Linden Ave | 0.41mi | 3/2.0 (-1) | 1,395 (-10%) | 1mo | $86,000 | $62 | 57 |
| 700 Bowen St | 0.62mi | 4/1.5 | 1,664 (+8%) | 3mo | $240,000 | $144 | 56 |
| 15 Drury St | 0.68mi | 3/1.5 (-1) | 1,464 (-5%) | 0mo | $181,000 | $124 | 54 |
| 736 Hodapp Ave | 0.73mi | 3/1.0 (-1) | 1,560 (+1%) | 4mo | $101,005 | $65 | 54 |
| 1116 Linden Ave | 0.69mi | 4/3.0 | 1,600 (+4%) | 3mo | $157,000 | $98 | 54 |
| 42 S Monmouth St | 0.40mi | 3/2.0 (-1) | 1,332 (-14%) | 3mo | $109,900 | $83 | 49 |
| 133 Linsan Ct | 0.57mi | 3/1.5 (-1) | 1,339 (-13%) | 3mo | $135,000 | $101 | 44 |
| 133 Samuel St | 0.65mi | 3/2.5 (-1) | 1,764 (+14%) | 2mo | $230,000 | $130 | 36 |
Match score weights: distance 35% · size 25% · config 20% · recency 20%. Top-matched comps best support the ARV.
Projected returns pro-forma
-3.0% appreciation · 3.71% rent growth · sell at horizon
- IRR
- -7.3%
- Equity multiple
- 0.73×
- Total profit
- $-9,738
- Equity at exit
- $19,108
- IRR
- 3.2%
- Equity multiple
- 1.24×
- Total profit
- $8,508
- Equity at exit
- $11,080
Cash invested: $35,883 (down + closing). Projections, not guarantees.
Landlord ↔ Tenant lean methodology
- Overall (STATE)
- 73 Landlord-Friendly
- State Ohio
- 73 Landlord-Friendly · R+6
- County
- — inherits STATE
- City
- — inherits STATE
ZIP-level market 45403
- Home prices YoY
- -3.7%
- Rents YoY
- 3.7%
- Active inventory
- 77
- Price-to-rent
- 0.5×
Monthly cashflow live
- Estimated rent
- $1,321 high interval (Pro) →
- Mortgage (P&I)
- −$672
- Tax est. 1.5%
- −$160 /mo · $1,922/yr
- Insurance
- −$53
- HOA
- −$0
- Vacancy / Maint / Mgmt
- −$277
- Net cashflow
- $158
Break-even live
UW: 25.0% down · 7.5% · 30yr · 1.5% tax · 5.0% vac · 8.0% maint · 8.0% mgmt
Financing live
Cash to close
- Down payment
- $32,038
- Closing costs
- $3,845
- Reserves months
- —
- Total cash needed
- —
Loan-product check · same deal, 3 products live
Conventional
25% down · 7.5% · 30yr
- Down + closing
- —
- Monthly P&I
- —
- Monthly cashflow
- —
- DSCR
- —
- Eligible?
- —
Personal DTI + credit; lowest rate.
DSCR
20% down · 8.5% · 30yr
- Down + closing
- —
- Monthly P&I
- —
- Monthly cashflow
- —
- DSCR
- —
- Eligible?
- —
No personal income docs; deal must DSCR.
Hard money
10% down · 12.0% · 12mo
- Down + closing
- —
- Monthly P&I
- —
- Monthly cashflow
- —
- DSCR
- —
- Eligible?
- —
Short-term bridge; refi at stabilization.
Rent comps 35 comps
| Address | Beds | Baths | Sqft | Rent | $/sqft | DOM | Units | Dist |
|---|---|---|---|---|---|---|---|---|
| 424 Bantz Ct Dayton, OH | 3.0 | 1.0 | 1192 | $1,050 | $0.88 | 3d | 1 | 0.23mi |
| 314 Sheridan Ave Dayton, OH | 3.0 | 1.0 | 1258 | $1,150 | $0.91 | 3d | 1 | 0.29mi |
| 115 Livingston Ave Dayton, OH | 3.0 | 1.0 | 1624 | $1,450 | $0.89 | 44d | 1 | 0.41mi |
| 29 N Garfield St Dayton, OH | 3.0 | 1.0 | 1092 | $1,000 | $0.92 | 23d | 1 | 0.52mi |
| 511 Parrot St Dayton, OH | 3.0 | 1.5 | 1618 | $1,100 | $0.68 | 14d | 1 | 0.55mi |
| 637 Creighton Ave Dayton, OH | 3.0 | 1.0 | 1144 | $1,350 | $1.18 | 14d | 1 | 0.57mi |
| 706 Kolping Ave Unit 706 Dayton, OH | 3.0 | 1.5 | 1172 | $1,300 | $1.11 | 3d | 1 | 0.81mi |
| 3707 E 3rd St Unit 3705 Dayton, OH | 3.0 | 1.0 | 1410 | $1,045 | $0.74 | 23d | 1 | 0.84mi |
| 1515 Wyoming St Dayton, OH | 3.0 | 1.0 | 1400 | $1,000 | $0.71 | 44d | 1 | 0.85mi |
| 3719 E 3rd St Unit 3717 Dayton, OH | 3.0 | 1.0 | 1092 | $1,100 | $1.01 | 3d | 1 | 0.85mi |
| 836 Wellmeier Ave Dayton, OH | 4.0 | 1.0 | 2148 | $1,500 | $0.70 | 3d | 1 | 0.86mi |
| 1411 Wyoming St Dayton, OH | 3.0 | 1.0 | 1256 | $1,095 | $0.87 | 3d | 1 | 0.86mi |
| 438 Clover St Dayton, OH | 3.0 | 2.0 | 2156 | $1,025 | $0.48 | 44d | 1 | 0.89mi |
| 854 Santa Cruz Ave Dayton, OH | 3.0 | 1.0 | 1060 | $1,300 | $1.23 | 44d | 1 | 0.92mi |
| 1101 Phillips Ave Unit 1101 Dayton, OH | 3.0 | 1.5 | 1300 | $1,450 | $1.12 | 44d | 1 | 0.94mi |
| 4403 Burkhardt Ave Dayton, OH | 3.0 | 1.0–2.0 | 800 | $1,100 | $1.38 | 3d | 1 | 1.04mi |
| 136 Indiana Ave Dayton, OH | 3.0 | 1.0 | 1194 | $1,250 | $1.05 | 23d | 1 | 1.05mi |
| 1020 Walnut Hill Pl Dayton, OH | 3.0 | 1.0 | 1200 | $1,400 | $1.17 | 44d | 1 | 1.05mi |
| 1038 Walnut Hill Pl Dayton, OH | 3.0 | 1.0 | 1232 | $1,095 | $0.89 | 44d | 1 | 1.08mi |
| 244 Quitman St Unit A Dayton, OH | 3.0 | 1.0 | 1987 | $1,325 | $0.67 | 23d | 1 | 1.09mi |
| 20 Lucerne Ave Dayton, OH | 3.0 | 1.0 | 1378 | $1,200 | $0.87 | 44d | 1 | 1.11mi |
| 32 Gebhart St Dayton, OH | 4.0 | 1.0 | 1800 | $1,400 | $0.78 | 14d | 1 | 1.18mi |
| 1520 S Smithville Rd Dayton, OH | 3.0 | 2.0 | 1481 | $1,345 | $0.91 | 3d | 1 | 1.24mi |
| 1603 Manette Pl Dayton, OH | 4.0 | 2.0 | 2000 | $1,695 | $0.85 | 14d | 1 | 1.25mi |
| 320 Park Dr Dayton, OH | 4.0 | 3.0 | 2100 | $2,400 | $1.14 | 14d | 1 | 1.28mi |
| 313 Illinois Ave Dayton, OH | 3.0 | 1.0 | 1142 | $975 | $0.85 | 3d | 1 | 1.28mi |
| 228 James St Dayton, OH | 3.0 | 1.0 | 1700 | $1,200 | $0.71 | 44d | 1 | 1.29mi |
| 227 James St Unit 1 Dayton, OH | 3.0 | 1.0 | 1700 | $1,200 | $0.71 | 3d | 1 | 1.30mi |
| 229 James St Unit 228 Dayton, OH | 3.0 | 1.0 | 1700 | $1,200 | $0.71 | 23d | 1 | 1.31mi |
| 519 Wyoming St Dayton, OH | 3.0 | 1.5 | 1240 | $1,600 | $1.29 | 44d | 1 | 1.31mi |
| 2114 Wayne Ave Dayton, OH | 4.0 | 2.0 | 1723 | $1,595 | $0.93 | 44d | 1 | 1.31mi |
| 2132 Wayne Ave Dayton, OH | 3.0 | 2.0 | 1484 | $1,350 | $0.91 | 3d | 1 | 1.32mi |
| 2600 Wayne Ave Dayton, OH | 4.0 | 1.5 | 1328 | $1,500 | $1.13 | 23d | 1 | 1.35mi |
| 920 E Stewart St Dayton, OH | 4.0 | 1.0 | 1322 | $1,425 | $1.08 | 44d | 1 | 1.44mi |
| 531 S Hayden Ave Dayton, OH | 3.0 | 1.0 | 1200 | $1,325 | $1.10 | 11d | 1 | 1.48mi |
Listing history 13 events
-
2026-05-18$7,767 Active
-
2016-10-02price $23,500
-
2016-09-30historical
-
2016-05-14$24,500 Active
-
2016-04-30historical
-
2015-09-24price $24,900
-
2015-08-28price $27,500
-
2015-08-18price $27,900
-
2015-06-03$28,200 Active
-
2005-12-12soldstatus $37,000
-
2002-10-04soldstatus $76,500
-
1989-09-25soldstatus $13,900
-
1989-09-25soldstatus $13,900
ⓘ Source: listings_history table (triggers on properties + properties_extension) + one-shot
backfill from property_details.listing_events for pre-trigger history.
Climate risk First Street
- Flood 1/10 Low FEMA zone X (unshaded) · 0% chance over 30 yrs
- Wildfire 1/10 Low
- Heat 4/10 Moderate 7 d/yr ≥101°F today · 18 d/yr by 30 yrs out
- Wind 2/10 Low 100% chance of damaging wind over 30 yrs
- Air quality 3/10 Moderate 2 unhealthy d/yr today · 4 by 30 yrs out
Nearby sold comps map
Loading sold comps map…
Walkable amenities ~0.75 mi
Loading nearby amenities…
Taxation est. · year 1
- Rental income
- $15,851
- − Mortgage interest
- −$7,179
- − Property taxes
- −$1,922
- − Insurance
- −$641
- − Repairs & maintenance
- −$1,268
- − Management
- −$1,268
- − Depreciation
- −$3,728
- Taxable loss
- −$155
- Est. tax savings @ 24.0%
- +$37
- After-tax cash flow
- $1,932/yr
For passive investors: Depreciation is non-cash, so a rental often shows a tax loss while cash-flowing — sheltering income. Rental losses are passive: they offset passive income freely, and up to $25,000/yr can offset ordinary (W-2) income if you actively participate and your MAGI is under $100k (phasing out to $0 by $150k); unused losses carry forward. On sale, claimed depreciation is recaptured at up to 25%, and gains may owe capital-gains tax (a 1031 exchange can defer both). Figures are a year-1 estimate at your 24.0% rate — not tax advice; consult a CPA.
Schools (NCES district)
- District
- Dayton City
- NCES district ID
- 3904384
- Math proficiency
- 12% ▼ -12.00%
- Reading proficiency
- 21% ▼ -11.00%
- Median HH income
- $28,688
- Composite
- 12.94/100
- National rank
- #9579
- State rank
- #641 of 656 in OH
Livability — Dayton
- Score
- 65/100
- State rank
- #716
- US rank
- #12895
Category grades
Schools grade is shown separately in the Schools card above.
Census & demographics
- Census place
- Dayton, OH
- County
- Montgomery County · 459,541 people
- City population
- 164,387
- Metro
- Dayton-Kettering, OH
- Population (ZIP)
- 13,608
- Household income
- $38,323
- Rent vs Own
- Severe rent burden
- 1071.0
Population outlook (Montgomery County) Hauer SSP2
- Today (2025)
- 523,241 people
- By 2030
- 514,948 · -1.6%
- By 2040
- 493,378 · -5.7%
- By 2050
- 469,639 · -10.2%
- By 2075
- 418,360 · -20.0%
- By 2100
- 353,315 · -32.5%
Race, ethnicity, and origin ACS 2023
- Neighborhood character
- Predominantly White (66%)
- Race & ethnicity
- White 66% Hispanic / Latino 15% Black 14% Two or more races 8% Native American 1%
- Hispanic origin (detail)
- Mexican 7%
- Common ancestry
- Lithuanian 2% Slovak 1% Italian 1%
- Foreign-born
- 9% · Canada
- Languages at home
- 84% English-only · Spanish 13% Other Asian/Pacific 1%
Political lean MEDSL · Montgomery
- 2024 margin
- Toss-up / Even · D 49.8% · R 49.3%
- 2008→2024 swing
- -5.8pp toward R · 2008: 6.2pp · 2024: 0.5pp
- All cycles
- 2024: D+0.5 2020: D+2.2 2016: R+1.2 2012: D+3.1 2008: D+6.2
Not yet ingested
- Civics
- —
Market trends
- HPI YoY
- ▼ -17.40%
- Current HPI
- 447.4034
- Rent YoY
- ▲ 3.71%
- Metro
- Dayton-Kettering, OH
- State GDP YoY
- ▲ 1.98%
- F500 in state
- 48
Industry mix (Fortune 500 HQ in OH)
| Industry | F500 HQs | Revenue |
|---|---|---|
| Insurance | 3 | $145B |
|
||
| Industrial Machinery | 3 | $49B |
|
||
| Financial Services | 3 | $24B |
|
||
| Consumer Goods | 2 | $93B |
|
||
| Aerospace / Defense | 2 | $47B |
|
||
| Utilities | 2 | $33B |
|
||
Price history
-44.1% since first listed13 events — show timeline
- 2026-05-18 Listed $7,767 Cincy MLS
- 2016-10-02 Price Changed $23,500 Dayton MLS
- 2016-09-30 Listing Removed — Dayton MLS
- 2016-05-14 Listed $24,500 Dayton MLS
- 2016-04-30 Listing Removed — Dayton MLS
- 2015-09-24 Price Changed $24,900 Dayton MLS
- 2015-08-28 Price Changed $27,500 Dayton MLS
- 2015-08-18 Price Changed $27,900 Dayton MLS
- 2015-06-03 Listed $28,200 Dayton MLS
- 2005-12-12 Sold (Public Records) $37,000 Public Records
- 2002-10-04 Sold (Public Records) $76,500 Public Records
- 1989-09-25 Sold (Public Records) $13,900 Public Records
- 1989-09-25 Sold (Public Records) $13,900 Public Records
Property tax history
+2.6%/yrLatest (2025): $744 · -0.2% YoY. Source: county tax records.
Cash-flow waterfall
monthlySold comps — $/sqft
last 12 mo · ≤1 miLoading sold comps…