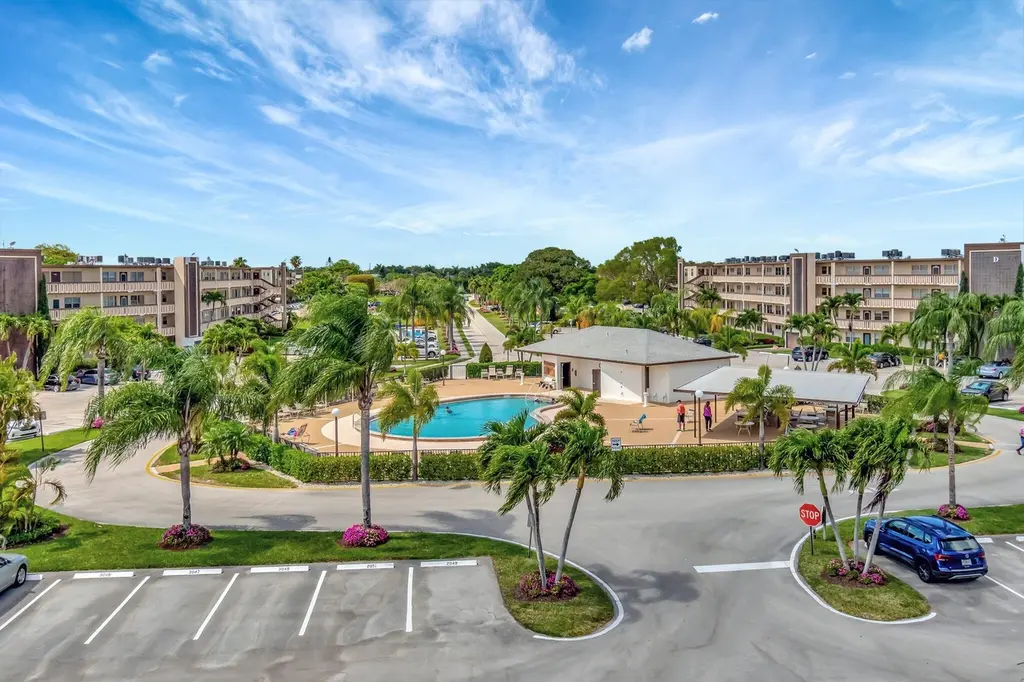
3010 Wolverton A · Boca Raton, FL
Flood risk 1/10 · Minimal
- FEMA flood zone
- X (unshaded)
- Chance of flooding over 30 yrs
- 0.0%
- Est. flood insurance / yr
- $507 – $1,088
Fire risk 1/10 · Minimal
- Est. fire insurance / yr
- $947 – $1,759
Heat risk 9/10 · Severe
- Hot days now (above 107°F)
- 7 days/yr
- Hot days in 30 yrs
- 27 days/yr
Wind risk 10/10 · Severe
- Chance of severe wind over 30 yrs
- 99.0%
Air-quality risk 2/10 · Minimal
- Unhealthy air days now
- 2 days/yr
- Unhealthy air days in 30 yrs
- 2 days/yr
Risk factors via First Street. Map © Google.
Why this score? — see what drove the B grade
The composite is a weighted blend of 9 inputs, each scored 0–100. Each bar is that input's sub-score; the figure is the points it added to the 100-point composite (weight × sub-score).
- Cash flow +30.0/30.0
- 1% rule +10.0/10.0
- DSCR +10.0/10.0
- ARV discount +7.5/15.0
- Schools +4.3/10.0
- Livability +3.9/5.0
- Rent growth +3.0/5.0
- Condition / age +2.5/5.0
- Appreciation +0.0/10.0
$79,900
🖨 Deal sheet (PDF) 📄 Offer letter ✓ Due diligence
Key facts
- Parking
- Built 1984
Neighborhood map
What this means for you Summary
Snapshot
- This is a 1-bed/1.5-bath condo listed at $80k.
Deal economics
- At list price, monthly cash flow is $380 ($5k/yr) — positive.
- The deal already cash-flows at list — no discount required.
- Meets the 1% rule at list price ($2k rent vs $80k).
- Cap rate 12.0% vs local median 2.7% in Boca Raton — top-decile yield for the area; either an underpriced asset or a hidden risk that comps aren't pricing in. Stress-test before assuming the spread holds.
Location & tenants
- Location reads 77/100 on livability (#192 in FL, #3,070 nationally) — a middle-class / working-renter tenant base. Strengths: employment A+, health & safety A+, crime B+; Watch: amenities D, cost of living F.
- Palm Beach (suburban): math 46% / reading 53% proficiency, ranked #34 of 73 in FL (top 47%) — families likely to look elsewhere, expect single-tenant / working-renter base with shorter leases.
- Zoned schools: Whispering Pines Elementary School (math 62% / reading 69%, grade B+, #500 of 2,144 statewide, top 24%, 1,015 students, 25% FRL); Eagles Landing Middle School (math 66% / reading 67%, grade A-, #84 of 571 statewide, top 16%, 1,508 students, 27% FRL); Olympic Heights Community High (math 52% / reading 64%, grade C, #120 of 667 statewide, top 18%, 2,602 students, 30% FRL) — zoned schools average 27% FRL vs 52% district-wide (25 pts lower); this property's tenant base skews higher-income than the district average.
- Zoned-school proficiency averages 63% at this address vs 50% district-wide (+14 pts) — the actual schools serving this property are materially stronger than the Palm Beach average implies; a family-tenant draw the district grade alone would hide.
- Market conditions: Rents rising (+1.8%/yr); 421 active listings in the ZIP; 40 comparable units currently listed for rent nearby; rentals at typical pace (median 26d on market — plan ~3-4 weeks tenant-placement turnaround); solid renter incomes; 3,974 units permitted in Palm Beach County in 2024 (1,012 in 5+ unit buildings).
Forward outlook
- Local home prices are declining (-3.0%/yr); year-one equity from $552 of loan paydown is wiped out by about $2k of value loss. Plan a longer hold.
- Palm Beach County population projected at +30% by 2050 — long-run rental-demand tailwind backs the buy-and-hold thesis.
- At projected returns (-3.0% appreciation + 1.8% rent growth), your $22k cash investment doubles in ~7 years — after that, you're playing with house money.
Negotiation context
- Only 0 days on market — expect competitive offers; lowballing is unlikely to land.
- Current owner paid $38k; list at $80k implies a 110% gain — meaningful room to come down on a strong offer.
Risks & watch-outs
- Watch-outs: HOA is 30% of rent.
- Climate carrying-cost: severe wind risk, 99% chance of damaging wind over 30y; extreme-heat days projected 7→27/yr by 2055 (HVAC capex compounding) — expect insurance premiums to compound above CPI over the hold.
Questions for the listing agent
- What does the HOA fee cover, when was the last increase, and are there any pending special assessments or reserve-fund shortfalls?
- Any open or pending special assessments — roof, HVAC, plumbing, elevator, façade? What's the per-unit balance and payoff schedule, and is the seller paying it off at close or rolling it to the buyer?
- Is there a deadline driving the sale (1031 exchange, divorce, estate, relocation)? That informs how much negotiation room exists.
- Schools are A-rated — typically a magnet for longer-tenancy family renters. What's the average tenant stay here, and is there a school-zone premium baked into asking?
- What's the average days-on-market for RENTAL listings here right now (not sales)? A rising rental-DOM trend means longer vacancies and softer asking-rent achievability than the comps imply.
- What's the recent tenant-quality profile in this submarket — average credit score on applications, eviction rate, late-payment / NSF rate, and stable-employment percentage? A property-management company in the area should have these aggregated.
- How much new apartment / multifamily construction is in the pipeline within 1–3 miles? Heavy new supply (>2% of stock underway) typically softens rents 12–24 months out; light construction supports rent growth.
Investment metrics
- 1% rule
- 2.21% ✓
- Cap rate
- 11.99%
- Cash-on-cash
- 20.36%
- DSCR
- 1.91
- GRM
- 3.8
CMA / ARV
No comps found within radius.
Projected returns pro-forma
-3.0% appreciation · 1.81% rent growth · sell at horizon
- IRR
- 10.9%
- Equity multiple
- 1.42×
- Total profit
- $9,448
- Equity at exit
- $11,913
- IRR
- 18.6%
- Equity multiple
- 2.44×
- Total profit
- $32,246
- Equity at exit
- $6,908
Cash invested: $22,372 (down + closing). Projections, not guarantees.
Landlord ↔ Tenant lean methodology
- Overall (STATE)
- 87 Strongly Landlord-Friendly
- State Florida
- 87 Strongly Landlord-Friendly · R+3
- County
- — inherits STATE
- City
- — inherits STATE
ZIP-level market 33434
- Rents YoY
- 1.8%
- Active inventory
- 421
- Price-to-rent
- 3.8×
Monthly cashflow live
- Estimated rent
- $1,767 high interval (Pro) →
- Mortgage (P&I)
- −$419
- Tax from tax record
- −$27 /mo · $323/yr
- Insurance
- −$33
- HOA est. from 10 same-building comps
- −$537
- Vacancy / Maint / Mgmt
- −$371
- Net cashflow
- $380
Break-even live
Sensitivity live
| Price | -10% $425 | -5% $402 | +0% $380 | +5% $357 | +10% $334 |
|---|---|---|---|---|---|
| Rent | -10% $240 | -5% $310 | +0% $380 | +5% $449 | +10% $519 |
| Rate | -1.0pp $420 | -0.5pp $400 | base $380 | +0.5pp $359 | +1.0pp $338 |
UW: 25.0% down · 7.5% · 30yr · 1.5% tax · 5.0% vac · 8.0% maint · 8.0% mgmt
Financing live
Cash to close
- Down payment
- $19,975
- Closing costs
- $2,397
- Reserves months
- —
- Total cash needed
- —
Loan-product check · same deal, 3 products live
Conventional
25% down · 7.5% · 30yr
- Down + closing
- —
- Monthly P&I
- —
- Monthly cashflow
- —
- DSCR
- —
- Eligible?
- —
Personal DTI + credit; lowest rate.
DSCR
20% down · 8.5% · 30yr
- Down + closing
- —
- Monthly P&I
- —
- Monthly cashflow
- —
- DSCR
- —
- Eligible?
- —
No personal income docs; deal must DSCR.
Hard money
10% down · 12.0% · 12mo
- Down + closing
- —
- Monthly P&I
- —
- Monthly cashflow
- —
- DSCR
- —
- Eligible?
- —
Short-term bridge; refi at stabilization.
Rent comps 40 comps
| Address | Beds | Baths | Sqft | Rent | $/sqft | DOM | Units | Dist |
|---|---|---|---|---|---|---|---|---|
| 4067 Yarmouth D Boca Raton, FL | 1.0 | 1.5 | 738 | $1,650 | $2.24 | 4d | 1 | 0.13mi |
| 1072 Yarmouth E #1072 Boca Raton, FL | 1.0 | 1.5 | 738 | $1,950 | $2.64 | 25d | 1 | 0.14mi |
| 171 Suffolk F #171 Boca Raton, FL | 1.0 | 1.5 | 720 | $1,500 | $2.08 | 12d | 1 | 0.18mi |
| 250 Suffolk F #250 Boca Raton, FL | 1.0 | 1.5 | 720 | $1,450 | $2.01 | 4d | 1 | 0.18mi |
| 68 Suffolk F Unit 68 Boca Raton, FL | 1.0 | 1.5 | 720 | $2,750 | $3.82 | 25d | 1 | 0.18mi |
| 209 Suffolk F Unit F Boca Raton, FL | 1.0 | 1.5 | 720 | $1,400 | $1.94 | 25d | 1 | 0.18mi |
| 4074 Cornwall D Boca Raton, FL | 1.0 | 1.5 | 738 | $1,450 | $1.96 | 25d | 1 | 0.25mi |
| 3031 Cornwall B Boca Raton, FL | 1.0 | 1.5 | 738 | $1,550 | $2.10 | 25d | 1 | 0.26mi |
| 77 Preston Way #77 Boca Raton, FL | 1.0 | 1.0 | 600 | $1,350 | $2.25 | 9d | 1 | 0.28mi |
| 77 Preston Way #77 Boca Raton, FL | 1.0 | 1.0 | 600 | $1,450 | $2.42 | 23d | 1 | 0.28mi |
| 2052 Cornwall Dr Unit 2052 Boca Raton, FL | 1.0 | 1.5 | 738 | $3,150 | $4.27 | 25d | 1 | 0.29mi |
| 3014 Cornwall a Boca Raton, FL | 1.0 | 1.5 | 738 | $1,775 | $2.41 | 3d | 1 | 0.29mi |
| 3070 Cornwall D Boca Raton, FL | 1.0 | 1.5 | 738 | $3,200 | $4.34 | 25d | 1 | 0.29mi |
| 3014 Cornwall a Boca Raton, FL | 1.0 | 1.5 | 738 | $1,650 | $2.24 | 3d | 1 | 0.29mi |
| 91 Preston Way Unit 91 Boca Raton, FL | 1.0 | 1.0 | 600 | $1,500 | $2.50 | 25d | 1 | 0.34mi |
| 149 Preston Way #149 Boca Raton, FL | 1.0 | 1.5 | 720 | $1,350 | $1.88 | 25d | 1 | 0.34mi |
| 149 Preston Way #149 Boca Raton, FL | 1.0 | 1.5 | 720 | $1,300 | $1.81 | 3d | 1 | 0.34mi |
| 4008 Cornwall a Boca Raton, FL | 1.0 | 1.5 | 738 | $1,600 | $2.17 | 25d | 1 | 0.36mi |
| 4014 Newcastle A Unit A Boca Raton, FL | 1.0 | 1.5 | 738 | $1,495 | $2.03 | 25d | 1 | 0.40mi |
| 314 Brighton H Unit H Boca Raton, FL | 1.0 | 1.5 | 720 | $1,500 | $2.08 | 15d | 1 | 0.42mi |
| 251 Brighton F Boca Raton, FL | 1.0 | 1.5 | 720 | $1,450 | $2.01 | 25d | 1 | 0.42mi |
| 321 Dorset Dr Boca Raton, FL | 1.0 | 1.5 | 720 | $1,590 | $2.21 | 25d | 1 | 0.43mi |
| 129 Brighton D Boca Raton, FL | 1.0 | 1.5 | 720 | $1,300 | $1.81 | 25d | 1 | 0.44mi |
| 359 Brighton I Unit I Boca Raton, FL | 1.0 | 1.5 | 735 | $1,550 | $2.11 | 25d | 1 | 0.44mi |
| 251 Brighton Dr Unit 251 Boca Raton, FL | 1.0 | 1.5 | 720 | $1,450 | $2.01 | 9d | 1 | 0.44mi |
| 156 Brighton Dr Unit 156 Boca Raton, FL | 1.0 | 1.5 | 720 | $1,350 | $1.88 | 25d | 1 | 0.45mi |
| 86 Mansfield C Unit C Boca Raton, FL | 1.0 | 1.5 | 720 | $1,700 | $2.36 | 13d | 1 | 0.46mi |
| 534 Mansfield M #534 Boca Raton, FL | 1.0 | 1.5 | 715 | $1,300 | $1.82 | 25d | 1 | 0.46mi |
| 22 Brighton Dr Unit 22 Boca Raton, FL | 1.0 | 1.0 | 600 | $1,300 | $2.17 | 9d | 1 | 0.48mi |
| 517 Mansfield M Unit 517 Boca Raton, FL | 1.0 | 1.5 | 715 | $1,550 | $2.17 | 25d | 1 | 0.49mi |
| 202 Mansfield E Boca Raton, FL | 1.0 | 1.5 | 720 | $1,450 | $2.01 | 0d | 1 | 0.51mi |
| 457 Mansfield I Unit 457 Boca Raton, FL | 1.0 | 1.5 | 720 | $1,700 | $2.36 | 4d | 1 | 0.51mi |
| 119 Dorset Dr Unit 119 Boca Raton, FL | 1.0 | 1.0 | 600 | $1,400 | $2.33 | 25d | 1 | 0.53mi |
| 8 Fanshaw Dr Unit 8 Boca Raton, FL | 1.0 | 1.0 | 585 | $1,300 | $2.22 | 9d | 1 | 0.54mi |
| 474 Mansfield L Unit L Boca Raton, FL | 1.0 | 1.5 | 720 | $1,400 | $1.94 | 12d | 1 | 0.55mi |
| 96 Fanshaw C Boca Raton, FL | 1.0 | 1.5 | 702 | $1,500 | $2.14 | 0d | 1 | 0.58mi |
| 454 Fanshaw K Unit K Boca Raton, FL | 1.0 | 1.5 | 715 | $1,500 | $2.10 | 16d | 1 | 0.58mi |
| 147 Fanshaw D Boca Raton, FL | 1.0 | 1.0 | 601 | $1,350 | $2.25 | 25d | 1 | 0.59mi |
| 119 Fanshaw C Unit 119 Boca Raton, FL | 1.0 | 1.0 | 585 | $1,299 | $2.22 | 25d | 1 | 0.59mi |
| 82 Fanshaw Dr Unit 82 Boca Raton, FL | 1.0 | 1.5 | 702 | $1,250 | $1.78 | 25d | 1 | 0.65mi |
HOA detail condo
- Monthly dues
- $0 · $0/yr
- Assessments
- None detected in remarks — confirm with the listing agent.
Listing history 1 events
-
2026-06-04$79,900 Pending
ⓘ Source: listings_history table (triggers on properties + properties_extension) + one-shot
backfill from property_details.listing_events for pre-trigger history.
Tax reassessment forecast FL · Resets to sale price
- Current annual tax
- $323 · $27/mo
- Projected year-2 tax
- $663 · $55/mo
- Expected delta
- +$340/yr (+$28/mo · 105.0%)
ⓘ Screening estimate from a state-policy table — verify with the county assessor before closing.
Climate risk First Street
- Flood 1/10 Low FEMA zone X (unshaded) · 0% chance over 30 yrs
- Wildfire 1/10 Low
- Heat 9/10 Extreme 7 d/yr ≥107°F today · 27 d/yr by 30 yrs out
- Wind 10/10 Extreme 99% chance of damaging wind over 30 yrs
- Air quality 2/10 Low 2 unhealthy d/yr today · 2 by 30 yrs out
Nearby sold comps map
Loading sold comps map…
Walkable amenities ~0.75 mi
Loading nearby amenities…
Taxation est. · year 1
- Rental income
- $21,202
- − Mortgage interest
- −$4,476
- − Property taxes
- −$323
- − Insurance
- −$400
- − Repairs & maintenance
- −$1,696
- − Management
- −$1,696
- − HOA
- −$6,444
- − Depreciation
- −$2,324
- Taxable income
- $3,843
- Est. tax owed @ 24.0%
- −$922
- After-tax cash flow
- $3,632/yr
For passive investors: Depreciation is non-cash, so a rental often shows a tax loss while cash-flowing — sheltering income. Rental losses are passive: they offset passive income freely, and up to $25,000/yr can offset ordinary (W-2) income if you actively participate and your MAGI is under $100k (phasing out to $0 by $150k); unused losses carry forward. On sale, claimed depreciation is recaptured at up to 25%, and gains may owe capital-gains tax (a 1031 exchange can defer both). Figures are a year-1 estimate at your 24.0% rate — not tax advice; consult a CPA.
Schools (NCES district)
- District
- Palm Beach
- NCES district ID
- 1201500
- Math proficiency
- 46% ▼ -16.00%
- Reading proficiency
- 53% ▼ -4.00%
- Median HH income
- $53,943
- Composite
- 42.72/100
- National rank
- #3160
- State rank
- #34 of 73 in FL
Livability — Boca Raton
- Score
- 77/100
- State rank
- #192
- US rank
- #3070
Category grades
Schools grade is shown separately in the Schools card above.
Census & demographics
- County
- Palm Beach County · 1,438,312 people
- City population
- 250,102
- Metro
- Miami-Fort Lauderdale-Pompano Beach, FL
- Population (ZIP)
- 21,686
- Household income
- $77,269
- Rent vs Own
- Severe rent burden
- 812.0
Population outlook (Palm Beach County) Hauer SSP2
- Today (2025)
- 1,637,487 people
- By 2030
- 1,743,255 · +6.5%
- By 2040
- 1,948,712 · +19.0%
- By 2050
- 2,132,979 · +30.3%
- By 2075
- 2,530,027 · +54.5%
- By 2100
- 2,706,979 · +65.3%
Race, ethnicity, and origin ACS 2023
- Neighborhood character
- Predominantly White (72%)
- Race & ethnicity
- White 72% Hispanic / Latino 18% Two or more races 13% Asian 3% Black 3%
- Hispanic origin (detail)
- Mexican 2% Puerto Rican 2% Cuban 1%
- Common ancestry
- Romanian 9% Scotch-Irish 8% Italian 2%
- Foreign-born
- 25% · Canada, Jamaica, South Korea
- Languages at home
- 73% English-only · Spanish 15% Other Indo-European 4% Russian/Polish/Slavic 1%
Political lean MEDSL · Palm Beach
- 2024 margin
- Toss-up / Even · D 50.0% · R 49.2%
- 2008→2024 swing
- -22.1pp toward R · 2008: 22.9pp · 2024: 0.8pp
- All cycles
- 2024: D+0.8 2020: D+12.8 2016: D+15.3 2012: D+17.0 2008: D+22.9
Not yet ingested
- Civics
- —
Market trends
- HPI YoY
- ▼ -279.89%
- Current HPI
- 271.1328
- Rent YoY
- ▲ 1.81%
- Metro
- Miami-Fort Lauderdale-Pompano Beach, FL
- State GDP YoY
- ▲ 3.28%
- F500 in state
- 36
Industry mix (Fortune 500 HQ in FL)
| Industry | F500 HQs | Revenue |
|---|---|---|
| Industrial Technology | 2 | $29B |
|
||
| Insurance | 2 | $17B |
|
||
| Retail | 1 | $60B |
|
||
| Technology Distribution | 1 | $58B |
|
||
| Homebuilding | 1 | $35B |
|
||
| Technology Manufacturing | 1 | $35B |
|
||
Price history
+73.7% since first listed5 events — show timeline
- 2026-06-03 Listing Removed — Beaches MLS
- 2026-06-03 Listed $79,900 Beaches MLS
- 2001-05-17 Sold (Public Records) $38,000 Public Records
- 1995-10-30 Sold (Public Records) $52,000 Public Records
- 1983-11-01 Sold (Public Records) $46,000 Public Records
Property tax history
+4.2%/yrLatest (2025): $323 · +7.3% YoY. Source: county tax records.
Cash-flow waterfall
monthlySold comps — $/sqft
last 12 mo · ≤1 miLoading sold comps…