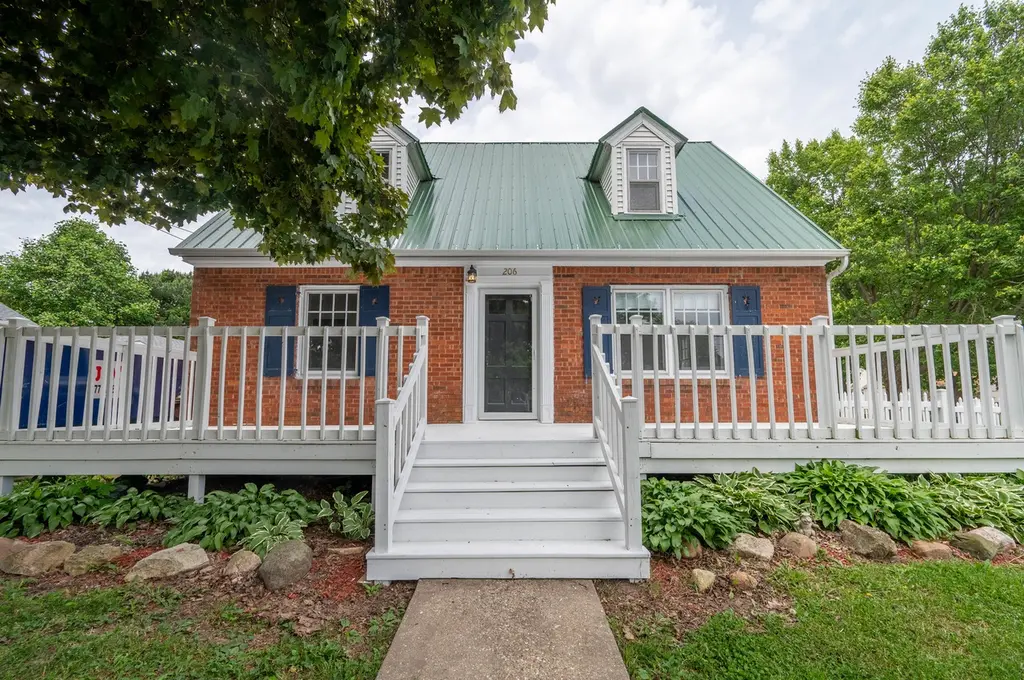
206 N Mulberry St · Mount Morris, IL
Flood risk 1/10 · Minimal
- FEMA flood zone
- X (unshaded)
- Chance of flooding over 30 yrs
- 0.0%
- Est. flood insurance / yr
- $507 – $1,088
Fire risk 1/10 · Minimal
- Est. fire insurance / yr
- $804 – $1,492
Heat risk 2/10 · Minimal
- Hot days now (above 101°F)
- 7 days/yr
- Hot days in 30 yrs
- 15 days/yr
Wind risk 2/10 · Minimal
- Chance of severe wind over 30 yrs
- —
Air-quality risk 3/10 · Minor
- Unhealthy air days now
- 2 days/yr
- Unhealthy air days in 30 yrs
- 3 days/yr
Risk factors via First Street. Map © Google.
Why this score? — see what drove the C+ grade
The composite is a weighted blend of 9 inputs, each scored 0–100. Each bar is that input's sub-score; the figure is the points it added to the 100-point composite (weight × sub-score).
- Cash flow +22.8/30.0
- ARV discount +15.0/15.0
- DSCR +7.3/10.0
- 1% rule +6.2/10.0
- Livability +3.5/5.0
- Rent growth +2.5/5.0
- Condition / age +2.5/5.0
- Schools +1.9/10.0
- Appreciation +0.0/10.0
$105,000
🖨 Deal sheet (PDF) 📄 Offer letter ✓ Due diligence
Listing remarks MLS
Adorable all day long! This charming brick ranch sits on a desirable corner lot and offers a fenced side and backyard, perfect for pets, gardening, or outdoor entertaining. A spacious deck stretching across the entire front of the home provides the ideal spot for grilling, relaxing, and enjoying the outdoors. Inside, you'll find an updated two bedroom floor plan featuring beautiful hardwood floors, a modern kitchen and bath, and an inviting open-concept layout connecting the living room and kitchen. A built in hallway cabinet adds both character and convenient storage. Completing the property is a detached one car garage and low maintenance exterior, making this move in ready home a wonderful opportunity for first time buyers, downsizers, or anyone seeking comfortable single level living.
Key facts
- Updated floor plan
- Spacious deck
- Modern kitchen
Tags
Property features AI
Finance
- Other: School bus service available; Corner lot location (corner of North Mulberry and West 1st St in Mt Morris); Lot dimensions approximately 67.4 x 75 (less than 0.25 acre)
- HOA & community: No master association fee required
Exterior
- Parking: Detached garage with concrete driveway; Garage door opener; One garage space (one total parking space)
- Utilities: Public water; Public sewer
- Home design: Detached single-family home; 1.5-story; Fee simple ownership; Built before 1978
- Construction: Metal roof; Vinyl siding and brick exterior; Concrete perimeter foundation; Approximately 91–100 years old
- Exterior features: Deck; Fenced lot; Estimated living area
Interior
- Kitchen: Range
- Bedrooms: Master bedroom on main level (9 x 13); Second bedroom on main level (11 x 9); Additional labeled bedrooms (2 other bedrooms)
- Bathrooms: One full bathroom
- Heating & cooling: Natural gas forced air heating; Central air conditioning
- Interior features: Unfinished full basement; Four total rooms
- Laundry & utility: Washer; Main-level laundry room
Neighborhood map
What this means for you Summary
Snapshot
- This is a 2-bed/1.0-bath single-family listed at $105k.
Deal economics
- At list price, monthly cash flow is $183 ($2k/yr) — positive.
- The deal already cash-flows at list — no discount required.
- Meets the 1% rule at list price ($1k rent vs $105k).
Location & tenants
- Location reads 69/100 on livability (#391 in IL) — a middle-class / working-renter tenant base. Strengths: cost of living A+, housing A+, health & safety A+; Watch: schools F, amenities F, commute F.
- Oregon CUSD 220 (town): math 20% / reading 22% proficiency, ranked #400 of 620 in IL (top 64%) — low school quality limits family demand, transient renter base, plan for 1-2y turnover.
- Market conditions: 16 active listings in the ZIP; 113 units permitted in Ogle County in 2024 (67 in 5+ unit buildings).
Forward outlook
- Local home prices are declining (-3.0%/yr); year-one equity from $726 of loan paydown is wiped out by about $3k of value loss. Plan a longer hold.
- Ogle County population projected at -24% by 2050 — secular population decline; favor cash flow + early exit over multi-decade hold.
Negotiation context
- Only 7 days on market — expect competitive offers; lowballing is unlikely to land.
- 2 sale attempts with the ask held roughly flat each time — persistent listings suggest the price (not the market) is what's stuck; bring a comps-based counter.
Risks & watch-outs
- Watch-outs: built in 1935 — expect roof / HVAC / electrical / plumbing capex.
Questions for the listing agent
- Built in 1935 — when were the roof, HVAC, electrical panel, plumbing, and water heater last replaced?
- Is there a deadline driving the sale (1031 exchange, divorce, estate, relocation)? That informs how much negotiation room exists.
- Schools are F-rated, which usually means shorter tenancies and higher turnover. Who's the typical renter profile here, and what's been the actual vacancy rate?
- What's the average days-on-market for RENTAL listings here right now (not sales)? A rising rental-DOM trend means longer vacancies and softer asking-rent achievability than the comps imply.
- What's the recent tenant-quality profile in this submarket — average credit score on applications, eviction rate, late-payment / NSF rate, and stable-employment percentage? A property-management company in the area should have these aggregated.
- How much new for-sale + rental construction is in the pipeline within 1–3 miles? Heavy new supply typically softens prices + rents 12–24 months out; constrained supply supports both.
Investment metrics
- 1% rule
- 1.12% ✓
- Cap rate
- 8.39%
- Cash-on-cash
- 7.49%
- DSCR
- 1.33
- GRM
- 7.4
CMA / ARV
- ARV (on-the-fly)
- $132,600
- Comps found
- 5
Show comp detail 5 sales within ~0.75 mi
| Address | Dist | Beds/Ba | Sqft | Sold | Price | $/sf | Match |
|---|---|---|---|---|---|---|---|
| 105 N Hannah Ave | 0.26mi | 2/1.0 | 1,016 (-0%) | 20mo | $87,500 | $86 | 71 |
| 311 W Hitt St | 0.22mi | 3/1.0 (+1) | 1,080 (+6%) | 15mo | $140,000 | $130 | 63 |
| 306 W Front St | 0.26mi | 3/1.0 (+1) | 1,104 (+8%) | 8mo | $165,500 | $150 | 63 |
| 106 N Hannah Ave | 0.29mi | 3/2.0 (+1) | 928 (-9%) | 14mo | $121,720 | $131 | 50 |
| 309 W Center St | 0.32mi | 2/2.0 | 932 (-9%) | 22mo | $115,550 | $124 | 48 |
Match score weights: distance 35% · size 25% · config 20% · recency 20%. Top-matched comps best support the ARV.
Projected returns pro-forma
-3.0% appreciation · 3.0% rent growth · sell at horizon
- IRR
- -4.8%
- Equity multiple
- 0.82×
- Total profit
- $-5,304
- Equity at exit
- $15,656
- IRR
- 4.9%
- Equity multiple
- 1.36×
- Total profit
- $10,544
- Equity at exit
- $9,078
Cash invested: $29,400 (down + closing). Projections, not guarantees.
Landlord ↔ Tenant lean methodology
- Overall (STATE)
- 43 Moderately Tenant-Leaning
- State Illinois
- 43 Moderately Tenant-Leaning · D+7
- County
- — inherits STATE
- City
- — inherits STATE
ZIP-level market 61054
- Home prices YoY
- -16.1%
- Active inventory
- 16
- Price-to-rent
- 7.4×
Monthly cashflow live
- Estimated rent
- $1,176 medium interval (Pro) →
- Mortgage (P&I)
- −$551
- Tax from tax record
- −$152 /mo · $1,820/yr
- Insurance
- −$44
- HOA
- −$0
- Vacancy / Maint / Mgmt
- −$247
- Net cashflow
- $183
Break-even live
Sensitivity live
| Price | -10% $243 | -5% $213 | +0% $183 | +5% $154 | +10% $124 |
|---|---|---|---|---|---|
| Rent | -10% $90 | -5% $137 | +0% $183 | +5% $230 | +10% $276 |
| Rate | -1.0pp $236 | -0.5pp $210 | base $183 | +0.5pp $156 | +1.0pp $128 |
UW: 25.0% down · 7.5% · 30yr · 1.5% tax · 5.0% vac · 8.0% maint · 8.0% mgmt
Financing live
Cash to close
- Down payment
- $26,250
- Closing costs
- $3,150
- Reserves months
- —
- Total cash needed
- —
Loan-product check · same deal, 3 products live
Conventional
25% down · 7.5% · 30yr
- Down + closing
- —
- Monthly P&I
- —
- Monthly cashflow
- —
- DSCR
- —
- Eligible?
- —
Personal DTI + credit; lowest rate.
DSCR
20% down · 8.5% · 30yr
- Down + closing
- —
- Monthly P&I
- —
- Monthly cashflow
- —
- DSCR
- —
- Eligible?
- —
No personal income docs; deal must DSCR.
Hard money
10% down · 12.0% · 12mo
- Down + closing
- —
- Monthly P&I
- —
- Monthly cashflow
- —
- DSCR
- —
- Eligible?
- —
Short-term bridge; refi at stabilization.
Listing history 7 events
-
2026-06-09status $105,000 Pending 7 DOM
-
2026-06-08days on market $105,000 Active 7 DOM
-
2026-06-07days on market $105,000 Active 6 DOM
-
2026-06-07days on market $105,000 Active 5 DOM
-
2026-06-04days on market $105,000 Active 2 DOM
-
2026-06-02remarks 699-char remark
-
2026-06-02$105,000 Active 1 DOM
ⓘ Source: listings_history table (triggers on properties + properties_extension) + one-shot
backfill from property_details.listing_events for pre-trigger history.
Tax reassessment forecast IL · Partial reset (capped growth)
- Current annual tax
- $1,820 · $152/mo
- Projected year-2 tax
- $2,102 · $175/mo
- Expected delta
- +$282/yr (+$23/mo · 15.5%)
ⓘ Screening estimate from a state-policy table — verify with the county assessor before closing.
Climate risk First Street
- Flood 1/10 Low FEMA zone X (unshaded) · 0% chance over 30 yrs
- Wildfire 1/10 Low
- Heat 2/10 Low 7 d/yr ≥101°F today · 15 d/yr by 30 yrs out
- Wind 2/10 Low
- Air quality 3/10 Moderate 2 unhealthy d/yr today · 3 by 30 yrs out
Nearby sold comps map
Loading sold comps map…
Walkable amenities ~0.75 mi
Loading nearby amenities…
Taxation est. · year 1
- Rental income
- $14,118
- − Mortgage interest
- −$5,882
- − Property taxes
- −$1,820
- − Insurance
- −$525
- − Repairs & maintenance
- −$1,129
- − Management
- −$1,129
- − Depreciation
- −$3,055
- Taxable income
- $578
- Est. tax owed @ 24.0%
- −$139
- After-tax cash flow
- $2,062/yr
For passive investors: Depreciation is non-cash, so a rental often shows a tax loss while cash-flowing — sheltering income. Rental losses are passive: they offset passive income freely, and up to $25,000/yr can offset ordinary (W-2) income if you actively participate and your MAGI is under $100k (phasing out to $0 by $150k); unused losses carry forward. On sale, claimed depreciation is recaptured at up to 25%, and gains may owe capital-gains tax (a 1031 exchange can defer both). Figures are a year-1 estimate at your 24.0% rate — not tax advice; consult a CPA.
Schools (NCES district)
- District
- Oregon CUSD 220
- NCES district ID
- 1730160
- Math proficiency
- 20% ▼ -9.00%
- Reading proficiency
- 22% ▼ -4.00%
- Median HH income
- $50,631
- Composite
- 18.8/100
- National rank
- #8868
- State rank
- #400 of 620 in IL
Livability — Mount Morris
- Score
- 69/100
- State rank
- #391
- US rank
- #8215
Category grades
Schools grade is shown separately in the Schools card above.
Census & demographics
- Census place
- Mount Morris, IL
- Population (ZIP)
- 3,617
Population outlook (Ogle County) Hauer SSP2
- Today (2025)
- 48,390 people
- By 2030
- 46,346 · -4.2%
- By 2040
- 41,772 · -13.7%
- By 2050
- 36,911 · -23.7%
- By 2075
- 27,130 · -43.9%
- By 2100
- 18,627 · -61.5%
Race, ethnicity, and origin ACS 2023
- Neighborhood character
- Predominantly White (93%)
- Race & ethnicity
- White 93% Two or more races 3% Hispanic / Latino 2% Black 2%
- Common ancestry
- Romanian 5% Portuguese 3% Italian 2%
- Foreign-born
- 6%
- Languages at home
- 96% English-only · Other Indo-European 3% German/W. Germanic 1%
Political lean MEDSL · Ogle
- 2024 margin
- Strong R (+29.4) · D 34.5% · R 63.9% · Other 1.6%
- 2008→2024 swing
- -21.8pp toward R · 2008: -7.6pp · 2024: -29.4pp
- All cycles
- 2024: R+29.4 2020: R+25.9 2016: R+26.6 2012: R+16.7 2008: R+7.6
Not yet ingested
- Civics
- —
Market trends
- HPI YoY
- ▼ -32.02%
- Current HPI
- 166.3688
- Rent YoY
- —
- Metro
- —
- State GDP YoY
- ▲ 1.59%
- F500 in state
- 60
Industry mix (Fortune 500 HQ in IL)
| Industry | F500 HQs | Revenue |
|---|---|---|
| Insurance | 4 | $201B |
|
||
| Consumer Goods | 4 | $87B |
|
||
| Industrial Machinery | 3 | $64B |
|
||
| Healthcare | 2 | $55B |
|
||
| Retail / Pharmacy | 1 | $148B |
|
||
| Agriculture / Food | 1 | $86B |
|
||
Price history
+0.0% since first listed2 events — show timeline
- 2026-06-01 Listed $105,000 MRED as Distributed by MLS Grid
- 2026-06-01 Listed $105,000 NWIAR
Property tax history
+3.5%/yrLatest (2024): $1,820 · +13.2% YoY. Source: county tax records.
Cash-flow waterfall
monthlySold comps — $/sqft
last 12 mo · ≤1 miLoading sold comps…