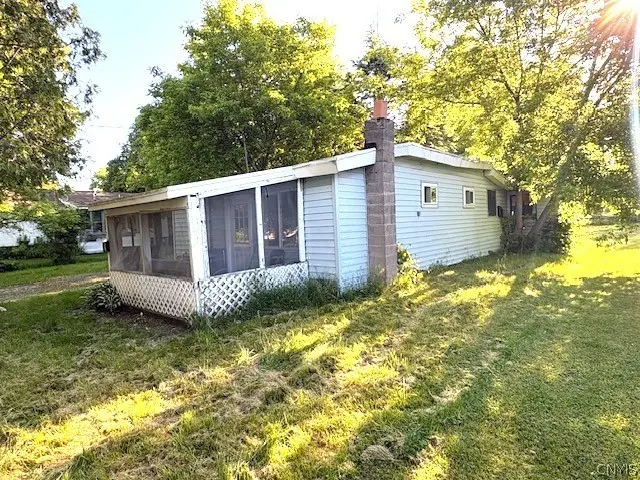
112 West Ave · Canastota, NY
Flood risk 1/10 · Minimal
- FEMA flood zone
- X
- Chance of flooding over 30 yrs
- 0.0%
- Est. flood insurance / yr
- $507 – $1,088
Fire risk 1/10 · Minimal
- Est. fire insurance / yr
- $691 – $1,283
Heat risk 3/10 · Minor
- Hot days now (above 94°F)
- 7 days/yr
- Hot days in 30 yrs
- 16 days/yr
Wind risk 1/10 · Minimal
- Chance of severe wind over 30 yrs
- —
Air-quality risk 2/10 · Minimal
- Unhealthy air days now
- 1 days/yr
- Unhealthy air days in 30 yrs
- 1 days/yr
Risk factors via First Street. Map © Google.
Why this score? — see what drove the B+ grade
The composite is a weighted blend of 9 inputs, each scored 0–100. Each bar is that input's sub-score; the figure is the points it added to the 100-point composite (weight × sub-score).
- Cash flow +30.0/30.0
- 1% rule +10.0/10.0
- DSCR +10.0/10.0
- Appreciation +10.0/10.0
- ARV discount +7.5/15.0
- Schools +3.7/10.0
- Livability +3.7/5.0
- Rent growth +2.5/5.0
- Condition / age +2.5/5.0
$79,900
🖨 Deal sheet (PDF) 📄 Offer letter ✓ Due diligence
Listing remarks MLS
Welcome to an incredible opportunity and invest today in a stick-built home (not a manufactured home)! Nestled on a great lot, this home awaits your vision and TLC. While it needs work, the payoff is immense. Imagine the possibilities in this spacious canvas, where you can craft a dream space from scratch. The immense backyard offers endless potential for outdoor living and entertaining. Don't miss out on this chance to create a perfect home in this neighborhood.
Key facts
- 0.39 acre lot
- Built 1910
- Listed 15 days
Property features AI
Exterior
- Parking: No garage
- Utilities: Electricity connected (circuit breakers); Public water connected; Sewer connected; High-speed internet available; Cable available
- Home design: Single-story existing home
- Construction: Frame construction with vinyl siding; Copper plumbing; Membrane/rubber roof; Poured foundation and slab; Built as existing (year built details: existing)
- Exterior features: Gravel driveway; Porch (screened); Private yard; Rectangular residential lot; City street frontage
Interior
- Kitchen: Electric oven; Electric range; Dishwasher; Refrigerator; Eat-in kitchen
- Bedrooms: Three bedrooms on the main level
- Flooring: Hardwood; Carpet; Vinyl; Varied flooring
- Bathrooms: One full bathroom on the main level
- Heating & cooling: Forced air heating (gas); Window cooling units; Programmable thermostat
- Interior features: Entrance foyer; Eat-in kitchen; Country kitchen; Natural woodwork; Programmable thermostat; See remarks
- Laundry & utility: Main-level laundry; Washer; Dryer; Gas water heater
Neighborhood map
What this means for you Summary
Snapshot
- This is a 3-bed/1.0-bath single-family listed at $80k.
Deal economics
- At list price, monthly cash flow is $585 ($7k/yr) — positive.
- The deal already cash-flows at list — no discount required.
- Meets the 1% rule at list price ($1k rent vs $80k).
- Recommended offer: $79k (1.5% below list) — sets the bar for market timing.
- Cap rate 15.1% vs local median 3.8% in Canastota — top-decile yield for the area; either an underpriced asset or a hidden risk that comps aren't pricing in. Stress-test before assuming the spread holds.
Location & tenants
- Location reads 73/100 on livability (#332 in NY) — a middle-class / working-renter tenant base. Strengths: housing A+, health & safety A+, cost of living A; Watch: employment D+, amenities F, commute F.
- Canastota Central School District (town): math 39% / reading 48% proficiency, ranked #473 of 590 in NY (top 80%) — families likely to look elsewhere, expect single-tenant / working-renter base with shorter leases.
- Zoned schools: South Side Elementary School (math 57% / reading 57%, grade C+, #842 of 2,108 statewide, top 43%, 180 students, 47% FRL); Roberts Street Middle School (math 26% / reading 38%, grade F, #1,646 of 2,108 statewide, top 80%, 294 students, 54% FRL); Canastota High School (math 47% / reading 57%, grade D+, #946 of 1,100 statewide, top 88%, 561 students, 42% FRL) — zoned schools at 48% FRL track the district average.
- Market conditions: 54 active listings in the ZIP; 137 units permitted in Madison County in 2024 (46 in 5+ unit buildings).
Forward outlook
- In year one you build about $9k of equity ($552 loan paydown + $8k appreciation (10.0% local appreciation)).
- Madison County population projected at -24% by 2050 — secular population decline; favor cash flow + early exit over multi-decade hold.
- At projected returns (10.0% appreciation + 3.0% rent growth), your $22k cash investment doubles in ~2 years — after that, you're playing with house money.
- By year 4, paydown + projected appreciation supports a ~$30k cash-out refi (75% LTV) — recoverable capital for the next deal without selling this one.
Negotiation context
- It's been on market 16 days — a 2% lower offer ($79k) is reasonable based on typical stale-listing flexibility.
- 2 sale attempts since 3y ago with the ask held roughly flat each time — persistent listings suggest the price (not the market) is what's stuck; bring a comps-based counter.
- Current owner paid $27k; list at $80k implies a 196% gain — meaningful room to come down on a strong offer.
Risks & watch-outs
- Watch-outs: built in 1910 — expect roof / HVAC / electrical / plumbing capex.
Questions for the listing agent
- Built in 1910 — when were the roof, HVAC, electrical panel, plumbing, and water heater last replaced?
- Is there a deadline driving the sale (1031 exchange, divorce, estate, relocation)? That informs how much negotiation room exists.
- What's the average days-on-market for RENTAL listings here right now (not sales)? A rising rental-DOM trend means longer vacancies and softer asking-rent achievability than the comps imply.
- What's the recent tenant-quality profile in this submarket — average credit score on applications, eviction rate, late-payment / NSF rate, and stable-employment percentage? A property-management company in the area should have these aggregated.
- How much new for-sale + rental construction is in the pipeline within 1–3 miles? Heavy new supply typically softens prices + rents 12–24 months out; constrained supply supports both.
Investment metrics
- 1% rule
- 1.86% ✓
- Cap rate
- 15.08%
- Cash-on-cash
- 31.40%
- DSCR
- 2.40
- GRM
- 4.5
CMA / ARV
- ARV (on-the-fly)
- $170,945
- Comps found
- 6
Show comp detail 6 sales within ~0.75 mi
| Address | Dist | Beds/Ba | Sqft | Sold | Price | $/sf | Match |
|---|---|---|---|---|---|---|---|
| 112 West Ave | 0.00mi | 3/1.0 | 955 (0%) | 23mo | $27,000 | $28 | 81 |
| 409 W Lewis St | 0.36mi | 2/1.0 (-1) | 940 (-2%) | 8mo | $129,900 | $138 | 69 |
| 105 W Park St | 0.15mi | 2/1.0 (-1) | 923 (-3%) | 20mo | $45,000 | $49 | 66 |
| 421 W Lewis St | 0.36mi | 3/1.0 | 1,024 (+7%) | 14mo | $185,400 | $181 | 59 |
| 107 S Park St | 0.21mi | 4/3.0 (+1) | 1,073 (+12%) | 2mo | $236,107 | $220 | 55 |
| 210 Wilson Ave | 0.61mi | 3/2.0 | 1,008 (+6%) | 22mo | $180,000 | $179 | 40 |
Match score weights: distance 35% · size 25% · config 20% · recency 20%. Top-matched comps best support the ARV.
Projected returns pro-forma
10.0% appreciation · 3.0% rent growth · sell at horizon
- IRR
- 48.2%
- Equity multiple
- 4.61×
- Total profit
- $80,844
- Equity at exit
- $71,980
- IRR
- 42.0%
- Equity multiple
- 10.34×
- Total profit
- $208,843
- Equity at exit
- $155,228
Cash invested: $22,372 (down + closing). Projections, not guarantees.
Landlord ↔ Tenant lean methodology
- Overall (STATE)
- 15 Strongly Tenant-Friendly
- State New York
- 15 Strongly Tenant-Friendly · D+10
- County
- — inherits STATE
- City
- — inherits STATE
ZIP-level market 13032
- Home prices YoY
- 5.7%
- Active inventory
- 54
- Price-to-rent
- 4.5×
Monthly cashflow live
- Estimated rent
- $1,487 medium interval (Pro) →
- Mortgage (P&I)
- −$419
- Tax from tax record
- −$137 /mo · $1,647/yr
- Insurance
- −$33
- HOA
- −$0
- Vacancy / Maint / Mgmt
- −$312
- Net cashflow
- $585
Break-even live
Sensitivity live
| Price | -10% $631 | -5% $608 | +0% $585 | +5% $563 | +10% $540 |
|---|---|---|---|---|---|
| Rent | -10% $468 | -5% $527 | +0% $585 | +5% $644 | +10% $703 |
| Rate | -1.0pp $626 | -0.5pp $606 | base $585 | +0.5pp $565 | +1.0pp $544 |
UW: 25.0% down · 7.5% · 30yr · 1.5% tax · 5.0% vac · 8.0% maint · 8.0% mgmt
Financing live
Cash to close
- Down payment
- $19,975
- Closing costs
- $2,397
- Reserves months
- —
- Total cash needed
- —
Loan-product check · same deal, 3 products live
Conventional
25% down · 7.5% · 30yr
- Down + closing
- —
- Monthly P&I
- —
- Monthly cashflow
- —
- DSCR
- —
- Eligible?
- —
Personal DTI + credit; lowest rate.
DSCR
20% down · 8.5% · 30yr
- Down + closing
- —
- Monthly P&I
- —
- Monthly cashflow
- —
- DSCR
- —
- Eligible?
- —
No personal income docs; deal must DSCR.
Hard money
10% down · 12.0% · 12mo
- Down + closing
- —
- Monthly P&I
- —
- Monthly cashflow
- —
- DSCR
- —
- Eligible?
- —
Short-term bridge; refi at stabilization.
Listing history 13 events
-
2026-06-21days on market $79,900 Active 16 DOM
-
2026-06-21days on market $79,900 Active 15 DOM
-
2026-06-18days on market $79,900 Active 13 DOM
-
2026-06-17days on market $79,900 Active 12 DOM
-
2026-06-16days on market $79,900 Active 11 DOM
-
2026-06-15days on market $79,900 Active 10 DOM
-
2026-06-13days on market $79,900 Active 8 DOM
-
2026-06-12days on market $79,900 Active 7 DOM
-
2026-06-09days on market $79,900 Active 4 DOM
-
2026-06-08days on market $79,900 Active 3 DOM
-
2026-06-07days on market $79,900 Active 2 DOM
-
2026-06-07remarks 389-char remark
-
2026-06-07$79,900 Active 1 DOM
ⓘ Source: listings_history table (triggers on properties + properties_extension) + one-shot
backfill from property_details.listing_events for pre-trigger history.
Tax reassessment forecast NY · Partial reset (capped growth)
- Current annual tax
- $1,647 · $137/mo
- Projected year-2 tax
- $1,647 · $137/mo
- Expected delta
- $0/yr ($0/mo · 0.0%)
ⓘ Screening estimate from a state-policy table — verify with the county assessor before closing.
Climate risk First Street
- Flood 1/10 Low FEMA zone X · 0% chance over 30 yrs
- Wildfire 1/10 Low
- Heat 3/10 Moderate 7 d/yr ≥94°F today · 16 d/yr by 30 yrs out
- Wind 1/10 Low
- Air quality 2/10 Low 1 unhealthy d/yr today · 1 by 30 yrs out
Nearby sold comps map
Loading sold comps map…
Walkable amenities ~0.75 mi
Loading nearby amenities…
Taxation est. · year 1
- Rental income
- $17,847
- − Mortgage interest
- −$4,476
- − Property taxes
- −$1,647
- − Insurance
- −$400
- − Repairs & maintenance
- −$1,428
- − Management
- −$1,428
- − Depreciation
- −$2,324
- Taxable income
- $6,145
- Est. tax owed @ 24.0%
- −$1,475
- After-tax cash flow
- $5,550/yr
For passive investors: Depreciation is non-cash, so a rental often shows a tax loss while cash-flowing — sheltering income. Rental losses are passive: they offset passive income freely, and up to $25,000/yr can offset ordinary (W-2) income if you actively participate and your MAGI is under $100k (phasing out to $0 by $150k); unused losses carry forward. On sale, claimed depreciation is recaptured at up to 25%, and gains may owe capital-gains tax (a 1031 exchange can defer both). Figures are a year-1 estimate at your 24.0% rate — not tax advice; consult a CPA.
Schools (NCES district)
- District
- Canastota Central School District
- NCES district ID
- 3606390
- Math proficiency
- 39% ▼ -6.00%
- Reading proficiency
- 48% ▲ 8.00%
- Median HH income
- $50,825
- Composite
- 37.44/100
- National rank
- #4413
- State rank
- #473 of 590 in NY
Livability — Canastota
- Score
- 73/100
- State rank
- #332
- US rank
- #5485
Category grades
Schools grade is shown separately in the Schools card above.
Census & demographics
- Census place
- Canastota, NY
- City population
- 12,964
- Population (ZIP)
- 12,964
Population outlook (Madison County) Hauer SSP2
- Today (2025)
- 69,528 people
- By 2030
- 66,599 · -4.2%
- By 2040
- 59,814 · -14.0%
- By 2050
- 52,842 · -24.0%
- By 2075
- 39,167 · -43.7%
- By 2100
- 28,442 · -59.1%
Race, ethnicity, and origin ACS 2023
- Neighborhood character
- Predominantly White (89%)
- Race & ethnicity
- White 89% Two or more races 8% Hispanic / Latino 2% Black 2%
- Common ancestry
- Romanian 5% Iranian 5% Lithuanian 4%
- Foreign-born
- 2% · Canada
- Languages at home
- 95% English-only · Russian/Polish/Slavic 2% French/Haitian/Cajun 1% Spanish 1%
Political lean MEDSL · Madison
- 2024 margin
- R (+13.1) · D 43.5% · R 56.5%
- 2008→2024 swing
- -13.9pp toward R · 2008: 0.9pp · 2024: -13.1pp
- All cycles
- 2024: R+13.1 2020: R+10.6 2016: R+15.9 2012: D+0.3 2008: D+0.9
Not yet ingested
- Civics
- —
Market trends
- HPI YoY
- ▲ 13.44%
- Current HPI
- 251.5471
- Rent YoY
- —
- Metro
- —
- State GDP YoY
- ▲ 2.60%
- F500 in state
- 92
Industry mix (Fortune 500 HQ in NY)
| Industry | F500 HQs | Revenue |
|---|---|---|
| Financial Services | 10 | $950B |
|
||
| Consumer Goods | 9 | $162B |
|
||
| Insurance | 4 | $225B |
|
||
| Telecommunications | 2 | $144B |
|
||
| Pharmaceuticals | 2 | $112B |
|
||
| Media / Entertainment | 2 | $69B |
|
||
Price history
+10.2% since first listed12 events — show timeline
- 2026-06-05 Listed $79,900 CNYIS
- 2024-07-22 Sold (MLS) $27,000 CNYIS
- 2024-07-19 Sold (Public Records) $54,000 Public Records
- 2024-01-01 Pending — CNYIS
- 2023-12-31 Price Changed $32,500 CNYIS
- 2023-12-24 Price Changed $37,500 CNYIS
- 2023-12-17 Price Changed $42,500 CNYIS
- 2023-12-11 Price Changed $47,500 CNYIS
- 2023-11-10 Price Changed $57,500 CNYIS
- 2023-10-30 Price Changed $62,499 CNYIS
- 2023-10-27 Price Changed $62,500 CNYIS
- 2023-10-25 Listed $72,500 CNYIS
Property tax history
+1.6%/yrLatest (2025): $1,647 · +1.6% YoY. Source: county tax records.
Cash-flow waterfall
monthlySold comps — $/sqft
last 12 mo · ≤1 miLoading sold comps…