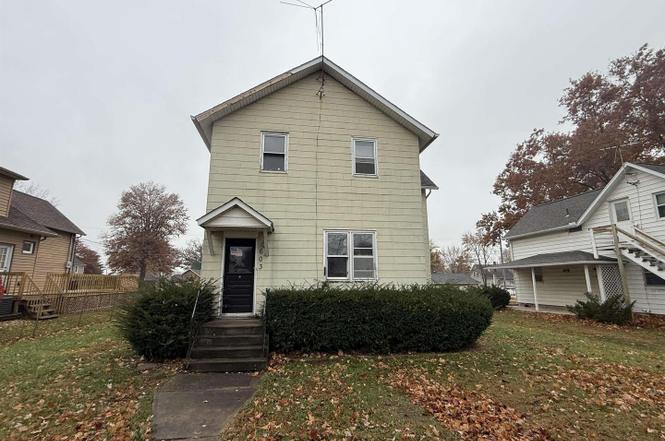
603 7th St · Durant, IA
Flood risk 1/10 · Minimal
- FEMA flood zone
- X (unshaded)
- Chance of flooding over 30 yrs
- 0.0%
- Est. flood insurance / yr
- $473 – $860
Fire risk 4/10 · Minor
- Est. fire insurance / yr
- $902 – $1,676
Heat risk 3/10 · Minor
- Hot days now (above 103°F)
- 7 days/yr
- Hot days in 30 yrs
- 16 days/yr
Wind risk 2/10 · Minimal
- Chance of severe wind over 30 yrs
- —
Air-quality risk 2/10 · Minimal
- Unhealthy air days now
- 2 days/yr
- Unhealthy air days in 30 yrs
- 2 days/yr
Risk factors via First Street. Map © Google.
Why this score? — see what drove the B+ grade
The composite is a weighted blend of 9 inputs, each scored 0–100. Each bar is that input's sub-score; the figure is the points it added to the 100-point composite (weight × sub-score).
- Cash flow +30.0/30.0
- 1% rule +10.0/10.0
- DSCR +10.0/10.0
- ARV discount +7.5/15.0
- Appreciation +5.9/10.0
- Schools +5.9/10.0
- Livability +4.1/5.0
- Rent growth +2.5/5.0
- Condition / age +2.5/5.0
$70,000
🖨 Deal sheet (PDF) 📄 Offer letter ✓ Due diligence
Listing remarks
Great opportunity for a winter project! This 2-bedroom, 1.5-bath home offers plenty of square footage, an attached garage, and solid bones ready for renovation. Home is sold AS-IS and does need TLC-perfect for investors, flippers, or anyone looking to make it their own.
Key facts
- 9,600 sq ft lot
- Garage
- Built 1915
Neighborhood map
What this means for you Summary
Snapshot
- This is a 3-bed/1.5-bath single-family listed at $70k.
Deal economics
- At list price, monthly cash flow is $408 ($5k/yr) — positive.
- The deal already cash-flows at list — no discount required.
- Meets the 1% rule at list price ($1k rent vs $70k).
Location & tenants
- Location reads 82/100 on livability (#44 in IA, #1,124 nationally) — a professional / high-income tenant draw. Strengths: crime A+, cost of living A+, housing A+; Watch: amenities F, commute F.
- Durant Community School District (rural): math 66% / reading 70% proficiency, ranked #156 of 289 in IA (top 54%) — acceptable for families but not a draw, mixed tenant base, ~2y average lease.
- Zoned schools: Durant Elementary School (math 72% / reading 77%, grade A, #131 of 616 statewide, top 27%, 343 students, 29% FRL); Durant Junior/Senior High School (math 63% / reading 67%, grade B, #208 of 336 statewide, top 62%, 340 students, 32% FRL).
- Market conditions: 14 active listings in the ZIP; 89 units permitted in Cedar County in 2024 (40 in 5+ unit buildings).
Forward outlook
- In year one you build about $2k of equity ($484 loan paydown + $1k appreciation (1.8% local appreciation)).
- Cedar County population projected to shrink 9% by 2050 — rents likely to lag national; underwrite the cash flow, not the appreciation.
- At projected returns (1.8% appreciation + 3.0% rent growth), your $20k cash investment doubles in ~3 years — after that, you're playing with house money.
Negotiation context
- Only 0 days on market — expect competitive offers; lowballing is unlikely to land.
- 2 sale attempts with the ask held roughly flat each time — persistent listings suggest the price (not the market) is what's stuck; bring a comps-based counter.
- Current owner paid $50k; 40% above their basis — modest negotiation headroom, anchor on the comps not their cost.
Risks & watch-outs
- Watch-outs: property tax is 3.3% of price; built in 1915 — expect roof / HVAC / electrical / plumbing capex.
Questions for the listing agent
- Built in 1915 — when were the roof, HVAC, electrical panel, plumbing, and water heater last replaced?
- Property tax is high relative to price — has the assessment been appealed recently, and will the sale trigger a re-assessment?
- Is there a deadline driving the sale (1031 exchange, divorce, estate, relocation)? That informs how much negotiation room exists.
- Schools are A-rated — typically a magnet for longer-tenancy family renters. What's the average tenant stay here, and is there a school-zone premium baked into asking?
- What's the average days-on-market for RENTAL listings here right now (not sales)? A rising rental-DOM trend means longer vacancies and softer asking-rent achievability than the comps imply.
- What's the recent tenant-quality profile in this submarket — average credit score on applications, eviction rate, late-payment / NSF rate, and stable-employment percentage? A property-management company in the area should have these aggregated.
- How much new for-sale + rental construction is in the pipeline within 1–3 miles? Heavy new supply typically softens prices + rents 12–24 months out; constrained supply supports both.
Investment metrics
- 1% rule
- 1.81% ✓
- Cap rate
- 13.29%
- Cash-on-cash
- 24.98%
- DSCR
- 2.11
- GRM
- 4.6
CMA / ARV
- ARV (on-the-fly)
- $249,600
- Comps found
- 4
Show comp detail 4 sales within ~0.75 mi
| Address | Dist | Beds/Ba | Sqft | Sold | Price | $/sf | Match |
|---|---|---|---|---|---|---|---|
| 603 7th St | 0.00mi | 2/1.5 (-1) | 1,920 (0%) | 4mo | $50,000 | $26 | 91 |
| 707 9th Ave | 0.25mi | 4/2.0 (+1) | 1,796 (-6%) | 4mo | $233,000 | $130 | 68 |
| 607 9th Ave | 0.23mi | 4/2.0 (+1) | 1,680 (-12%) | 3mo | $258,000 | $154 | 59 |
| 1002 14th Ave | 0.57mi | 4/2.0 (+1) | 2,006 (+4%) | 20mo | $250,000 | $125 | 42 |
Match score weights: distance 35% · size 25% · config 20% · recency 20%. Top-matched comps best support the ARV.
Projected returns pro-forma
1.79% appreciation · 3.0% rent growth · sell at horizon
- IRR
- 28.8%
- Equity multiple
- 2.54×
- Total profit
- $30,141
- Equity at exit
- $26,830
- IRR
- 30.6%
- Equity multiple
- 4.91×
- Total profit
- $76,714
- Equity at exit
- $38,045
Cash invested: $19,600 (down + closing). Projections, not guarantees.
Landlord ↔ Tenant lean methodology
- Overall (STATE)
- 83 Strongly Landlord-Friendly
- State Iowa
- 83 Strongly Landlord-Friendly · R+6
- County
- — inherits STATE
- City
- — inherits STATE
ZIP-level market 52747
- Home prices YoY
- 0.9%
- Active inventory
- 14
- Price-to-rent
- 4.6×
Monthly cashflow live
- Estimated rent
- $1,265 medium interval (Pro) →
- Mortgage (P&I)
- −$367
- Tax from tax record
- −$195 /mo · $2,342/yr
- Insurance
- −$29
- HOA
- −$0
- Vacancy / Maint / Mgmt
- −$266
- Net cashflow
- $408
Break-even live
Sensitivity live
| Price | -10% $448 | -5% $428 | +0% $408 | +5% $388 | +10% $368 |
|---|---|---|---|---|---|
| Rent | -10% $308 | -5% $358 | +0% $408 | +5% $458 | +10% $508 |
| Rate | -1.0pp $443 | -0.5pp $426 | base $408 | +0.5pp $390 | +1.0pp $371 |
UW: 25.0% down · 7.5% · 30yr · 1.5% tax · 5.0% vac · 8.0% maint · 8.0% mgmt
Financing live
Cash to close
- Down payment
- $17,500
- Closing costs
- $2,100
- Reserves months
- —
- Total cash needed
- —
Loan-product check · same deal, 3 products live
Conventional
25% down · 7.5% · 30yr
- Down + closing
- —
- Monthly P&I
- —
- Monthly cashflow
- —
- DSCR
- —
- Eligible?
- —
Personal DTI + credit; lowest rate.
DSCR
20% down · 8.5% · 30yr
- Down + closing
- —
- Monthly P&I
- —
- Monthly cashflow
- —
- DSCR
- —
- Eligible?
- —
No personal income docs; deal must DSCR.
Hard money
10% down · 12.0% · 12mo
- Down + closing
- —
- Monthly P&I
- —
- Monthly cashflow
- —
- DSCR
- —
- Eligible?
- —
Short-term bridge; refi at stabilization.
Listing history 15 events
-
2026-05-24status Pending
-
2026-05-24status Pending
-
2026-05-22status Pending
-
2026-02-17soldstatus $50,000
-
2026-02-13soldstatus $50,000 Closed
-
2026-02-13soldstatus $50,000 Closed
-
2026-02-13soldstatus $50,000 Closed
-
2026-02-13soldstatus $50,000 Closed
-
2026-01-08status Pending
-
2026-01-05historical
-
2025-11-25status Pending
-
2025-11-25historical
-
2025-11-25historical
-
2025-11-20$70,000
-
2025-11-20Active
ⓘ Source: listings_history table (triggers on properties + properties_extension) + one-shot
backfill from property_details.listing_events for pre-trigger history.
Tax reassessment forecast IA · Partial reset (capped growth)
- Current annual tax
- $2,342 · $195/mo
- Projected year-2 tax
- $2,342 · $195/mo
- Expected delta
- $0/yr ($0/mo · 0.0%)
ⓘ Screening estimate from a state-policy table — verify with the county assessor before closing.
Climate risk First Street
- Flood 1/10 Low FEMA zone X (unshaded) · 0% chance over 30 yrs
- Wildfire 4/10 Moderate
- Heat 3/10 Moderate 7 d/yr ≥103°F today · 16 d/yr by 30 yrs out
- Wind 2/10 Low
- Air quality 2/10 Low 2 unhealthy d/yr today · 2 by 30 yrs out
Nearby sold comps map
Loading sold comps map…
Walkable amenities ~0.75 mi
Loading nearby amenities…
Taxation est. · year 1
- Rental income
- $15,182
- − Mortgage interest
- −$3,921
- − Property taxes
- −$2,342
- − Insurance
- −$350
- − Repairs & maintenance
- −$1,215
- − Management
- −$1,215
- − Depreciation
- −$2,036
- Taxable income
- $4,103
- Est. tax owed @ 24.0%
- −$985
- After-tax cash flow
- $3,912/yr
For passive investors: Depreciation is non-cash, so a rental often shows a tax loss while cash-flowing — sheltering income. Rental losses are passive: they offset passive income freely, and up to $25,000/yr can offset ordinary (W-2) income if you actively participate and your MAGI is under $100k (phasing out to $0 by $150k); unused losses carry forward. On sale, claimed depreciation is recaptured at up to 25%, and gains may owe capital-gains tax (a 1031 exchange can defer both). Figures are a year-1 estimate at your 24.0% rate — not tax advice; consult a CPA.
Schools (NCES district)
- District
- Durant Community School District
- NCES district ID
- 1909600
- Math proficiency
- 66% ▲ 5.00%
- Reading proficiency
- 70% ▲ 6.00%
- Median HH income
- $58,687
- Composite
- 58.53/100
- National rank
- #993
- State rank
- #156 of 289 in IA
Livability — Durant
- Score
- 82/100
- State rank
- #44
- US rank
- #1124
Category grades
Schools grade is shown separately in the Schools card above.
Census & demographics
- Census place
- Durant, IA
- City population
- 2,098
- Population (ZIP)
- 2,098
Population outlook (Cedar County) Hauer SSP2
- Today (2025)
- 18,416 people
- By 2030
- 18,294 · -0.7%
- By 2040
- 17,771 · -3.5%
- By 2050
- 16,841 · -8.6%
- By 2075
- 14,503 · -21.2%
- By 2100
- 11,301 · -38.6%
Race, ethnicity, and origin ACS 2023
- Neighborhood character
- Predominantly White (93%)
- Race & ethnicity
- White 93% Hispanic / Latino 4% Two or more races 4%
- Common ancestry
- Romanian 3% Slovak 2% Iranian 1%
- Foreign-born
- 1% · South Korea
Political lean MEDSL · Cedar
- 2024 margin
- Strong R (+21.8) · D 38.4% · R 60.1% · Other 1.5%
- 2008→2024 swing
- -31.4pp toward R · 2008: 9.6pp · 2024: -21.8pp
- All cycles
- 2024: R+21.8 2020: R+17.0 2016: R+18.1 2012: D+4.4 2008: D+9.6
Not yet ingested
- Civics
- —
Market trends
- HPI YoY
- ▲ 1.79%
- Current HPI
- 193.0905
- Rent YoY
- —
- Metro
- —
- State GDP YoY
- ▲ 2.48%
- F500 in state
- 4
Industry mix (Fortune 500 HQ in IA)
| Industry | F500 HQs | Revenue |
|---|---|---|
| Financial Services | 1 | $16B |
|
||
| Retail / Convenience | 1 | $15B |
|
||
Price history
-28.6% since first listed15 events — show timeline
- 2026-05-24 Pending — MRED as Distributed by MLS Grid
- 2026-05-24 Pending — MRED as Distributed by MLS Grid
- 2026-05-22 Pending — MRED as Distributed by MLS Grid
- 2026-02-17 Sold (Public Records) $50,000 Public Records
- 2026-02-13 Sold (MLS) $50,000 MRED as Distributed by MLS Grid
- 2026-02-13 Sold (MLS) $50,000 MRED as Distributed by MLS Grid
- 2026-02-13 Sold (MLS) $50,000 MRED as Distributed by MLS Grid
- 2026-02-13 Sold (MLS) $50,000 MRED as Distributed by MLS Grid
- 2026-01-08 Pending — MRED as Distributed by MLS Grid
- 2026-01-05 Listing Removed — MRED as Distributed by MLS Grid
- 2025-11-25 Pending — RMLSA as Distributed by MLS Grid
- 2025-11-25 Listing Removed — RMLSA as Distributed by MLS Grid
- 2025-11-25 Listing Removed — MRED as Distributed by MLS Grid
- 2025-11-20 Listed — RMLSA as Distributed by MLS Grid
- 2025-11-20 Listed $70,000 MRED as Distributed by MLS Grid
Property tax history
+4.6%/yrLatest (2025): $2,342 · +7.3% YoY. Source: county tax records.
Cash-flow waterfall
monthlySold comps — $/sqft
last 12 mo · ≤1 miLoading sold comps…