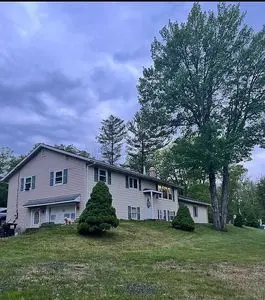
9 Crest Dr · Averill Park, NY
Flood risk 1/10 · Minimal
- FEMA flood zone
- —
- Chance of flooding over 30 yrs
- 0.0%
- Est. flood insurance / yr
- —
Fire risk 3/10 · Minor
- Est. fire insurance / yr
- $691 – $1,283
Heat risk 2/10 · Minimal
- Hot days now (above 92°F)
- 7 days/yr
- Hot days in 30 yrs
- 16 days/yr
Wind risk 3/10 · Minor
- Chance of severe wind over 30 yrs
- 6.0%
Air-quality risk 2/10 · Minimal
- Unhealthy air days now
- 1 days/yr
- Unhealthy air days in 30 yrs
- 1 days/yr
Risk factors via First Street. Map © Google.
Why this score? — see what drove the D grade
The composite is a weighted blend of 9 inputs, each scored 0–100. Each bar is that input's sub-score; the figure is the points it added to the 100-point composite (weight × sub-score).
- Appreciation +10.0/10.0
- ARV discount +7.5/15.0
- Cash flow +6.1/30.0
- Schools +5.7/10.0
- Livability +4.0/5.0
- Rent growth +2.5/5.0
- Condition / age +2.5/5.0
- 1% rule +1.8/10.0
- DSCR +0.4/10.0
$399,000
🖨 Deal sheet (PDF) 📄 Offer letter ✓ Due diligence
Listing remarks MLS
Bring your tools and start building sweat equity today. Sold "as is" this home offers a great location and Averill Park schools. Will require some rehab but should be worth the effort. Great investment for the investor or homeowner with the right skill set. Will not meet FHA guidelines, cash purchase or rehab loans only! Buyer agents to submit offers directly to seller at www.propoffers.com Buyer agent to pay $150.00 offer management fee at closing of any accepted offer. Agents should verify all taxes. Good Condition, Fair Condition
Key facts
- Built 1975
Neighborhood map
What this means for you Summary
Snapshot
- This is a 4-bed/1.5-bath single-family listed at $399k.
Deal economics
- At list price, monthly cash flow is $-751 ($-9k/yr) — negative.
- To cash-flow at today's rent, offer at most $266k (33.2% below list).
- To meet the 1% rule (rent ≥ 1% of price), the offer needs to be $271k (32.2% below list).
- Recommended offer: $266k (33.2% below list) — sets the bar for cash-flow.
Location & tenants
- Location reads 80/100 on livability (#101 in NY, #1,641 nationally) — a professional / high-income tenant draw. Strengths: crime A+, employment A+, housing A+; Watch: amenities F, commute F.
- Averill Park Central School District (rural): math 58% / reading 69% proficiency, ranked #169 of 590 in NY (top 29%) — acceptable for families but not a draw, mixed tenant base, ~2y average lease; only 14% free/reduced lunch — higher-income household profile.
- Zoned schools: Algonquin Middle School (math 32% / reading 60%, grade D+, #334 of 729 statewide, top 46%, 585 students, 26% FRL); Averill Park High School (math 97% / reading 98%, grade A+, #49 of 1,100 statewide, top 5%, 897 students, 25% FRL).
- Market conditions: 55 active listings in the ZIP; 405 units permitted in Rensselaer County in 2024 (224 in 5+ unit buildings).
Forward outlook
- In year one you build about $43k of equity ($3k loan paydown + $40k appreciation (10.0% local appreciation)).
- Rensselaer County population projected to shrink 6% by 2050 — rents likely to lag national; underwrite the cash flow, not the appreciation.
- By year 2, paydown + projected appreciation supports a ~$69k cash-out refi (75% LTV) — recoverable capital for the next deal without selling this one.
Negotiation context
- Only 0 days on market — expect competitive offers; lowballing is unlikely to land.
- 6 sale attempts since 20y ago with the ask held roughly flat each time — persistent listings suggest the price (not the market) is what's stuck; bring a comps-based counter.
- Current owner paid $180k; list at $399k implies a 122% gain — meaningful room to come down on a strong offer.
Questions for the listing agent
- What do current leases actually rent for vs. the listed asking? Can we see a recent rent roll and the last 12 months of T-12 income?
- Built in 1975 — when were the roof, HVAC, electrical panel, plumbing, and water heater last replaced?
- Is there a deadline driving the sale (1031 exchange, divorce, estate, relocation)? That informs how much negotiation room exists.
- Schools are B-rated — typically a magnet for longer-tenancy family renters. What's the average tenant stay here, and is there a school-zone premium baked into asking?
- The area grade is low — what's the realistic commute time and amenity access for the typical tenant pool here? Any planned neighborhood developments (good or bad) we should know about?
- What's the average days-on-market for RENTAL listings here right now (not sales)? A rising rental-DOM trend means longer vacancies and softer asking-rent achievability than the comps imply.
- What's the recent tenant-quality profile in this submarket — average credit score on applications, eviction rate, late-payment / NSF rate, and stable-employment percentage? A property-management company in the area should have these aggregated.
- How much new for-sale + rental construction is in the pipeline within 1–3 miles? Heavy new supply typically softens prices + rents 12–24 months out; constrained supply supports both.
Investment metrics
- 1% rule
- 0.68% ✗
- Cap rate
- 4.03%
- Cash-on-cash
- -8.06%
- DSCR
- 0.64
- GRM
- 12.3
CMA / ARV
No comps found within radius.
Projected returns pro-forma
10.0% appreciation · 3.0% rent growth · sell at horizon
- IRR
- 18.6%
- Equity multiple
- 2.52×
- Total profit
- $169,608
- Equity at exit
- $359,451
- IRR
- 17.3%
- Equity multiple
- 5.81×
- Total profit
- $537,314
- Equity at exit
- $775,169
Cash invested: $111,720 (down + closing). Projections, not guarantees.
Landlord ↔ Tenant lean methodology
- Overall (STATE)
- 15 Strongly Tenant-Friendly
- State New York
- 15 Strongly Tenant-Friendly · D+10
- County
- — inherits STATE
- City
- — inherits STATE
ZIP-level market 12018
- Home prices YoY
- 4.5%
- Active inventory
- 55
- Price-to-rent
- 12.3×
Monthly cashflow live
- Estimated rent
- $2,706 medium interval (Pro) →
- Mortgage (P&I)
- −$2,092
- Tax from tax record
- −$630 /mo · $7,555/yr
- Insurance
- −$166
- HOA
- −$0
- Vacancy / Maint / Mgmt
- −$568
- Net cashflow
- $-751
Break-even live
Sensitivity live
| Price | -10% $-525 | -5% $-638 | +0% $-751 | +5% $-864 | +10% $-977 |
|---|---|---|---|---|---|
| Rent | -10% $-965 | -5% $-858 | +0% $-751 | +5% $-644 | +10% $-537 |
| Rate | -1.0pp $-550 | -0.5pp $-649 | base $-751 | +0.5pp $-854 | +1.0pp $-959 |
UW: 25.0% down · 7.5% · 30yr · 1.5% tax · 5.0% vac · 8.0% maint · 8.0% mgmt
Financing live
Cash to close
- Down payment
- $99,750
- Closing costs
- $11,970
- Reserves months
- —
- Total cash needed
- —
Loan-product check · same deal, 3 products live
Conventional
25% down · 7.5% · 30yr
- Down + closing
- —
- Monthly P&I
- —
- Monthly cashflow
- —
- DSCR
- —
- Eligible?
- —
Personal DTI + credit; lowest rate.
DSCR
20% down · 8.5% · 30yr
- Down + closing
- —
- Monthly P&I
- —
- Monthly cashflow
- —
- DSCR
- —
- Eligible?
- —
No personal income docs; deal must DSCR.
Hard money
10% down · 12.0% · 12mo
- Down + closing
- —
- Monthly P&I
- —
- Monthly cashflow
- —
- DSCR
- —
- Eligible?
- —
Short-term bridge; refi at stabilization.
Listing history 18 events
-
2026-05-26$399,000
-
2021-10-21soldstatus $180,000
-
2018-03-08soldstatus $180,000 Closed (Final Sale) 548-char remark
Show marketing remark (548 chars)
Bring your tools and start building sweat equity today. Sold "as is" this home offers a great location and Averill Park schools. Will require some rehab but should be worth the effort. Great investment for the investor or homeowner with the right skill set. Will not meet FHA guidelines, cash purchase or rehab loans only! Buyer agents to submit offers directly to seller at www.propoffers.com Buyer agent to pay $150.00 offer management fee at closing of any accepted offer. Agents should verify all taxes. Good Condition, Fair Condition
-
2018-01-29status Pend (Under Cntr) 548-char remark
Show marketing remark (548 chars)
Bring your tools and start building sweat equity today. Sold "as is" this home offers a great location and Averill Park schools. Will require some rehab but should be worth the effort. Great investment for the investor or homeowner with the right skill set. Will not meet FHA guidelines, cash purchase or rehab loans only! Buyer agents to submit offers directly to seller at www.propoffers.com Buyer agent to pay $150.00 offer management fee at closing of any accepted offer. Agents should verify all taxes. Good Condition, Fair Condition
-
2018-01-17$177,500 New 548-char remark
Show marketing remark (548 chars)
Bring your tools and start building sweat equity today. Sold "as is" this home offers a great location and Averill Park schools. Will require some rehab but should be worth the effort. Great investment for the investor or homeowner with the right skill set. Will not meet FHA guidelines, cash purchase or rehab loans only! Buyer agents to submit offers directly to seller at www.propoffers.com Buyer agent to pay $150.00 offer management fee at closing of any accepted offer. Agents should verify all taxes. Good Condition, Fair Condition
-
2016-10-21historical
-
2016-06-24status Back On Market
-
2016-06-23status Pend (Under Cntr)
-
2016-05-05price $189,900
-
2016-03-15price $199,900
-
2016-02-04price $210,000
-
2015-11-07status Active
-
2015-11-07historical
-
2015-09-09$229,000 Active
-
2007-01-23soldstatus $233,200
-
2006-12-05soldstatus $220,000
-
2006-11-19historical
-
2006-09-26$229,500
ⓘ Source: listings_history table (triggers on properties + properties_extension) + one-shot
backfill from property_details.listing_events for pre-trigger history.
Tax reassessment forecast NY · Partial reset (capped growth)
- Current annual tax
- $7,555 · $630/mo
- Projected year-2 tax
- $7,555 · $630/mo
- Expected delta
- $0/yr ($0/mo · 0.0%)
ⓘ Screening estimate from a state-policy table — verify with the county assessor before closing.
Climate risk First Street
- Flood 1/10 Low 0% chance over 30 yrs
- Wildfire 3/10 Moderate
- Heat 2/10 Low 7 d/yr ≥92°F today · 16 d/yr by 30 yrs out
- Wind 3/10 Moderate 6% chance of damaging wind over 30 yrs
- Air quality 2/10 Low 1 unhealthy d/yr today · 1 by 30 yrs out
Nearby sold comps map
Loading sold comps map…
Walkable amenities ~0.75 mi
Loading nearby amenities…
Taxation est. · year 1
- Rental income
- $32,467
- − Mortgage interest
- −$22,350
- − Property taxes
- −$7,555
- − Insurance
- −$1,995
- − Repairs & maintenance
- −$2,597
- − Management
- −$2,597
- − Depreciation
- −$11,607
- Taxable loss
- −$16,235
- Est. tax savings @ 24.0%
- +$3,896
- After-tax cash flow
- $-5,113/yr
For passive investors: Depreciation is non-cash, so a rental often shows a tax loss while cash-flowing — sheltering income. Rental losses are passive: they offset passive income freely, and up to $25,000/yr can offset ordinary (W-2) income if you actively participate and your MAGI is under $100k (phasing out to $0 by $150k); unused losses carry forward. On sale, claimed depreciation is recaptured at up to 25%, and gains may owe capital-gains tax (a 1031 exchange can defer both). Figures are a year-1 estimate at your 24.0% rate — not tax advice; consult a CPA.
Schools (NCES district)
- District
- Averill Park Central School District
- NCES district ID
- 3600016
- Math proficiency
- 58% ▼ -15.00%
- Reading proficiency
- 69% ▲ 2.00%
- Median HH income
- $81,340
- Composite
- 56.94/100
- National rank
- #1113
- State rank
- #169 of 590 in NY
Livability — Averill Park
- Score
- 80/100
- State rank
- #101
- US rank
- #1641
Category grades
Schools grade is shown separately in the Schools card above.
Census & demographics
- Census place
- Averill Park, NY
- Population (ZIP)
- 7,069
Population outlook (Rensselaer County) Hauer SSP2
- Today (2025)
- 162,400 people
- By 2030
- 161,746 · -0.4%
- By 2040
- 158,095 · -2.7%
- By 2050
- 152,966 · -5.8%
- By 2075
- 140,767 · -13.3%
- By 2100
- 124,727 · -23.2%
Race, ethnicity, and origin ACS 2023
- Neighborhood character
- Predominantly White (95%)
- Race & ethnicity
- White 95% Two or more races 4% Hispanic / Latino 3%
- Common ancestry
- Romanian 5% Lithuanian 4% Italian 4%
- Foreign-born
- 5% · Canada
- Languages at home
- 93% English-only · Other Indo-European 4% French/Haitian/Cajun 1% Russian/Polish/Slavic 1%
Political lean MEDSL · Rensselaer
- 2024 margin
- Toss-up / Even · D 50.7% · R 49.3%
- 2008→2024 swing
- -8.0pp toward R · 2008: 9.3pp · 2024: 1.4pp
- All cycles
- 2024: D+1.4 2020: D+5.6 2016: R+2.9 2012: D+11.8 2008: D+9.3
Not yet ingested
- Civics
- —
Market trends
- HPI YoY
- ▲ 11.43%
- Current HPI
- 263.2196
- Rent YoY
- —
- Metro
- —
- State GDP YoY
- ▲ 2.60%
- F500 in state
- 92
Industry mix (Fortune 500 HQ in NY)
| Industry | F500 HQs | Revenue |
|---|---|---|
| Financial Services | 10 | $950B |
|
||
| Consumer Goods | 9 | $162B |
|
||
| Insurance | 4 | $225B |
|
||
| Telecommunications | 2 | $144B |
|
||
| Pharmaceuticals | 2 | $112B |
|
||
| Media / Entertainment | 2 | $69B |
|
||
Price history
+73.9% since first listed18 events — show timeline
- 2026-05-26 Listed $399,000 FSBO.com
- 2021-10-21 Sold (Public Records) $180,000 Public Records
- 2018-03-08 Sold (MLS) $180,000 Global MLS
- 2018-01-29 Pending — Global MLS
- 2018-01-17 Listed $177,500 Global MLS
- 2016-10-21 Listing Removed — Global MLS
- 2016-06-24 Relisted — Global MLS
- 2016-06-23 Pending — Global MLS
- 2016-05-05 Price Changed $189,900 Global MLS
- 2016-03-15 Price Changed $199,900 Global MLS
- 2016-02-04 Price Changed $210,000 Global MLS
- 2015-11-07 Relisted — Global MLS
- 2015-11-07 Listing Removed — Global MLS
- 2015-09-09 Listed $229,000 Global MLS
- 2007-01-23 Sold (Public Records) $233,200 Public Records
- 2006-12-05 Sold (MLS) $220,000 Global MLS
- 2006-11-19 Listing Removed — Global MLS
- 2006-09-26 Listed $229,500 Global MLS
Property tax history
+2.9%/yrLatest (2025): $7,555 · +11.2% YoY. Source: county tax records.
Cash-flow waterfall
monthlySold comps — $/sqft
last 12 mo · ≤1 miLoading sold comps…