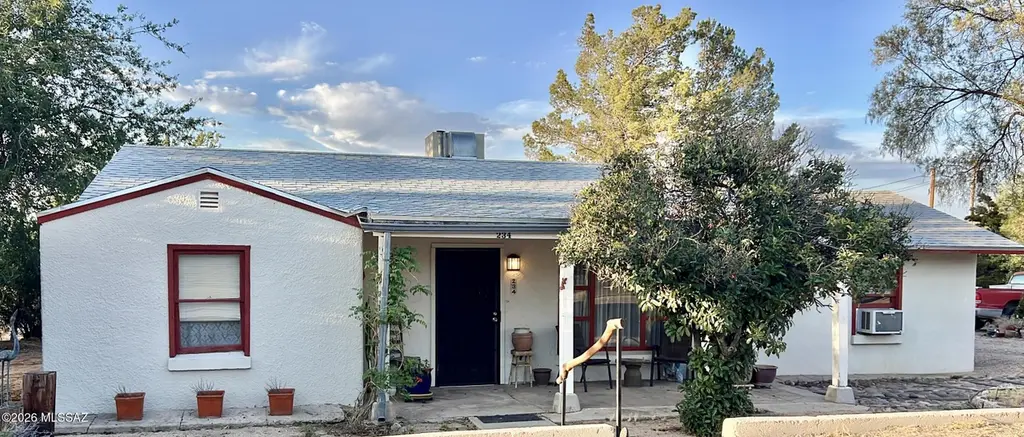
234 W Bonita St · Benson, AZ
Flood risk 1/10 · Minimal
- FEMA flood zone
- X (unshaded)
- Chance of flooding over 30 yrs
- 0.0%
- Est. flood insurance / yr
- $507 – $1,088
Fire risk 7/10 · Major
- Est. fire insurance / yr
- $610 – $1,132
Heat risk 6/10 · Moderate
- Hot days now (above 101°F)
- 8 days/yr
- Hot days in 30 yrs
- 21 days/yr
Wind risk 1/10 · Minimal
- Chance of severe wind over 30 yrs
- —
Air-quality risk 1/10 · Minimal
- Unhealthy air days now
- 0 days/yr
- Unhealthy air days in 30 yrs
- 0 days/yr
Risk factors via First Street. Map © Google.
Why this score? — see what drove the D+ grade
The composite is a weighted blend of 9 inputs, each scored 0–100. Each bar is that input's sub-score; the figure is the points it added to the 100-point composite (weight × sub-score).
- ARV discount +15.0/15.0
- Cash flow +14.9/30.0
- DSCR +4.6/10.0
- Livability +3.6/5.0
- 1% rule +3.4/10.0
- Schools +2.8/10.0
- Rent growth +2.5/5.0
- Condition / age +2.5/5.0
- Appreciation +0.0/10.0
$150,000
🖨 Deal sheet 📄 Offer letter ✓ Due diligence
Listing remarks
Bring your vision to this charming 1948 home in the heart of Benson. Situated on a large lot with mature trees and established vegetation, this property is full of character and unique vintage details. A separate art studio offers space for creativity, hobbies, or a workshop. Conveniently located near schools, shopping, and dining, this home needs rehabilitation and is being sold as-is. A great opportunity to restore a truly special property with endless potential.
Key facts
- Near schools
- Near shopping
- Art studio
Tags
Property features AI
Finance
- Other: Zoned Benson - R1 - 8
Exterior
- Utilities: Public water; Sewer connected; Electric service (implied)
- Home design: Single family residence; One story; Faces west; Fixer condition
- Construction: Block construction; Shingle roof; Built area approximately 1,349
- Exterior features: Gazebo; Workshop; Flower beds; Shrubs; Sprinklers in front; Adjacent to alley; East/West exposure; Paved road (city maintained); Sidewalks; Street lights
Interior
- Kitchen: Gas range
- Flooring: Vinyl flooring; Laminate flooring
- Bathrooms: 1 full bathroom
- Heating & cooling: Forced air heating; Evaporative cooling
- Interior features: Gas range; Laundry closet
- Laundry & utility: Laundry closet
Neighborhood map
What this means for you Summary
Snapshot
- This is a 2-bed/1.0-bath single-family listed at $150k.
Deal economics
- At list price, monthly cash flow is $44 ($531/yr) — positive.
- The deal already cash-flows at list — no discount required.
- To meet the 1% rule (rent ≥ 1% of price), the offer needs to be $125k (16.3% below list).
- Recommended offer: $125k (16.3% below list) — sets the bar for 1% rule.
- Cap rate 6.6% vs local median 4.5% in Benson — top-decile yield for the area; either an underpriced asset or a hidden risk that comps aren't pricing in. Stress-test before assuming the spread holds.
Location & tenants
- Location reads 71/100 on livability (#34 in AZ) — a middle-class / working-renter tenant base. Strengths: cost of living A+, housing A+, health & safety A; Watch: commute D, employment D, amenities F.
- Benson Unified School District (79226) (town): math 28% / reading 39% proficiency, ranked #98 of 249 in AZ (top 39%) — families likely to look elsewhere, expect single-tenant / working-renter base with shorter leases.
- Zoned schools: Benson Primary School (math 28% / reading 42%, grade F, #466 of 1,109 statewide, top 42%, 560 students, 54% FRL); Benson Middle School (math 29% / reading 39%, grade F, #67 of 218 statewide, top 31%, 295 students, 52% FRL); Benson High School (math 27% / reading 32%, grade F, #120 of 381 statewide, top 34%, 443 students, 38% FRL) — zoned schools at 48% FRL track the district average.
- Market conditions: 263 active listings in the ZIP; 2 comparable units currently listed for rent nearby; 437 units permitted in Cochise County in 2024 (6 in 5+ unit buildings).
Forward outlook
- Local home prices are declining (-3.0%/yr); year-one equity from $1k of loan paydown is wiped out by about $4k of value loss. Plan a longer hold.
- Cochise County population projected at -30% by 2050 — secular population decline; favor cash flow + early exit over multi-decade hold.
Negotiation context
- Only 13 days on market — expect competitive offers; lowballing is unlikely to land.
Risks & watch-outs
- Watch-outs: built in 1948 — expect roof / HVAC / electrical / plumbing capex.
- Climate carrying-cost: major wildfire risk; extreme-heat days projected 8→21/yr by 2055 (HVAC capex compounding) — expect insurance premiums to compound above CPI over the hold.
Questions for the listing agent
- Built in 1948 — when were the roof, HVAC, electrical panel, plumbing, and water heater last replaced?
- Is there a deadline driving the sale (1031 exchange, divorce, estate, relocation)? That informs how much negotiation room exists.
- Schools are B-rated — typically a magnet for longer-tenancy family renters. What's the average tenant stay here, and is there a school-zone premium baked into asking?
- The area grade is low — what's the realistic commute time and amenity access for the typical tenant pool here? Any planned neighborhood developments (good or bad) we should know about?
- What's the average days-on-market for RENTAL listings here right now (not sales)? A rising rental-DOM trend means longer vacancies and softer asking-rent achievability than the comps imply.
- What's the recent tenant-quality profile in this submarket — average credit score on applications, eviction rate, late-payment / NSF rate, and stable-employment percentage? A property-management company in the area should have these aggregated.
- How much new for-sale + rental construction is in the pipeline within 1–3 miles? Heavy new supply typically softens prices + rents 12–24 months out; constrained supply supports both.
Investment metrics
- 1% rule
- 0.84% ✗
- Cap rate
- 6.65%
- Cash-on-cash
- 1.26%
- DSCR
- 1.06
- GRM
- 10.0
CMA / ARV
- ARV (on-the-fly)
- $229,330
- Comps found
- 12
Show comp detail 12 sales within ~0.75 mi
| Address | Dist | Beds/Ba | Sqft | Sold | Price | $/sf | Match |
|---|---|---|---|---|---|---|---|
| 467 W Duane St | 0.27mi | 3/1.0 (+1) | 1,421 (+5%) | 7mo | $208,000 | $146 | 68 |
| 326 W Bonita St | 0.09mi | 3/2.0 (+1) | 1,205 (-11%) | 6mo | $233,840 | $194 | 64 |
| 648 W Cactus St | 0.43mi | 3/2.0 (+1) | 1,391 (+3%) | 7mo | $250,000 | $180 | 60 |
| 254 W La Cuesta Dr | 0.50mi | 3/2.0 (+1) | 1,380 (+2%) | 5mo | $269,000 | $195 | 60 |
| 165 E 6th St | 0.40mi | 3/1.0 (+1) | 1,232 (-9%) | 3mo | $160,000 | $130 | 60 |
| 487 E Patrick Dr | 0.49mi | 3/2.0 (+1) | 1,278 (-5%) | 1mo | $250,000 | $196 | 59 |
| 660 S High St | 0.21mi | 3/2.0 (+1) | 1,225 (-9%) | 14mo | $208,000 | $170 | 54 |
| 346 Gila St | 0.48mi | 2/2.0 | 1,429 (+6%) | 13mo | $237,000 | $166 | 53 |
| 850 S Ridge Dr | 0.38mi | 3/2.0 (+1) | 1,438 (+7%) | 13mo | $203,000 | $141 | 51 |
| 553 E 6th St | 0.62mi | 3/2.0 (+1) | 1,380 (+2%) | 13mo | $235,000 | $170 | 48 |
| 163 S San Pedro St | 0.53mi | 3/1.0 (+1) | 1,161 (-14%) | 0mo | $205,000 | $177 | 47 |
| 538 E 6th St | 0.59mi | 3/2.0 (+1) | 1,152 (-15%) | 12mo | $189,500 | $164 | 30 |
Match score weights: distance 35% · size 25% · config 20% · recency 20%. Top-matched comps best support the ARV.
Projected returns pro-forma
-3.0% appreciation · 3.0% rent growth · sell at horizon
- IRR
- -14.3%
- Equity multiple
- 0.49×
- Total profit
- $-21,523
- Equity at exit
- $22,365
- IRR
- -5.6%
- Equity multiple
- 0.64×
- Total profit
- $-15,258
- Equity at exit
- $12,969
Cash invested: $42,000 (down + closing). Projections, not guarantees.
Landlord ↔ Tenant lean methodology
- Overall (STATE)
- 87 Strongly Landlord-Friendly
- State Arizona
- 87 Strongly Landlord-Friendly · R+3
- County
- — inherits STATE
- City
- — inherits STATE
ZIP-level market 85602
- Home prices YoY
- -23.4%
- Active inventory
- 263
- Price-to-rent
- 10.0×
Monthly cashflow live
- Estimated rent
- $1,255 medium interval (Pro) →
- Mortgage (P&I)
- −$787
- Tax from tax record
- −$98 /mo · $1,176/yr
- Insurance
- −$62
- HOA
- −$0
- Vacancy / Maint / Mgmt
- −$264
- Net cashflow
- $44
Break-even live
UW: 25.0% down · 7.5% · 30yr · 1.5% tax · 5.0% vac · 8.0% maint · 8.0% mgmt
Financing live
Cash to close
- Down payment
- $37,500
- Closing costs
- $4,500
- Reserves months
- —
- Total cash needed
- —
Loan-product check · same deal, 3 products live
Conventional
25% down · 7.5% · 30yr
- Down + closing
- —
- Monthly P&I
- —
- Monthly cashflow
- —
- DSCR
- —
- Eligible?
- —
Personal DTI + credit; lowest rate.
DSCR
20% down · 8.5% · 30yr
- Down + closing
- —
- Monthly P&I
- —
- Monthly cashflow
- —
- DSCR
- —
- Eligible?
- —
No personal income docs; deal must DSCR.
Hard money
10% down · 12.0% · 12mo
- Down + closing
- —
- Monthly P&I
- —
- Monthly cashflow
- —
- DSCR
- —
- Eligible?
- —
Short-term bridge; refi at stabilization.
Rent comps 2 comps
| Address | Beds | Baths | Sqft | Rent | $/sqft | DOM | Units | Dist |
|---|---|---|---|---|---|---|---|---|
| 264 W 6th St Unit "C" Benson, AZ | 3.0 | 2.0 | 1120 | $1,350 | $1.21 | 43d | 1 | 0.37mi |
| 732 W 4th St Benson, AZ | 2.0 | 1.0 | 960 | $1,000 | $1.04 | 23d | 1 | 0.85mi |
Listing history 11 events
-
2026-06-18days on market $150,000 Active 13 DOM
-
2026-06-17days on market $150,000 Active 12 DOM
-
2026-06-16days on market $150,000 Active 11 DOM
-
2026-06-15days on market $150,000 Active 10 DOM
-
2026-06-13days on market $150,000 Active 8 DOM
-
2026-06-13days on market $150,000 Active 7 DOM
-
2026-06-10days on market $150,000 Active 5 DOM
-
2026-06-09days on market $150,000 Active 4 DOM
-
2026-06-08days on market $150,000 Active 3 DOM
-
2026-06-07remarks 469-char remark
-
2026-06-07$150,000 Active 2 DOM
ⓘ Source: listings_history table (triggers on properties + properties_extension) + one-shot
backfill from property_details.listing_events for pre-trigger history.
Tax reassessment forecast AZ · Resets to sale price
- Current annual tax
- $1,176 · $98/mo
- Projected year-2 tax
- $1,176 · $98/mo
- Expected delta
- $0/yr ($0/mo · 0.0%)
ⓘ Screening estimate from a state-policy table — verify with the county assessor before closing.
Climate risk First Street
- Flood 1/10 Low FEMA zone X (unshaded) · 0% chance over 30 yrs
- Wildfire 7/10 Severe
- Heat 6/10 Major 8 d/yr ≥101°F today · 21 d/yr by 30 yrs out
- Wind 1/10 Low
- Air quality 1/10 Low 0 unhealthy d/yr today · 0 by 30 yrs out
Nearby sold comps map
Loading sold comps map…
Walkable amenities ~0.75 mi
Loading nearby amenities…
Taxation est. · year 1
- Rental income
- $15,059
- − Mortgage interest
- −$8,402
- − Property taxes
- −$1,176
- − Insurance
- −$750
- − Repairs & maintenance
- −$1,205
- − Management
- −$1,205
- − Depreciation
- −$4,364
- Taxable loss
- −$2,042
- Est. tax savings @ 24.0%
- +$490
- After-tax cash flow
- $1,021/yr
For passive investors: Depreciation is non-cash, so a rental often shows a tax loss while cash-flowing — sheltering income. Rental losses are passive: they offset passive income freely, and up to $25,000/yr can offset ordinary (W-2) income if you actively participate and your MAGI is under $100k (phasing out to $0 by $150k); unused losses carry forward. On sale, claimed depreciation is recaptured at up to 25%, and gains may owe capital-gains tax (a 1031 exchange can defer both). Figures are a year-1 estimate at your 24.0% rate — not tax advice; consult a CPA.
Schools (NCES district)
- District
- Benson Unified School District (79226)
- NCES district ID
- 0400212
- Math proficiency
- 28% ▼ -24.00%
- Reading proficiency
- 39% ▼ -10.00%
- Median HH income
- $40,662
- Composite
- 28.17/100
- National rank
- #6811
- State rank
- #98 of 249 in AZ
Livability — Benson
- Score
- 71/100
- State rank
- #34
- US rank
- #6661
Category grades
Schools grade is shown separately in the Schools card above.
Census & demographics
- Census place
- Benson, AZ
- Population (ZIP)
- 9,860
Population outlook (Cochise County) Hauer SSP2
- Today (2025)
- 113,402 people
- By 2030
- 106,197 · -6.4%
- By 2040
- 92,166 · -18.7%
- By 2050
- 79,805 · -29.6%
- By 2075
- 56,831 · -49.9%
- By 2100
- 35,103 · -69.0%
Race, ethnicity, and origin ACS 2023
- Neighborhood character
- Predominantly White (78%)
- Race & ethnicity
- White 78% Hispanic / Latino 15% Two or more races 13%
- Hispanic origin (detail)
- Mexican 14%
- Common ancestry
- Portuguese 4% Slovak 3% Italian 2%
- Foreign-born
- 3% · Canada
- Languages at home
- 93% English-only · Spanish 5% German/W. Germanic 1%
Political lean MEDSL · Cochise
- 2024 margin
- Strong R (+23.1) · D 37.8% · R 61.0% · Other 1.2%
- 2008→2024 swing
- -2.5pp toward R · 2008: -20.7pp · 2024: -23.1pp
- All cycles
- 2024: R+23.1 2020: R+19.6 2016: R+22.6 2012: R+24.0 2008: R+20.7
Not yet ingested
- Civics
- —
Market trends
- HPI YoY
- ▼ -55.74%
- Current HPI
- 182.9079
- Rent YoY
- —
- Metro
- —
- State GDP YoY
- ▲ 4.54%
- F500 in state
- 20
Industry mix (Fortune 500 HQ in AZ)
| Industry | F500 HQs | Revenue |
|---|---|---|
| Technology | 2 | $13B |
|
||
| Mining / Metals | 1 | $23B |
|
||
| Environmental Services | 1 | $16B |
|
||
| Metals / Steel | 1 | $14B |
|
||
| Technology Distribution | 1 | $9B |
|
||
| Homebuilding | 1 | $8B |
|
||
Price history
1 event — show timeline
- 2026-06-06 Listed $150,000 MLSSAZ
Property tax history
+1.2%/yrLatest (2025): $1,176 · +3.2% YoY. Source: county tax records.
Cash-flow waterfall
monthlySold comps — $/sqft
last 12 mo · ≤1 miLoading sold comps…