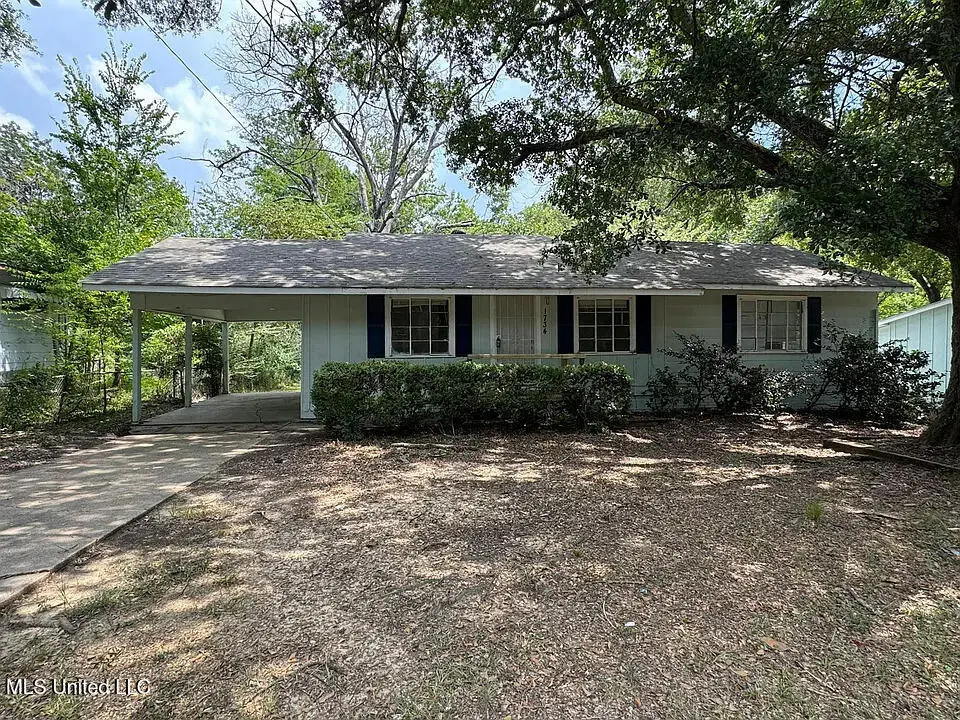
1734 Dixie Dr · Jackson, MS
Flood risk 1/10 · Minimal
- FEMA flood zone
- X (unshaded)
- Chance of flooding over 30 yrs
- 0.0%
- Est. flood insurance / yr
- $507 – $1,088
Fire risk 1/10 · Minimal
- Est. fire insurance / yr
- $1,241 – $2,305
Heat risk 7/10 · Major
- Hot days now (above 108°F)
- 7 days/yr
- Hot days in 30 yrs
- 18 days/yr
Wind risk 8/10 · Major
- Chance of severe wind over 30 yrs
- 80.0%
Air-quality risk 1/10 · Minimal
- Unhealthy air days now
- 0 days/yr
- Unhealthy air days in 30 yrs
- 0 days/yr
Risk factors via First Street. Map © Google.
Why this score? — see what drove the B+ grade
The composite is a weighted blend of 9 inputs, each scored 0–100. Each bar is that input's sub-score; the figure is the points it added to the 100-point composite (weight × sub-score).
- Cash flow +30.0/30.0
- DSCR +10.0/10.0
- Appreciation +10.0/10.0
- 1% rule +9.7/10.0
- ARV discount +7.5/15.0
- Livability +3.4/5.0
- Rent growth +2.5/5.0
- Condition / age +2.5/5.0
- Schools +1.1/10.0
$74,000
🖨 Deal sheet 📄 Offer letter ✓ Due diligence
Listing remarks MLS
Excellent investment opportunity in Jackson! This property offers strong rental upside with a market rent of approximately $980 per month and Section 8 rental potential up to $1,484 per month, making it ideal for investors seeking higher yield. Great option for buy-and-hold investors looking to maximize cash flow. Buyer to verify all rental rates and Section 8 amounts.
Key facts
- 9,583 sq ft lot
- Parking
- Built 1962
Neighborhood map
What this means for you Summary
Snapshot
- This is a 3-bed/1.0-bath single-family listed at $74k.
Deal economics
- At list price, monthly cash flow is $367 ($4k/yr) — positive.
- The deal already cash-flows at list — no discount required.
- Meets the 1% rule at list price ($1k rent vs $74k).
- Recommended offer: $67k (9.0% below list) — sets the bar for market timing.
- Cap rate 12.2% vs local median 9.9% in Jackson — meaningfully above typical; check what's discounted (condition, days-on-market, listing class) to confirm the premium yield is real.
Location & tenants
- Location reads 68/100 on livability (#66 in MS) — a middle-class / working-renter tenant base. Strengths: commute A+, cost of living A+, housing A+; Watch: schools F, amenities F, employment F.
- Jackson Public School District (urban): math 9% / reading 18% proficiency, ranked #112 of 130 in MS (top 86%) — low school quality limits family demand, transient renter base, plan for 1-2y turnover; 88% free/reduced lunch — lower-income household profile, screen leases tightly.
- Market conditions: 165 active listings in the ZIP; 12 comparable units currently listed for rent nearby; rentals lingering (median 44d on market — plan ~5-8 weeks vacancy on turnover, expect pricing pressure); 50% of comp listings sitting > 30 days — soft ceiling on asking rent; lower-income renter base — watch delinquency; 167 units permitted in Hinds County in 2024 (0 in 5+ unit buildings).
- This rent runs 36% of the median local income ($36k/yr) — at the standard rent-burdened threshold; future hikes will face affordability resistance.
Forward outlook
- In year one you build about $8k of equity ($512 loan paydown + $7k appreciation (10.0% local appreciation)).
- Hinds County population projected to shrink 6% by 2050 — rents likely to lag national; underwrite the cash flow, not the appreciation.
- At projected returns (10.0% appreciation + 3.0% rent growth), your $21k cash investment doubles in ~2 years — after that, you're playing with house money.
- By year 5, paydown + projected appreciation supports a ~$37k cash-out refi (75% LTV) — recoverable capital for the next deal without selling this one.
Negotiation context
- It's been on market 120 days — a 9% lower offer ($67k) is reasonable based on typical stale-listing flexibility.
- 4 sale attempts since 2y ago with the ask held roughly flat each time — persistent listings suggest the price (not the market) is what's stuck; bring a comps-based counter.
Risks & watch-outs
- Climate carrying-cost: severe wind risk, 80% chance of damaging wind over 30y; extreme-heat days projected 7→18/yr by 2055 (HVAC capex compounding) — expect insurance premiums to compound above CPI over the hold.
Questions for the listing agent
- It's been on market 120 days. Have you received any prior offers? Is the seller open to a 9% concession, seller financing, or rate buy-down credit?
- Built in 1962 — when were the roof, HVAC, electrical panel, plumbing, and water heater last replaced?
- Why hasn't it sold? Are there any deal-killer items the seller is aware of (foundation, flood, title, zoning, code violations)?
- Is there a deadline driving the sale (1031 exchange, divorce, estate, relocation)? That informs how much negotiation room exists.
- Schools are F-rated, which usually means shorter tenancies and higher turnover. Who's the typical renter profile here, and what's been the actual vacancy rate?
- What's the average days-on-market for RENTAL listings here right now (not sales)? A rising rental-DOM trend means longer vacancies and softer asking-rent achievability than the comps imply.
- What's the recent tenant-quality profile in this submarket — average credit score on applications, eviction rate, late-payment / NSF rate, and stable-employment percentage? A property-management company in the area should have these aggregated.
- How much new for-sale + rental construction is in the pipeline within 1–3 miles? Heavy new supply typically softens prices + rents 12–24 months out; constrained supply supports both.
Investment metrics
- 1% rule
- 1.47% ✓
- Cap rate
- 12.24%
- Cash-on-cash
- 21.25%
- DSCR
- 1.95
- GRM
- 5.7
CMA / ARV
- ARV (median comp)
- $31,513
- List price
- $74,000
- Delta
- 134.82%
- Verdict
- OVERPRICED
- Comps
- 8 within 1.0 mi
Show comp detail 2 sales within ~0.75 mi
| Address | Dist | Beds/Ba | Sqft | Sold | Price | $/sf | Match |
|---|---|---|---|---|---|---|---|
| 1816 Kenmore Dr | 0.11mi | 3/2.0 | 1,000 (-3%) | 8mo | $85,000 | $85 | 79 |
| 4667 Dixie Dr | 0.59mi | 2/1.0 (-1) | 912 (-12%) | 7mo | $30,000 | $33 | 42 |
Match score weights: distance 35% · size 25% · config 20% · recency 20%. Top-matched comps best support the ARV.
Projected returns pro-forma
10.0% appreciation · 3.0% rent growth · sell at horizon
- IRR
- 40.2%
- Equity multiple
- 4.07×
- Total profit
- $63,675
- Equity at exit
- $66,665
- IRR
- 34.6%
- Equity multiple
- 9.16×
- Total profit
- $169,143
- Equity at exit
- $143,766
Cash invested: $20,720 (down + closing). Projections, not guarantees.
Landlord ↔ Tenant lean methodology
- Overall (STATE)
- 90 Strongly Landlord-Friendly
- State Mississippi
- 90 Strongly Landlord-Friendly · R+11
- County
- — inherits STATE
- City
- — inherits STATE
ZIP-level market 39209
- Home prices YoY
- 7.7%
- Active inventory
- 165
- Price-to-rent
- 5.7×
Monthly cashflow live
- Estimated rent
- $1,087 high interval (Pro) →
- Mortgage (P&I)
- −$388
- Tax from tax record
- −$73 /mo · $873/yr
- Insurance
- −$31
- HOA
- −$0
- Vacancy / Maint / Mgmt
- −$228
- Net cashflow
- $367
Break-even live
UW: 25.0% down · 7.5% · 30yr · 1.5% tax · 5.0% vac · 8.0% maint · 8.0% mgmt
Financing live
Cash to close
- Down payment
- $18,500
- Closing costs
- $2,220
- Reserves months
- —
- Total cash needed
- —
Loan-product check · same deal, 3 products live
Conventional
25% down · 7.5% · 30yr
- Down + closing
- —
- Monthly P&I
- —
- Monthly cashflow
- —
- DSCR
- —
- Eligible?
- —
Personal DTI + credit; lowest rate.
DSCR
20% down · 8.5% · 30yr
- Down + closing
- —
- Monthly P&I
- —
- Monthly cashflow
- —
- DSCR
- —
- Eligible?
- —
No personal income docs; deal must DSCR.
Hard money
10% down · 12.0% · 12mo
- Down + closing
- —
- Monthly P&I
- —
- Monthly cashflow
- —
- DSCR
- —
- Eligible?
- —
Short-term bridge; refi at stabilization.
Rent comps 12 comps
| Address | Beds | Baths | Sqft | Rent | $/sqft | DOM | Units | Dist |
|---|---|---|---|---|---|---|---|---|
| 1816 Kenmore Dr Jackson, MS | 3.0 | 2.0 | 1000 | $1,000 | $1.00 | 23d | 1 | 0.11mi |
| 3856 Noble St Jackson, MS | 3.0 | 2.0 | 1357 | $1,231 | $0.91 | 23d | 1 | 0.74mi |
| 3856 Noble St Jackson, MS | 3.0 | 2.0 | 1357 | $1,231 | $0.91 | 43d | 1 | 0.74mi |
| 2010 Chadwick Dr Jackson, MS | 2.0 | 2.0 | 1089 | $1,174 | $1.08 | 13d | 1 | 0.83mi |
| 2010 Chadwick Dr Jackson, MS | 3.0 | 2.0 | 1275 | $1,145 | $0.90 | 43d | 1 | 0.83mi |
| 723 Glenmont Dr Jackson, MS | 3.0 | 1.0 | 1018 | $1,000 | $0.98 | 43d | 1 | 1.10mi |
| 4567 Meadowmont Dr Jackson, MS | 3.0 | 1.0 | 912 | $800 | $0.88 | 43d | 1 | 1.11mi |
| 1805 Hospital Dr Jackson, MS | 3.0 | 2.0 | 1335 | $1,050 | $0.79 | 13d | 1 | 1.11mi |
| 1533 Raymond Rd Jackson, MS | 2.0 | 1.0 | 1135 | $1,010 | $0.89 | 43d | 1 | 1.34mi |
| 5136 Lurline Dr Unit Ma Jackson, MS | 3.0 | 1.5 | 1134 | $1,100 | $0.97 | 13d | 1 | 1.46mi |
| 2119 Woodland Way Jackson, MS | 3.0 | 2.0 | 1000 | $1,155 | $1.16 | 44d | 1 | 1.48mi |
| 2119 Woodland Way Jackson, MS | 2.0 | 2.0 | 880 | $965 | $1.10 | 21d | 1 | 1.48mi |
Listing history 29 events
-
2026-06-17days on market $74,000 Active 120 DOM
-
2026-06-16days on market $74,000 Active 119 DOM
-
2026-06-15days on market $74,000 Active 118 DOM
-
2026-06-14days on market $74,000 Active 116 DOM
-
2026-06-13days on market $74,000 Active 115 DOM
-
2026-06-10days on market $74,000 Active 113 DOM
-
2026-06-09days on market $74,000 Active 112 DOM
-
2026-06-08days on market $74,000 Active 111 DOM
-
2026-06-07days on market $74,000 Active 110 DOM
-
2026-06-05days on market $74,000 Active 107 DOM
-
2026-06-03days on market $74,000 Active 106 DOM
-
2026-06-02days on market $74,000 Active 105 DOM
-
2026-06-01days on market $74,000 Active 104 DOM
-
2026-05-31days on market $74,000 Active 103 DOM
-
2026-05-30days on market $74,000 Active 102 DOM
-
2026-02-17$74,000 Active 373-char remark
Show marketing remark (373 chars)
Excellent investment opportunity in Jackson! This property offers strong rental upside with a market rent of approximately $980 per month and Section 8 rental potential up to $1,484 per month, making it ideal for investors seeking higher yield. Great option for buy-and-hold investors looking to maximize cash flow. Buyer to verify all rental rates and Section 8 amounts.
-
2026-01-31historical $1,000
-
2025-11-06price $1,000
-
2025-08-13$1,100
-
2024-10-22soldstatus Closed 180-char remark
Show marketing remark (180 chars)
Completely remodeled 3-bedroom, 1-bath home featuring new LVP flooring, modern fixtures, fully renovated bathrooms and kitchen, and three new window units with heating and cooling.
-
2024-10-18soldstatus
-
2024-07-22historical $900
-
2024-07-11status Pending 180-char remark
Show marketing remark (180 chars)
Completely remodeled 3-bedroom, 1-bath home featuring new LVP flooring, modern fixtures, fully renovated bathrooms and kitchen, and three new window units with heating and cooling.
-
2024-07-03$90,000 Active 180-char remark
Show marketing remark (180 chars)
Completely remodeled 3-bedroom, 1-bath home featuring new LVP flooring, modern fixtures, fully renovated bathrooms and kitchen, and three new window units with heating and cooling.
-
2024-06-26$900
-
2011-10-13soldstatus
-
2005-02-10soldstatus
-
1989-09-18soldstatus
-
1988-05-17soldstatus
ⓘ Source: listings_history table (triggers on properties + properties_extension) + one-shot
backfill from property_details.listing_events for pre-trigger history.
Tax reassessment forecast MS · Resets to sale price
- Current annual tax
- $873 · $73/mo
- Projected year-2 tax
- $873 · $73/mo
- Expected delta
- $0/yr ($0/mo · 0.0%)
ⓘ Screening estimate from a state-policy table — verify with the county assessor before closing.
Climate risk First Street
- Flood 1/10 Low FEMA zone X (unshaded) · 0% chance over 30 yrs
- Wildfire 1/10 Low
- Heat 7/10 Severe 7 d/yr ≥108°F today · 18 d/yr by 30 yrs out
- Wind 8/10 Severe 80% chance of damaging wind over 30 yrs
- Air quality 1/10 Low 0 unhealthy d/yr today · 0 by 30 yrs out
Nearby sold comps map
Loading sold comps map…
Walkable amenities ~0.75 mi
Loading nearby amenities…
Taxation est. · year 1
- Rental income
- $13,041
- − Mortgage interest
- −$4,145
- − Property taxes
- −$873
- − Insurance
- −$370
- − Repairs & maintenance
- −$1,043
- − Management
- −$1,043
- − Depreciation
- −$2,153
- Taxable income
- $3,414
- Est. tax owed @ 24.0%
- −$819
- After-tax cash flow
- $3,583/yr
For passive investors: Depreciation is non-cash, so a rental often shows a tax loss while cash-flowing — sheltering income. Rental losses are passive: they offset passive income freely, and up to $25,000/yr can offset ordinary (W-2) income if you actively participate and your MAGI is under $100k (phasing out to $0 by $150k); unused losses carry forward. On sale, claimed depreciation is recaptured at up to 25%, and gains may owe capital-gains tax (a 1031 exchange can defer both). Figures are a year-1 estimate at your 24.0% rate — not tax advice; consult a CPA.
Schools (NCES district)
- District
- Jackson Public School District
- NCES district ID
- 2802190
- Math proficiency
- 9% ▼ -14.00%
- Reading proficiency
- 18% ▼ -7.00%
- Median HH income
- $33,234
- Composite
- 10.89/100
- National rank
- #9755
- State rank
- #112 of 130 in MS
Livability — Jackson
- Score
- 68/100
- State rank
- #66
- US rank
- #9695
Category grades
Schools grade is shown separately in the Schools card above.
Census & demographics
- Census place
- Jackson, MS
- County
- Hinds County · 167,040 people
- City population
- 140,204
- Metro
- Jackson, MS
- Population (ZIP)
- 25,776
- Household income
- $36,344
- Rent vs Own
- Severe rent burden
- 1627.0
Population outlook (Hinds County) Hauer SSP2
- Today (2025)
- 242,528 people
- By 2030
- 241,113 · -0.6%
- By 2040
- 235,557 · -2.9%
- By 2050
- 226,946 · -6.4%
- By 2075
- 199,995 · -17.5%
- By 2100
- 164,165 · -32.3%
Race, ethnicity, and origin ACS 2023
- Neighborhood character
- Predominantly Black (90%)
- Race & ethnicity
- Black 90% White 7% Two or more races 2% Hispanic / Latino 1%
- Foreign-born
- 1% · Canada
- Languages at home
- 98% English-only · Spanish 2%
Political lean MEDSL · Hinds
- 2024 margin
- Solid D (+46.1) · D 72.4% · R 26.3% · Other 1.4%
- 2008→2024 swing
- +7.1pp toward D · 2008: 39.0pp · 2024: 46.1pp
- All cycles
- 2024: D+46.1 2020: D+48.3 2016: D+43.7 2012: D+45.1 2008: D+39.0
Not yet ingested
- Civics
- —
Market trends
- HPI YoY
- ▲ 22.28%
- Current HPI
- 312.6754
- Rent YoY
- —
- Metro
- Jackson, MS
- State GDP YoY
- —
- F500 in state
- 0
Price history
-17.8% since first listed14 events — show timeline
- 2026-02-17 Listed $74,000 MLSU
- 2026-01-31 Rental Removed $1,000 Hemlane
- 2025-11-06 Price Changed $1,000 Hemlane
- 2025-08-13 Listed for Rent $1,100 Hemlane
- 2024-10-22 Sold (MLS) — MLSU
- 2024-10-18 Sold (Public Records) — Public Records
- 2024-07-22 Rental Removed $900 BUILDIUM
- 2024-07-11 Pending — MLSU
- 2024-07-03 Listed $90,000 MLSU
- 2024-06-26 Listed for Rent $900 BUILDIUM
- 2011-10-13 Sold (Public Records) — Public Records
- 2005-02-10 Sold (Public Records) — Public Records
- 1989-09-18 Sold (Public Records) — Public Records
- 1988-05-17 Sold (Public Records) — Public Records
Property tax history
+0.9%/yrLatest (2025): $873 · +0.4% YoY. Source: county tax records.
Cash-flow waterfall
monthlySold comps — $/sqft
last 12 mo · ≤1 miLoading sold comps…