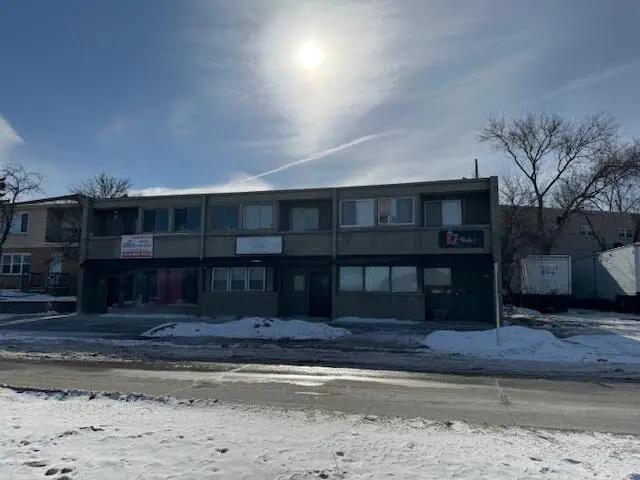
9913 W Lisbon Ave Unit 9915, 9917, 9919 · Milwaukee, WI
Flood risk No data
- FEMA flood zone
- —
- Chance of flooding over 30 yrs
- —
- Est. flood insurance / yr
- —
Fire risk No data
- Est. fire insurance / yr
- —
Heat risk No data
- Hot days now (above threshold)
- —
- Hot days in 30 yrs
- —
Wind risk No data
- Chance of severe wind over 30 yrs
- —
Air-quality risk No data
- Unhealthy air days now
- —
- Unhealthy air days in 30 yrs
- —
Risk factors via First Street. Map © Google.
Why this score? — see what drove the F grade
The composite is a weighted blend of 9 inputs, each scored 0–100. Each bar is that input's sub-score; the figure is the points it added to the 100-point composite (weight × sub-score).
- ARV discount +7.5/15.0
- Livability +4.0/5.0
- Rent growth +3.2/5.0
- Condition / age +2.0/5.0
- Schools +1.2/10.0
- Cash flow +0.0/30.0
- 1% rule +0.0/10.0
- DSCR +0.0/10.0
- Appreciation +0.0/10.0
$649,900
🖨 Deal sheet (PDF) 📄 Offer letter ✓ Due diligence
Listing remarks
Five one bedroom units on the upper level, along with laundry. 3 Commercial Units on the street level. All units are rented. Solid block building has had many updates throughout the last 20 years. This location is near Lisbon and Capitol Dr. intersection.
Key facts
- One bedroom units
- Solid block building
- Updates
Tags
Property features AI
Finance
- Other: Located in the City of Milwaukee
- Financial info: 8 total units
Exterior
- Parking: Outdoor parking; Inside parking; Outside spaces
- Utilities: Municipal water; Municipal sewer
- Home design: Multi-family property; Apartment building; 1-2 stories; Zoned NS1 Commercial
- Construction: Information about year built listed as 'Other - See Remarks'
- Exterior features: Other exterior; Lot less than 1/2 acre
Interior
- Heating & cooling: Hot water/steam heating; Natural gas fuel
- Interior features: Partial block basement
- Laundry & utility: Seller-leased washer; Seller-leased dryer; Seller-owned water heater
Neighborhood map
What this means for you Summary
Snapshot
- This is a condo listed at $650k. Condition is rated fair.
Deal economics
- At list price, monthly cash flow is $-3k ($-41k/yr) — negative.
- To cash-flow at today's rent, offer at most $160k (75.3% below list).
- To meet the 1% rule (rent ≥ 1% of price), the offer needs to be $140k (78.4% below list).
- Recommended offer: $140k (78.4% below list) — sets the bar for 1% rule.
- Cap rate 0.0% vs local median 5.1% in Milwaukee — below-typical yield; the buyer is paying a premium for something (appreciation thesis, condition, location) that the cap rate doesn't capture.
Location & tenants
- Location reads 81/100 on livability (#55 in WI, #1,534 nationally) — a professional / high-income tenant draw. Strengths: amenities A+, commute A+, cost of living A+; Watch: employment D+, schools F, crime F.
- Milwaukee School District (urban): math 10% / reading 18% proficiency, ranked #337 of 342 in WI (top 98%) — low school quality limits family demand, transient renter base, plan for 1-2y turnover; 77% free/reduced lunch — lower-income household profile, screen leases tightly.
- Market conditions: Rents rising (+2.9%/yr); 63 active listings in the ZIP; 40 comparable units currently listed for rent nearby; rentals at typical pace (median 19d on market — plan ~3-4 weeks tenant-placement turnaround); solid renter incomes; 1,017 units permitted in Milwaukee County in 2024 (803 in 5+ unit buildings).
Forward outlook
- Local home prices are declining (-3.0%/yr); year-one equity from $4k of loan paydown is wiped out by about $19k of value loss. Plan a longer hold.
- Milwaukee County population projected at +4% by 2050 — modest demand growth; plan on rents tracking national, not racing it.
Negotiation context
- It's been on market 141 days — a 12% lower offer ($572k) is reasonable based on typical stale-listing flexibility.
Questions for the listing agent
- What do current leases actually rent for vs. the listed asking? Can we see a recent rent roll and the last 12 months of T-12 income?
- It's been on market 141 days. Have you received any prior offers? Is the seller open to a 78% concession, seller financing, or rate buy-down credit?
- Have any recent inspections been done? Can we get a copy of the seller's disclosures and any deferred-maintenance estimates?
- Built in 1962 — when were the roof, HVAC, electrical panel, plumbing, and water heater last replaced?
- Any open or pending special assessments — roof, HVAC, plumbing, elevator, façade? What's the per-unit balance and payoff schedule, and is the seller paying it off at close or rolling it to the buyer?
- Why hasn't it sold? Are there any deal-killer items the seller is aware of (foundation, flood, title, zoning, code violations)?
- Is there a deadline driving the sale (1031 exchange, divorce, estate, relocation)? That informs how much negotiation room exists.
- Schools are F-rated, which usually means shorter tenancies and higher turnover. Who's the typical renter profile here, and what's been the actual vacancy rate?
- Crime grade is F in this area — have there been break-ins, vandalism, or insurance claims at this property in the last 3 years? What carrier currently insures it and at what premium?
- The area grade is low — what's the realistic commute time and amenity access for the typical tenant pool here? Any planned neighborhood developments (good or bad) we should know about?
- What's the average days-on-market for RENTAL listings here right now (not sales)? A rising rental-DOM trend means longer vacancies and softer asking-rent achievability than the comps imply.
- What's the recent tenant-quality profile in this submarket — average credit score on applications, eviction rate, late-payment / NSF rate, and stable-employment percentage? A property-management company in the area should have these aggregated.
- How much new apartment / multifamily construction is in the pipeline within 1–3 miles? Heavy new supply (>2% of stock underway) typically softens rents 12–24 months out; light construction supports rent growth.
Investment metrics
- 1% rule
- 0.22% ✗
- Cap rate
- 0.05%
- Cash-on-cash
- -22.31%
- DSCR
- 0.01
- GRM
- 38.6
CMA / ARV
No comps found within radius.
Projected returns pro-forma
-3.0% appreciation · 2.85% rent growth · sell at horizon
- IRR
- -64.4%
- Equity multiple
- -0.76×
- Total profit
- $-320,935
- Equity at exit
- $96,902
- IRR
- —
- Equity multiple
- -2.06×
- Total profit
- $-557,649
- Equity at exit
- $56,191
Cash invested: $181,972 (down + closing). Projections, not guarantees.
Landlord ↔ Tenant lean methodology
- Overall (STATE)
- 73 Landlord-Friendly
- State Wisconsin
- 73 Landlord-Friendly · R+2
- County
- — inherits STATE
- City
- — inherits STATE
ZIP-level market 53222
- Rents YoY
- 2.9%
- Active inventory
- 63
- Price-to-rent
- 38.6×
Monthly cashflow live
- Estimated rent
- $1,404 high interval (Pro) →
- Mortgage (P&I)
- −$3,408
- Tax est. 1.5%
- −$812 /mo · $9,748/yr
- Insurance
- −$271
- HOA
- −$0
- Lot rent
- −$0
- Vacancy / Maint / Mgmt
- −$295
- Net cashflow
- $-3,383
Break-even live
Sensitivity live
| Price | -10% $-2,933 | -5% $-3,158 | +0% $-3,383 | +5% $-3,607 | +10% $-3,832 |
|---|---|---|---|---|---|
| Rent | -10% $-3,493 | -5% $-3,438 | +0% $-3,383 | +5% $-3,327 | +10% $-3,272 |
| Rate | -1.0pp $-3,055 | -0.5pp $-3,217 | base $-3,383 | +0.5pp $-3,551 | +1.0pp $-3,722 |
UW: 25.0% down · 7.5% · 30yr · 1.5% tax · 5.0% vac · 8.0% maint · 8.0% mgmt
Financing live
Cash to close
- Down payment
- $162,475
- Closing costs
- $19,497
- Reserves months
- —
- Total cash needed
- —
Loan-product check · same deal, 3 products live
Conventional
25% down · 7.5% · 30yr
- Down + closing
- —
- Monthly P&I
- —
- Monthly cashflow
- —
- DSCR
- —
- Eligible?
- —
Personal DTI + credit; lowest rate.
DSCR
20% down · 8.5% · 30yr
- Down + closing
- —
- Monthly P&I
- —
- Monthly cashflow
- —
- DSCR
- —
- Eligible?
- —
No personal income docs; deal must DSCR.
Hard money
10% down · 12.0% · 12mo
- Down + closing
- —
- Monthly P&I
- —
- Monthly cashflow
- —
- DSCR
- —
- Eligible?
- —
Short-term bridge; refi at stabilization.
Rent comps 40 comps
| Address | Beds | Baths | Sqft | Rent | $/sqft | DOM | Units | Dist |
|---|---|---|---|---|---|---|---|---|
| 3521 N 99th St Unit 2 Milwaukee, WI | 3.0 | 1.0 | 1200 | $1,850 | $1.54 | 0d | 1 | 0.35mi |
| 4135 N 104th St Milwaukee, WI | 2.0 | 1.5 | — | $1,150 | — | 7d | 1 | 0.41mi |
| 4225 N 104th St Unit 2 Milwaukee, WI | 2.0 | 1.5 | 1000 | $1,250 | $1.25 | 46d | 1 | 0.50mi |
| 4244 N 104th St #3 Milwaukee, WI | 2.0 | 1.5 | — | $1,350 | — | 15d | 1 | 0.52mi |
| 4053 N 91st St Milwaukee, WI | 3.0 | 1.0 | 1158 | $1,248 | $1.08 | 7d | 1 | 0.56mi |
| 4118 N 91st St Milwaukee, WI | 2.0 | 1.0 | — | $1,300 | — | 15d | 1 | 0.62mi |
| 4118 N 91st St Milwaukee, WI | 2.0 | 1.0 | — | $1,300 | — | 46d | 1 | 0.62mi |
| 4175 N 91st St Milwaukee, WI | 2.0 | 1.0 | 855 | $1,099 | $1.29 | 46d | 1 | 0.63mi |
| 4325 N 104th St Milwaukee, WI | 2.0 | 1.0 | — | $1,150 | — | 5d | 1 | 0.64mi |
| 4325 N 104th St Milwaukee, WI | 2.0 | 1.0 | — | $1,150 | — | 46d | 1 | 0.64mi |
| 4350 N 94th St Wauwatosa, WI | 2.0 | 2.0 | — | $1,350 | — | 26d | 1 | 0.68mi |
| 9016 N 90th St Unit 8875 101 Milwaukee, WI | 1.0 | 1.0 | 815 | $999 | $1.23 | 17d | 1 | 0.70mi |
| 9016 N 90th St Unit 8854 202 Milwaukee, WI | 3.0 | 1.5 | 1100 | $1,599 | $1.45 | 19d | 1 | 0.70mi |
| 9016 N 90th St Unit 5000 203 Milwaukee, WI | 3.0 | 1.5 | 1100 | $1,799 | $1.64 | 0d | 1 | 0.70mi |
| 9016 N 90th St Unit 5010 101 Milwaukee, WI | 1.0 | 1.0 | 815 | $999 | $1.23 | 0d | 1 | 0.70mi |
| 9016 N 90th St Unit 8873 103 Milwaukee, WI | 2.0 | 1.5 | 950 | $1,399 | $1.47 | 7d | 1 | 0.70mi |
| 9016 N 90th St Unit 8856 202 Milwaukee, WI | 3.0 | 1.5 | 1100 | $1,799 | $1.64 | 46d | 1 | 0.70mi |
| 9016 N 90th St Unit 8854 103 Milwaukee, WI | 2.0 | 1.5 | 950 | $1,299 | $1.37 | 26d | 1 | 0.70mi |
| 9016 N 90th St Unit 9012 202 Milwaukee, WI | 3.0 | 1.5 | 1100 | $1,699 | $1.54 | 19d | 1 | 0.70mi |
| 9016 N 90th St Unit 9002 104 Milwaukee, WI | 1.0 | 1.0 | 815 | $1,099 | $1.35 | 19d | 1 | 0.70mi |
| 9016 N 90th St Unit 9002 202 Milwaukee, WI | 3.0 | 1.5 | 1100 | $1,599 | $1.45 | 17d | 1 | 0.70mi |
| 9016 N 90th St Unit 8858 204 Milwaukee, WI | 2.0 | 1.0 | 975 | $1,299 | $1.33 | 7d | 1 | 0.70mi |
| 9016 N 90th St Unit 5004 204 Milwaukee, WI | 2.0 | 1.0 | 975 | $1,199 | $1.23 | 19d | 1 | 0.70mi |
| 9016 N 90th St Unit 5010 202 Milwaukee, WI | 3.0 | 1.5 | 1100 | $1,599 | $1.45 | 0d | 1 | 0.70mi |
| 4300 N 92nd St Milwaukee, WI | 2.0 | 1.0 | — | $1,250 | — | 46d | 1 | 0.70mi |
| 4309 N 91st St Unit Upper Milwaukee, WI | 3.0 | 1.0 | 1100 | $1,395 | $1.27 | 46d | 1 | 0.73mi |
| 4272 N 91st St #4274 Milwaukee, WI | 3.0 | 1.5 | 1100 | $1,495 | $1.36 | 46d | 1 | 0.73mi |
| 9131 W Congress St Unit 10 Milwaukee, WI | 1.0 | 1.0 | — | $850 | — | 26d | 1 | 0.78mi |
| 4315 N 90th St Unit 4 Milwaukee, WI | 2.0 | 1.0 | 750 | $995 | $1.33 | 15d | 1 | 0.78mi |
| 3615 N 87th St Milwaukee, WI | 3.0 | 2.0 | 1617 | $2,595 | $1.60 | 0d | 1 | 0.83mi |
| 4052 N 85th St Milwaukee, WI | 3.0 | 1.0 | 1113 | $1,500 | $1.35 | 7d | 1 | 0.96mi |
| 4141 N 84th St Unit 4141 Milwaukee, WI | 2.0 | 1.0 | 950 | $1,300 | $1.37 | 46d | 1 | 1.02mi |
| 4718 N 100th St Milwaukee, WI | 2.0 | 1.5–2.0 | 1200 | $1,625 | $1.35 | 26d | 1 | 1.11mi |
| 4278 N 84th St Unit 1 Milwaukee, WI | 2.0 | 1.0 | 750 | $995 | $1.33 | 26d | 1 | 1.13mi |
| 11221 Synergy Dr Ste 100 Wauwatosa, WI | 1.0–2.0 | 1.0–2.0 | 874 | $2,855 | $3.26 | 0d | 13 | 1.15mi |
| 11221 Synergy Dr Milwaukee, WI | 2.0 | 1.0–2.0 | 713 | $1,790 | $2.51 | 0d | 6 | 1.17mi |
| 10416 W Hampton Ave Milwaukee, WI | 2.0 | 1.0 | — | $1,100 | — | 46d | 1 | 1.22mi |
| 10416 W Hampton Ave Milwaukee, WI | 2.0 | 1.0 | — | $1,100 | — | 19d | 1 | 1.22mi |
| 4812 N 104th St Apt 4 Milwaukee, WI | 2.0 | 1.5 | 1000 | $1,285 | $1.28 | 46d | 1 | 1.22mi |
| 4824 N 104th St Unit 12 Milwaukee, WI | 3.0 | 2.0 | 1300 | $1,510 | $1.16 | 19d | 1 | 1.24mi |
HOA detail condo
- Monthly dues
- $0 · $0/yr
- Assessments
- None detected in remarks — confirm with the listing agent.
Listing history 18 events
-
2026-06-22days on market $649,900 Active 141 DOM
-
2026-06-21days on market $649,900 Active 140 DOM
-
2026-06-18days on market $649,900 Active 137 DOM
-
2026-06-17days on market $649,900 Active 136 DOM
-
2026-06-16days on market $649,900 Active 135 DOM
-
2026-06-15days on market $649,900 Active 134 DOM
-
2026-06-13days on market $649,900 Active 132 DOM
-
2026-06-13days on market $649,900 Active 131 DOM
-
2026-06-09days on market $649,900 Active 128 DOM
-
2026-06-08days on market $649,900 Active 127 DOM
-
2026-06-07days on market $649,900 Active 126 DOM
-
2026-06-05days on market $649,900 Active 123 DOM
-
2026-06-03days on market $649,900 Active 122 DOM
-
2026-06-02days on market $649,900 Active 121 DOM
-
2026-06-01days on market $649,900 Active 120 DOM
-
2026-05-31days on market $649,900 Active 119 DOM
-
2026-03-24price $649,900
-
2026-02-01$699,900 Active
ⓘ Source: listings_history table (triggers on properties + properties_extension) + one-shot
backfill from property_details.listing_events for pre-trigger history.
Nearby sold comps map
Loading sold comps map…
Walkable amenities ~0.75 mi
Loading nearby amenities…
Taxation est. · year 1
- Rental income
- $16,843
- − Mortgage interest
- −$36,405
- − Property taxes
- −$9,748
- − Insurance
- −$3,250
- − Repairs & maintenance
- −$1,347
- − Management
- −$1,347
- − Depreciation
- −$18,906
- Taxable loss
- −$54,161
- Est. tax savings @ 24.0%
- +$12,999
- After-tax cash flow
- $-27,591/yr
For passive investors: Depreciation is non-cash, so a rental often shows a tax loss while cash-flowing — sheltering income. Rental losses are passive: they offset passive income freely, and up to $25,000/yr can offset ordinary (W-2) income if you actively participate and your MAGI is under $100k (phasing out to $0 by $150k); unused losses carry forward. On sale, claimed depreciation is recaptured at up to 25%, and gains may owe capital-gains tax (a 1031 exchange can defer both). Figures are a year-1 estimate at your 24.0% rate — not tax advice; consult a CPA.
Condition & rehab AI · 2 photos
This multi-family property requires significant exterior and interior repairs, including painting, HVAC upgrade, and window replacement. While the location is desirable, the current condition is holding back its value.
Repairs flagged
- Major exterior siding — Significant wear and tear
- Major roof — Aged appearance
- Major HVAC/mechanicals — Likely outdated and inefficient
- Major interior walls/paint — Needs fresh paint and possibly repairs
- Major windows — Likely old and possibly drafty
Value-add opportunities
- Both exterior painting — Fresh paint can improve curb appeal and value
- Both HVAC upgrade — Modern HVAC can improve comfort and energy efficiency
- Both window replacement — New windows can improve energy efficiency and reduce heating/cooling costs
Renovation cost estimate screening
| Repair item | Severity | Est. cost |
|---|---|---|
| exterior siding · Significant wear and tear | Major | $15,000–50,000 |
| roof · Aged appearance | Major | $15,000–50,000 |
| HVAC/mechanicals · Likely outdated and inefficient | Major | $15,000–50,000 |
| interior walls/paint · Needs fresh paint and possibly repairs | Major | $15,000–50,000 |
| windows · Likely old and possibly drafty | Major | $15,000–50,000 |
| Total estimated repair cost · 5 items | $75,000–250,000 |
Value-add ROI direction
- Both exterior painting — Fresh paint can improve curb appeal and value ↑
- Both HVAC upgrade — Modern HVAC can improve comfort and energy efficiency ↑
- Both window replacement — New windows can improve energy efficiency and reduce heating/cooling costs ↑
ⓘ Cost ranges are severity-bucket heuristics (US national rule-of-thumb). Get contractor quotes + a written scope before underwriting a rehab budget.
Schools (NCES district)
- District
- Milwaukee School District
- NCES district ID
- 5509600
- Math proficiency
- 10% ▼ -5.00%
- Reading proficiency
- 18% ▬ 0.00%
- Median HH income
- $36,339
- Composite
- 11.61/100
- National rank
- #9696
- State rank
- #337 of 342 in WI
Livability — Milwaukee
- Score
- 81/100
- State rank
- #55
- US rank
- #1534
Category grades
Schools grade is shown separately in the Schools card above.
Census & demographics
- Census place
- Milwaukee, WI
- County
- Milwaukee County · 926,379 people
- City population
- 573,768
- Metro
- Milwaukee-Waukesha, WI
- Population (ZIP)
- 24,663
- Household income
- $76,980
- Rent vs Own
- Severe rent burden
- 867.0
Population outlook (Milwaukee County) Hauer SSP2
- Today (2025)
- 995,758 people
- By 2030
- 1,009,124 · +1.3%
- By 2040
- 1,028,128 · +3.3%
- By 2050
- 1,040,066 · +4.4%
- By 2075
- 1,057,849 · +6.2%
- By 2100
- 1,039,774 · +4.4%
Race, ethnicity, and origin ACS 2023
- Neighborhood character
- Diverse neighborhood (Simpson 0.61)
- Race & ethnicity
- White 53% Black 33% Two or more races 9% Hispanic / Latino 6% Asian 2%
- Hispanic origin (detail)
- Mexican 3% Puerto Rican 2%
- Common ancestry
- Romanian 6% Portuguese 3% Lithuanian 2%
- Foreign-born
- 4% · Canada, China
- Languages at home
- 93% English-only · Spanish 3% German/W. Germanic 1% French/Haitian/Cajun 1%
Political lean MEDSL · Milwaukee
- 2024 margin
- Solid D (+38.5) · D 68.3% · R 29.8% · Other 1.8%
- 2008→2024 swing
- +2.7pp toward D · 2008: 35.9pp · 2024: 38.5pp
- All cycles
- 2024: D+38.5 2020: D+39.9 2016: D+37.5 2012: D+34.6 2008: D+35.9
Not yet ingested
- Civics
- —
Market trends
- HPI YoY
- ▼ -160.15%
- Current HPI
- 264.2798
- Rent YoY
- ▲ 2.85%
- Metro
- Milwaukee-Waukesha, WI
- State GDP YoY
- ▲ 2.10%
- F500 in state
- 20
Industry mix (Fortune 500 HQ in WI)
| Industry | F500 HQs | Revenue |
|---|---|---|
| Industrial Machinery | 4 | $23B |
|
||
| Industrial Technology | 2 | $36B |
|
||
| Insurance | 1 | $36B |
|
||
| Professional Services | 1 | $19B |
|
||
| Utilities | 1 | $9B |
|
||
| Consumer Goods | 1 | $3B |
|
||
Price history
-7.1% since first listed2 events — show timeline
- 2026-03-24 Price Changed $649,900 METROMLS
- 2026-02-01 Listed $699,900 METROMLS
Cash-flow waterfall
monthlySold comps — $/sqft
last 12 mo · ≤1 miLoading sold comps…