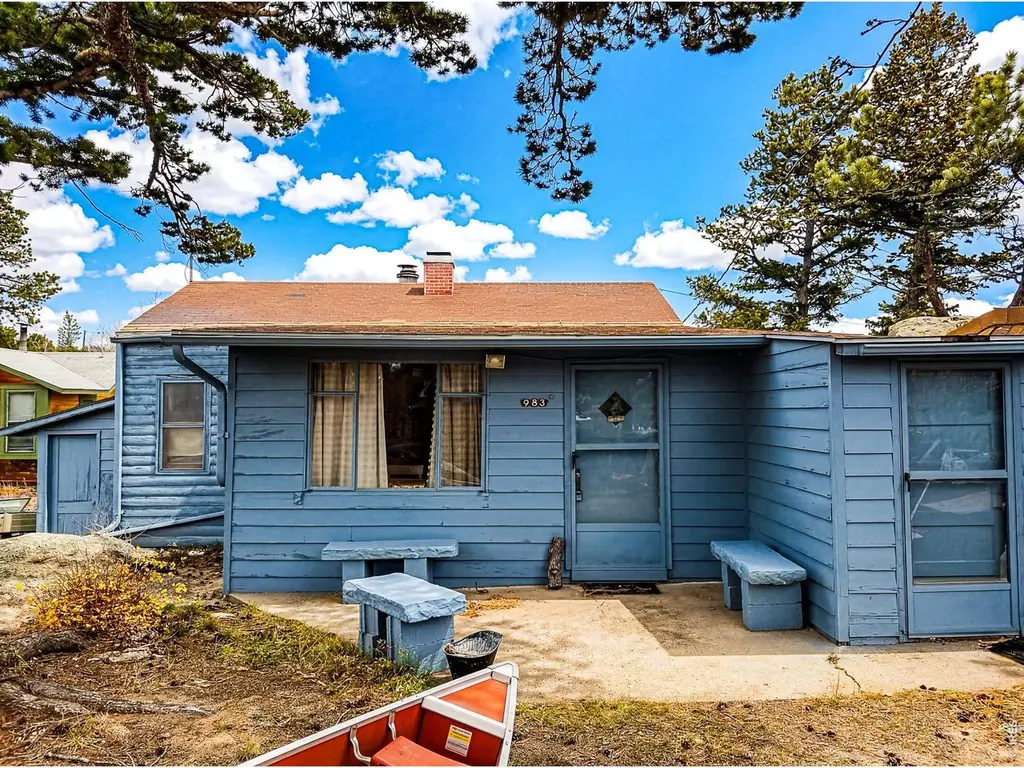
983 Ramona Dr · Red Feather Lakes, CO
Flood risk 1/10 · Minimal
- FEMA flood zone
- X (unshaded)
- Chance of flooding over 30 yrs
- 0.0%
- Est. flood insurance / yr
- $507 – $1,088
Fire risk 7/10 · Major
- Est. fire insurance / yr
- $939 – $1,743
Heat risk 1/10 · Minimal
- Hot days now (above 81°F)
- 5 days/yr
- Hot days in 30 yrs
- 12 days/yr
Wind risk 1/10 · Minimal
- Chance of severe wind over 30 yrs
- —
Air-quality risk 10/10 · Severe
- Unhealthy air days now
- 23 days/yr
- Unhealthy air days in 30 yrs
- 26 days/yr
Risk factors via First Street. Map © Google.
Why this score? — see what drove the B- grade
The composite is a weighted blend of 9 inputs, each scored 0–100. Each bar is that input's sub-score; the figure is the points it added to the 100-point composite (weight × sub-score).
- Cash flow +26.1/30.0
- DSCR +8.8/10.0
- ARV discount +8.3/15.0
- 1% rule +6.2/10.0
- Appreciation +4.7/10.0
- Schools +4.5/10.0
- Livability +2.8/5.0
- Rent growth +2.5/5.0
- Condition / age +2.5/5.0
$230,000
🖨 Deal sheet (PDF) 📄 Offer letter ✓ Due diligence
Listing remarks
Sweet little get-a-way cabin in the Village of Red Feather Lakes with lake and mountain views. Situated away from the road among tall pine and outstanding rock outcroppings. Needs some updating, but location & amenities are great. This cozy cabin, built in 1958, is reminiscent of days gone by & simpler times. The cabin is served by a private well, incinolet toilet, vaulted outhouse, propane heat and a wood stove. Mostly used as a seasonal cabin, it's a great place to re-wind & enjoy the surrounding National Forest & the Red Feather Lakes area. There is a large storeroom adjacent to the bathroom & also a second storage shed to store your tools & gear. It's
Key facts
- Wood stove
- Lake views
- Private well
Tags
Property features AI
Finance
- Other: Possible use: Single family
- HOA & community: No association fees or transfer fees
Exterior
- Parking: No garage; No designated parking features listed
- Utilities: Well water; No water rights; No water meter installed; Septic tank / septic vault; Electricity available; Propane (Schrader Propane); Wood/coal fuel option; Satellite available; High-speed internet available
- Home design: One-story cabin (residential); Main floor bedroom; Main floor bathroom; No stairs entry (accessible); Not new — previously owned; Open zoning
- Construction: Frame construction; Composition roof; Above-grade finished area
- Exterior features: Deck; Storage structure; Evergreen and deciduous trees; Native grass; Level to rolling terrain; Rock outcropping; Privately maintained road frontage up to county standards; Dirt road surface; Minimal flood risk (C rating)
Interior
- Kitchen: Gas range; Refrigerator; Microwave
- Bedrooms: 1 bedroom (main level)
- Bathrooms: One three-quarter bathroom (main level)
- Heating & cooling: Wood stove; Space heater; Two or more heat sources
- Interior features: Separate dining room; Window coverings; Fire alarm; Free-standing fireplace in the living room
- Laundry & utility: Some furniture included
Neighborhood map
What this means for you Summary
Snapshot
- This is a 2-bed/1.0-bath single-family listed at $230k.
Deal economics
- At list price, monthly cash flow is $582 ($7k/yr) — positive.
- The deal already cash-flows at list — no discount required.
- Meets the 1% rule at list price ($3k rent vs $230k).
- Recommended offer: $227k (1.5% below list) — sets the bar for market timing.
- Cap rate 9.3% vs local median 4.2% in Red Feather Lakes — top-decile yield for the area; either an underpriced asset or a hidden risk that comps aren't pricing in. Stress-test before assuming the spread holds.
Location & tenants
- Location reads 55/100 on livability (#344 in CO) — a working-class tenant base; expect higher turnover. Strengths: employment B+, housing B+; Watch: cost of living C-, crime D-, amenities F.
- Poudre School District R-1 (urban): math 45% / reading 60% proficiency, ranked #10 of 86 in CO (top 12%) — acceptable for families but not a draw, mixed tenant base, ~2y average lease.
- Zoned schools: Poudre High School (math 36% / reading 59%, grade D, #131 of 381 statewide, top 34%, 1,663 students, 38% FRL).
- Market conditions: 156 active listings in the ZIP; 1,786 units permitted in Larimer County in 2024 (402 in 5+ unit buildings).
Forward outlook
- In year one you build about $309 of equity ($2k loan paydown + $-1k appreciation (-0.6% local appreciation)).
- Larimer County population projected at +51% by 2050 — long-run rental-demand tailwind backs the buy-and-hold thesis.
- At projected returns (-0.6% appreciation + 3.0% rent growth), your $64k cash investment doubles in ~7 years — after that, you're playing with house money.
Negotiation context
- It's been on market 30 days — a 2% lower offer ($227k) is reasonable based on typical stale-listing flexibility.
- 8 sale attempts since 29y ago with the ask held roughly flat each time — persistent listings suggest the price (not the market) is what's stuck; bring a comps-based counter.
- Current owner paid $88k; list at $230k implies a 161% gain — meaningful room to come down on a strong offer.
Risks & watch-outs
- Watch-outs: built in 1958 — expect roof / HVAC / electrical / plumbing capex.
- Climate carrying-cost: major wildfire risk — expect insurance premiums to compound above CPI over the hold.
Questions for the listing agent
- Built in 1958 — when were the roof, HVAC, electrical panel, plumbing, and water heater last replaced?
- Is there a deadline driving the sale (1031 exchange, divorce, estate, relocation)? That informs how much negotiation room exists.
- Crime grade is D in this area — have there been break-ins, vandalism, or insurance claims at this property in the last 3 years? What carrier currently insures it and at what premium?
- What's the average days-on-market for RENTAL listings here right now (not sales)? A rising rental-DOM trend means longer vacancies and softer asking-rent achievability than the comps imply.
- What's the recent tenant-quality profile in this submarket — average credit score on applications, eviction rate, late-payment / NSF rate, and stable-employment percentage? A property-management company in the area should have these aggregated.
- How much new for-sale + rental construction is in the pipeline within 1–3 miles? Heavy new supply typically softens prices + rents 12–24 months out; constrained supply supports both.
Investment metrics
- 1% rule
- 1.12% ✓
- Cap rate
- 9.33%
- Cash-on-cash
- 10.84%
- DSCR
- 1.48
- GRM
- 7.5
CMA / ARV
- ARV (on-the-fly)
- $234,289
- Comps found
- 5
Show comp detail 5 sales within ~0.75 mi
| Address | Dist | Beds/Ba | Sqft | Sold | Price | $/sf | Match |
|---|---|---|---|---|---|---|---|
| 22 Yellow Wolf Way | 0.08mi | 2/— | 736 (+13%) | 10mo | $157,000 | $213 | 66 |
| 26 Yellow Wolf Way | 0.09mi | 1/— (-1) | 600 (-8%) | 21mo | $190,000 | $317 | 61 |
| 860 County Road 67j | 0.36mi | 2/1.0 | 720 (+11%) | 6mo | $260,000 | $361 | 60 |
| 123 Nokomis Rd | 0.45mi | 1/1.0 (-1) | 572 (-12%) | 10mo | $268,000 | $469 | 46 |
| 69 Lakeview Dr | 0.70mi | 2/1.0 | 564 (-13%) | 11mo | $275,000 | $488 | 36 |
Match score weights: distance 35% · size 25% · config 20% · recency 20%. Top-matched comps best support the ARV.
Projected returns pro-forma
-0.56% appreciation · 3.0% rent growth · sell at horizon
- IRR
- 8.2%
- Equity multiple
- 1.38×
- Total profit
- $24,326
- Equity at exit
- $60,453
- IRR
- 13.9%
- Equity multiple
- 2.43×
- Total profit
- $92,313
- Equity at exit
- $67,788
Cash invested: $64,400 (down + closing). Projections, not guarantees.
Landlord ↔ Tenant lean methodology
- Overall (STATE)
- 38 Tenant-Leaning
- State Colorado
- 38 Tenant-Leaning · D+4
- County
- — inherits STATE
- City
- — inherits STATE
ZIP-level market 80545
- Home prices YoY
- -0.2%
- Active inventory
- 156
- Price-to-rent
- 7.5×
Monthly cashflow live
- Estimated rent
- $2,567 medium interval (Pro) →
- Mortgage (P&I)
- −$1,206
- Tax from tax record
- −$145 /mo · $1,734/yr
- Insurance
- −$96
- HOA
- −$0
- Vacancy / Maint / Mgmt
- −$539
- Net cashflow
- $582
Break-even live
Sensitivity live
| Price | -10% $712 | -5% $647 | +0% $582 | +5% $517 | +10% $452 |
|---|---|---|---|---|---|
| Rent | -10% $379 | -5% $480 | +0% $582 | +5% $683 | +10% $785 |
| Rate | -1.0pp $698 | -0.5pp $640 | base $582 | +0.5pp $522 | +1.0pp $462 |
UW: 25.0% down · 7.5% · 30yr · 1.5% tax · 5.0% vac · 8.0% maint · 8.0% mgmt
Financing live
Cash to close
- Down payment
- $57,500
- Closing costs
- $6,900
- Reserves months
- —
- Total cash needed
- —
Loan-product check · same deal, 3 products live
Conventional
25% down · 7.5% · 30yr
- Down + closing
- —
- Monthly P&I
- —
- Monthly cashflow
- —
- DSCR
- —
- Eligible?
- —
Personal DTI + credit; lowest rate.
DSCR
20% down · 8.5% · 30yr
- Down + closing
- —
- Monthly P&I
- —
- Monthly cashflow
- —
- DSCR
- —
- Eligible?
- —
No personal income docs; deal must DSCR.
Hard money
10% down · 12.0% · 12mo
- Down + closing
- —
- Monthly P&I
- —
- Monthly cashflow
- —
- DSCR
- —
- Eligible?
- —
Short-term bridge; refi at stabilization.
Listing history 35 events
-
2026-06-21days on market $230,000 Active 30 DOM
-
2026-06-18days on market $230,000 Active 27 DOM
-
2026-06-17days on market $230,000 Active 26 DOM
-
2026-06-16days on market $230,000 Active 25 DOM
-
2026-06-15days on market $230,000 Active 24 DOM
-
2026-06-14days on market $230,000 Active 22 DOM
-
2026-06-10days on market $230,000 Active 19 DOM
-
2026-06-09days on market $230,000 Active 18 DOM
-
2026-06-08days on market $230,000 Active 17 DOM
-
2026-06-07days on market $230,000 Active 16 DOM
-
2026-06-03days on market $230,000 Active 12 DOM
-
2026-06-02days on market $230,000 Active 11 DOM
-
2026-06-01days on market $230,000 Active 10 DOM
-
2026-05-31days on market $230,000 Active 9 DOM
-
2026-05-30days on market $230,000 Active 8 DOM
-
2026-05-22$230,000 Active
-
2025-12-31historical
-
2025-10-31status Active
-
2025-10-08historical Active - Backup
-
2025-07-12$240,000 Active
-
2016-09-14historical
-
2016-08-22historical Active - Backup
-
2015-09-09price $115,000
-
2015-08-15$119,000 Active
-
2002-07-03soldstatus $88,000
-
2002-06-28soldstatus $88,000
-
2001-04-25$87,900
-
1999-09-23soldstatus $73,000
-
1999-04-14historical
-
1999-04-12$79,900
-
1999-04-12$89,900
-
1998-11-01soldstatus $69,000
-
1997-08-15soldstatus $59,000
-
1997-08-01soldstatus $59,000
-
1997-07-30$67,000
ⓘ Source: listings_history table (triggers on properties + properties_extension) + one-shot
backfill from property_details.listing_events for pre-trigger history.
Tax reassessment forecast CO · Resets to sale price
- Current annual tax
- $1,734 · $145/mo
- Projected year-2 tax
- $1,734 · $145/mo
- Expected delta
- $0/yr ($0/mo · 0.0%)
ⓘ Screening estimate from a state-policy table — verify with the county assessor before closing.
Climate risk First Street
- Flood 1/10 Low FEMA zone X (unshaded) · 0% chance over 30 yrs
- Wildfire 7/10 Severe
- Heat 1/10 Low 5 d/yr ≥81°F today · 12 d/yr by 30 yrs out
- Wind 1/10 Low
- Air quality 10/10 Extreme 23 unhealthy d/yr today · 26 by 30 yrs out
Nearby sold comps map
Loading sold comps map…
Walkable amenities ~0.75 mi
Loading nearby amenities…
Taxation est. · year 1
- Rental income
- $30,810
- − Mortgage interest
- −$12,884
- − Property taxes
- −$1,734
- − Insurance
- −$1,150
- − Repairs & maintenance
- −$2,465
- − Management
- −$2,465
- − Depreciation
- −$6,691
- Taxable income
- $3,421
- Est. tax owed @ 24.0%
- −$821
- After-tax cash flow
- $6,160/yr
For passive investors: Depreciation is non-cash, so a rental often shows a tax loss while cash-flowing — sheltering income. Rental losses are passive: they offset passive income freely, and up to $25,000/yr can offset ordinary (W-2) income if you actively participate and your MAGI is under $100k (phasing out to $0 by $150k); unused losses carry forward. On sale, claimed depreciation is recaptured at up to 25%, and gains may owe capital-gains tax (a 1031 exchange can defer both). Figures are a year-1 estimate at your 24.0% rate — not tax advice; consult a CPA.
Schools (NCES district)
- District
- Poudre School District R-1
- NCES district ID
- 0803990
- Math proficiency
- 45% ▼ -7.00%
- Reading proficiency
- 60% ▼ -2.00%
- Median HH income
- $57,281
- Composite
- 45.5/100
- National rank
- #2610
- State rank
- #10 of 86 in CO
Livability — Red Feather Lakes
- Score
- 55/100
- State rank
- #344
- US rank
- #23247
Category grades
Schools grade is shown separately in the Schools card above.
Census & demographics
- Census place
- Red Feather Lakes, CO
- Population (ZIP)
- 913
Population outlook (Larimer County) Hauer SSP2
- Today (2025)
- 415,361 people
- By 2030
- 457,762 · +10.2%
- By 2040
- 542,310 · +30.6%
- By 2050
- 627,048 · +51.0%
- By 2075
- 833,722 · +100.7%
- By 2100
- 952,590 · +129.3%
Race, ethnicity, and origin ACS 2023
- Neighborhood character
- Predominantly White (97%)
- Race & ethnicity
- White 97% Hispanic / Latino 3%
- Common ancestry
- Portuguese 3% Italian 2% Slovak 1%
- Languages at home
- 98% English-only · Spanish 2%
Political lean MEDSL · Larimer
- 2024 margin
- D (+17.6) · D 57.4% · R 39.8% · Other 2.9%
- 2008→2024 swing
- +7.9pp toward D · 2008: 9.7pp · 2024: 17.6pp
- All cycles
- 2024: D+17.6 2020: D+15.4 2016: D+4.9 2012: D+5.2 2008: D+9.7
Not yet ingested
- Civics
- —
Market trends
- HPI YoY
- ▼ -0.56%
- Current HPI
- 280.4591
- Rent YoY
- —
- Metro
- —
- State GDP YoY
- ▲ 1.95%
- F500 in state
- 14
Industry mix (Fortune 500 HQ in CO)
| Industry | F500 HQs | Revenue |
|---|---|---|
| Technology Distribution | 1 | $31B |
|
||
| Food / Agriculture | 1 | $18B |
|
||
| Packaging | 1 | $14B |
|
||
| Healthcare | 1 | $13B |
|
||
| Energy | 1 | $10B |
|
||
| Technology | 1 | $4B |
|
||
Price history
+243.3% since first listed20 events — show timeline
- 2026-05-22 Listed $230,000 IRES
- 2025-12-31 Listing Removed — IRES
- 2025-10-31 Relisted — IRES
- 2025-10-08 Contingent — IRES
- 2025-07-12 Listed $240,000 IRES
- 2016-09-14 Listing Removed — IRES
- 2016-08-22 Contingent — IRES
- 2015-09-09 Price Changed $115,000 IRES
- 2015-08-15 Listed $119,000 IRES
- 2002-07-03 Sold (Public Records) $88,000 Public Records
- 2002-06-28 Sold (MLS) $88,000 IRES
- 2001-04-25 Listed $87,900 IRES
- 1999-09-23 Sold (MLS) $73,000 IRES
- 1999-04-14 Listing Removed — IRES
- 1999-04-12 Listed $89,900 IRES
- 1999-04-12 Listed $79,900 IRES
- 1998-11-01 Sold (Public Records) $69,000 Public Records
- 1997-08-15 Sold (MLS) $59,000 IRES
- 1997-08-01 Sold (Public Records) $59,000 Public Records
- 1997-07-30 Listed $67,000 IRES
Property tax history
+6.0%/yrLatest (2025): $1,734 · +6.8% YoY. Source: county tax records.
Cash-flow waterfall
monthlySold comps — $/sqft
last 12 mo · ≤1 miLoading sold comps…