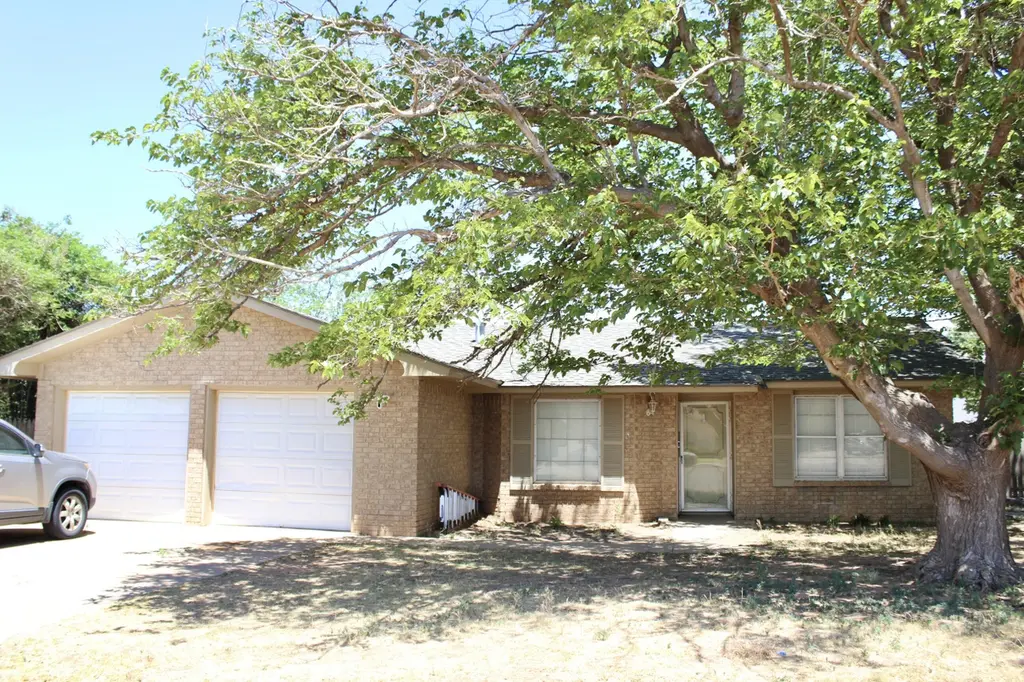
3705 Elmwood Ave · Lubbock, TX
Flood risk 1/10 · Minimal
- FEMA flood zone
- X (unshaded)
- Chance of flooding over 30 yrs
- 0.0%
- Est. flood insurance / yr
- $507 – $1,088
Fire risk 1/10 · Minimal
- Est. fire insurance / yr
- $1,222 – $2,270
Heat risk 5/10 · Moderate
- Hot days now (above 99°F)
- 7 days/yr
- Hot days in 30 yrs
- 21 days/yr
Wind risk 2/10 · Minimal
- Chance of severe wind over 30 yrs
- —
Air-quality risk 2/10 · Minimal
- Unhealthy air days now
- 1 days/yr
- Unhealthy air days in 30 yrs
- 1 days/yr
Risk factors via First Street. Map © Google.
Why this score? — see what drove the C grade
The composite is a weighted blend of 9 inputs, each scored 0–100. Each bar is that input's sub-score; the figure is the points it added to the 100-point composite (weight × sub-score).
- Cash flow +20.1/30.0
- ARV discount +15.0/15.0
- DSCR +6.4/10.0
- 1% rule +5.9/10.0
- Livability +4.0/5.0
- Schools +3.1/10.0
- Rent growth +2.5/5.0
- Condition / age +2.5/5.0
- Appreciation +0.0/10.0
$129,750
🖨 Deal sheet (PDF) 📄 Offer letter ✓ Due diligence
Listing remarks MLS
Great For First Time Buyers or Investors! Nice 3/2/2 with Isolated Master and Spacious Family Room with Brick Fireplace. Kitchen has Abundant Cabinetry and Counter Space. Dining Area in Kitchen. Microwave, Refrigerator, and Stove will Stay. A Great Plus is the Work Bench in Garage! New Garage Door Openers. Large Backyard and Covered Patio are Perfect for Relaxing and Entertaining!
Key facts
- Well-located area
- Generous backyard
- 8,272 sq ft lot
Tags
Property features AI
Exterior
- Parking: Attached 2-car garage; Driveway; Off-street parking
- Home design: Single-family residence; Single-story; Residential property
- Construction: Brick construction; Slab foundation; Composition roof; Built as a single-story home
- Exterior features: Private yard; Concrete road/driveway
Interior
- Bathrooms: 2 full bathrooms
- Heating & cooling: Central heating; Central air; Ceiling fans for supplemental cooling
- Interior features: Beamed ceilings; Vaulted ceilings; Entrance foyer; Ceiling fans; Storage; Wood-burning fireplace
Neighborhood map
What this means for you Summary
Snapshot
- This is a 3-bed/2.0-bath single-family listed at $130k.
Deal economics
- At list price, monthly cash flow is $162 ($2k/yr) — positive.
- The deal already cash-flows at list — no discount required.
- Meets the 1% rule at list price ($1k rent vs $130k).
Location & tenants
- Location reads 80/100 on livability (#37 in TX, #1,749 nationally) — a professional / high-income tenant draw. Strengths: commute A+, cost of living A+, housing A+; Watch: employment C-, crime F.
- Lubbock ISD (urban): math 36% / reading 39% proficiency, ranked #481 of 826 in TX (top 58%) — families likely to look elsewhere, expect single-tenant / working-renter base with shorter leases; 60% free/reduced lunch — lower-income household profile, screen leases tightly.
- Zoned schools: Hardwick El (math 47% / reading 42%, grade F, #1,155 of 4,322 statewide, top 29%, 574 students, 81% FRL); Mackenzie Middle (math 19% / reading 27%, grade F, #1,327 of 1,662 statewide, top 81%, 515 students, 88% FRL); Coronado H S (math 34% / reading 38%, grade F, #930 of 1,632 statewide, top 57%, 1,960 students, 66% FRL) — zoned schools average 78% FRL vs 60% district-wide (18 pts higher); higher-poverty schools than district average — tighter screening recommended.
- Market conditions: Rents soft (-0.1%/yr); 613 active listings in the ZIP; 40 comparable units currently listed for rent nearby; rentals at typical pace (median 23d on market — plan ~3-4 weeks tenant-placement turnaround); 42% of comp listings sitting > 30 days — soft ceiling on asking rent; 2,219 units permitted in Lubbock County in 2024 (252 in 5+ unit buildings).
Forward outlook
- Local home prices are declining (-3.0%/yr); year-one equity from $898 of loan paydown is wiped out by about $4k of value loss. Plan a longer hold.
- Lubbock County population projected at +39% by 2050 — long-run rental-demand tailwind backs the buy-and-hold thesis.
Negotiation context
- Only 6 days on market — expect competitive offers; lowballing is unlikely to land.
- 2 sale attempts since 8y ago with the ask held roughly flat each time — persistent listings suggest the price (not the market) is what's stuck; bring a comps-based counter.
Risks & watch-outs
- Climate carrying-cost: extreme-heat days projected 7→21/yr by 2055 (HVAC capex compounding) — expect insurance premiums to compound above CPI over the hold.
Questions for the listing agent
- Built in 1971 — when were the roof, HVAC, electrical panel, plumbing, and water heater last replaced?
- Is there a deadline driving the sale (1031 exchange, divorce, estate, relocation)? That informs how much negotiation room exists.
- Schools are D-rated, which usually means shorter tenancies and higher turnover. Who's the typical renter profile here, and what's been the actual vacancy rate?
- Crime grade is F in this area — have there been break-ins, vandalism, or insurance claims at this property in the last 3 years? What carrier currently insures it and at what premium?
- What's the average days-on-market for RENTAL listings here right now (not sales)? A rising rental-DOM trend means longer vacancies and softer asking-rent achievability than the comps imply.
- What's the recent tenant-quality profile in this submarket — average credit score on applications, eviction rate, late-payment / NSF rate, and stable-employment percentage? A property-management company in the area should have these aggregated.
- How much new for-sale + rental construction is in the pipeline within 1–3 miles? Heavy new supply typically softens prices + rents 12–24 months out; constrained supply supports both.
Investment metrics
- 1% rule
- 1.09% ✓
- Cap rate
- 7.79%
- Cash-on-cash
- 5.36%
- DSCR
- 1.24
- GRM
- 7.6
CMA / ARV
- ARV (on-the-fly)
- $163,982
- Comps found
- 1
Show comp detail 1 sale within ~0.75 mi
| Address | Dist | Beds/Ba | Sqft | Sold | Price | $/sf | Match |
|---|---|---|---|---|---|---|---|
| 5751 37th St | 0.24mi | 3/2.0 | 1,388 (+1%) | 17mo | $165,000 | $119 | 73 |
Match score weights: distance 35% · size 25% · config 20% · recency 20%. Top-matched comps best support the ARV.
Projected returns pro-forma
-3.0% appreciation · 0.0% rent growth · sell at horizon
- IRR
- -11.6%
- Equity multiple
- 0.59×
- Total profit
- $-14,793
- Equity at exit
- $19,346
- IRR
- -7.9%
- Equity multiple
- 0.58×
- Total profit
- $-15,407
- Equity at exit
- $11,218
Cash invested: $36,330 (down + closing). Projections, not guarantees.
Landlord ↔ Tenant lean methodology
- Overall (STATE)
- 87 Strongly Landlord-Friendly
- State Texas
- 87 Strongly Landlord-Friendly · R+5
- County
- — inherits STATE
- City
- — inherits STATE
ZIP-level market 79407
- Home prices YoY
- -16.3%
- Rents YoY
- -0.1%
- Active inventory
- 613
- Price-to-rent
- 7.6×
Monthly cashflow live
- Estimated rent
- $1,419 high interval (Pro) →
- Mortgage (P&I)
- −$680
- Tax from tax record
- −$224 /mo · $2,692/yr
- Insurance
- −$54
- HOA
- −$0
- Vacancy / Maint / Mgmt
- −$298
- Net cashflow
- $162
Break-even live
Sensitivity live
| Price | -10% $236 | -5% $199 | +0% $162 | +5% $125 | +10% $89 |
|---|---|---|---|---|---|
| Rent | -10% $50 | -5% $106 | +0% $162 | +5% $218 | +10% $274 |
| Rate | -1.0pp $228 | -0.5pp $195 | base $162 | +0.5pp $129 | +1.0pp $94 |
UW: 25.0% down · 7.5% · 30yr · 1.5% tax · 5.0% vac · 8.0% maint · 8.0% mgmt
Financing live
Cash to close
- Down payment
- $32,438
- Closing costs
- $3,892
- Reserves months
- —
- Total cash needed
- —
Loan-product check · same deal, 3 products live
Conventional
25% down · 7.5% · 30yr
- Down + closing
- —
- Monthly P&I
- —
- Monthly cashflow
- —
- DSCR
- —
- Eligible?
- —
Personal DTI + credit; lowest rate.
DSCR
20% down · 8.5% · 30yr
- Down + closing
- —
- Monthly P&I
- —
- Monthly cashflow
- —
- DSCR
- —
- Eligible?
- —
No personal income docs; deal must DSCR.
Hard money
10% down · 12.0% · 12mo
- Down + closing
- —
- Monthly P&I
- —
- Monthly cashflow
- —
- DSCR
- —
- Eligible?
- —
Short-term bridge; refi at stabilization.
Rent comps 40 comps
| Address | Beds | Baths | Sqft | Rent | $/sqft | DOM | Units | Dist |
|---|---|---|---|---|---|---|---|---|
| 3705 Elkhart Ave Lubbock, TX | 4.0 | 2.0 | 1507 | $1,650 | $1.09 | 23d | 1 | 0.05mi |
| 5604 38th St Lubbock, TX | 3.0 | 2.0 | 1442 | $1,400 | $0.97 | 23d | 1 | 0.15mi |
| 5724 36th St Lubbock, TX | 4.0 | 2.0 | 1696 | $1,600 | $0.94 | 46d | 1 | 0.16mi |
| 5416 36th St Lubbock, TX | 3.0 | 2.0 | 1375 | $1,295 | $0.94 | 46d | 1 | 0.27mi |
| 5433 40th St Unit A Lubbock, TX | 2.0 | 1.5 | 978 | $800 | $0.82 | 46d | 1 | 0.32mi |
| 5406 36th St Lubbock, TX | 3.0 | 2.0 | 1400 | $695 | $0.50 | 46d | 1 | 0.33mi |
| 5415 42nd St Lubbock, TX | 3.0 | 2.0 | 1417 | $1,450 | $1.02 | 23d | 1 | 0.48mi |
| 3201 W Loop 289 Lubbock, TX | 1.0–2.0 | 1.0–2.0 | 771 | $1,095 | $1.42 | 46d | 1 | 0.51mi |
| 5318 39th St Lubbock, TX | 3.0 | 2.0 | 1736 | $1,375 | $0.79 | 15d | 1 | 0.53mi |
| 5306 38th St Lubbock, TX | 2.0 | 1.0 | 922 | $825 | $0.89 | 46d | 1 | 0.61mi |
| 5304 38th St Lubbock, TX | 2.0 | 1.0 | 922 | $825 | $0.89 | 46d | 1 | 0.62mi |
| 5220 41st St Lubbock, TX | 3.0 | 2.0 | 1536 | $1,400 | $0.91 | 23d | 1 | 0.63mi |
| 5214 38th St Lubbock, TX | 2.0 | 1.0 | 922 | $825 | $0.89 | 46d | 1 | 0.64mi |
| 5702 50th St Lubbock, TX | 1.0–3.0 | 1.0–2.0 | 809 | $1,069 | $1.32 | 15d | 27 | 0.67mi |
| 5440 48th St Lubbock, TX | 4.0 | 3.0 | 1720 | $1,750 | $1.02 | 15d | 1 | 0.67mi |
| 2702 Frankford Ave Lubbock, TX | 2.0 | 1.0 | 940 | $888 | $0.94 | 46d | 1 | 0.70mi |
| 6104 37th St Unit A Lubbock, TX | 2.0 | 1.5 | 950 | $780 | $0.82 | 46d | 1 | 0.75mi |
| 6108 37th St Unit B Lubbock, TX | 2.0 | 1.5 | 894 | $799 | $0.89 | 46d | 1 | 0.78mi |
| 6110 36th St Unit 7 Lubbock, TX | 2.0 | 1.5 | 1636 | $1,100 | $0.67 | 23d | 1 | 0.82mi |
| 5501 50th St Lubbock, TX | 1.0–3.0 | 1.0–2.0 | 1125 | $1,549 | $1.38 | 15d | 7 | 0.85mi |
| 5302 48th St Lubbock, TX | 3.0 | 2.0 | 1368 | $1,450 | $1.06 | 23d | 1 | 0.85mi |
| 5024 35th St Lubbock, TX | 3.0 | 2.0 | 1364 | $1,300 | $0.95 | 23d | 1 | 0.88mi |
| 5401 50th St Lubbock, TX | 1.0–3.0 | 1.0–2.0 | 1018 | $1,099 | $1.08 | 15d | 11 | 0.89mi |
| 4705 Albany Ave Lubbock, TX | 2.0 | 2.0 | 926 | $742 | $0.80 | 15d | 5 | 0.90mi |
| 5001 Chicago Ave Lubbock, TX | 1.0–2.0 | 1.0–2.0 | 715 | $1,019 | $1.43 | 15d | 15 | 0.90mi |
| 5407 24th St Lubbock, TX | 3.0 | 2.0 | 1208 | $1,150 | $0.95 | 15d | 1 | 0.93mi |
| 5101 44th St Lubbock, TX | 3.0 | 2.0 | 1160 | $1,350 | $1.16 | 23d | 1 | 0.93mi |
| 5204 50th St Lubbock, TX | 2.0–3.0 | 2.0 | 1050 | $1,150 | $1.10 | 15d | 2 | 0.94mi |
| 5202 Bangor Ave Lubbock, TX | 2.0 | 1.5 | 1080 | $987 | $0.91 | 15d | 11 | 0.96mi |
| 5003 35th St Lubbock, TX | 3.0 | 2.0 | 1501 | $1,550 | $1.03 | 15d | 1 | 0.97mi |
| 5017 46th St Lubbock, TX | 3.0 | 2.0 | 1753 | $1,600 | $0.91 | 46d | 1 | 1.02mi |
| 4907 37th St Lubbock, TX | 3.0 | 1.0 | 1000 | $1,100 | $1.10 | 46d | 1 | 1.06mi |
| 4907 36th St Lubbock, TX | 2.0 | 1.0 | 1020 | $1,095 | $1.07 | 15d | 1 | 1.07mi |
| 5550 56th St Lubbock, TX | 1.0–3.0 | 1.0–2.0 | 958 | $1,260 | $1.31 | 15d | 21 | 1.08mi |
| 4907 41st St Lubbock, TX | 3.0 | 2.0 | 1196 | $1,200 | $1.00 | 46d | 1 | 1.08mi |
| 5402 22nd St Lubbock, TX | 2.0 | 1.0 | 1234 | $1,050 | $0.85 | 46d | 1 | 1.09mi |
| 5002 46th St Lubbock, TX | 3.0 | 2.0 | 1369 | $1,450 | $1.06 | 46d | 1 | 1.09mi |
| 5117 Albany Ave Lubbock, TX | 3.0 | 2.0 | 1558 | $1,500 | $0.96 | 46d | 1 | 1.09mi |
| 4916 46th St Lubbock, TX | 3.0 | 2.0 | 1377 | $1,450 | $1.05 | 15d | 1 | 1.13mi |
| 4817 40th St Lubbock, TX | 3.0 | 2.0 | 1254 | $1,300 | $1.04 | 15d | 1 | 1.13mi |
Listing history 9 events
-
2026-05-15$129,750 Active
-
2018-04-18soldstatus 385-char remark
Show marketing remark (385 chars)
Great For First Time Buyers or Investors! Nice 3/2/2 with Isolated Master and Spacious Family Room with Brick Fireplace. Kitchen has Abundant Cabinetry and Counter Space. Dining Area in Kitchen. Microwave, Refrigerator, and Stove will Stay. A Great Plus is the Work Bench in Garage! New Garage Door Openers. Large Backyard and Covered Patio are Perfect for Relaxing and Entertaining!
-
2018-04-18soldstatus
Show marketing remark (385 chars)
Great For First Time Buyers or Investors! Nice 3/2/2 with Isolated Master and Spacious Family Room with Brick Fireplace. Kitchen has Abundant Cabinetry and Counter Space. Dining Area in Kitchen. Microwave, Refrigerator, and Stove will Stay. A Great Plus is the Work Bench in Garage! New Garage Door Openers. Large Backyard and Covered Patio are Perfect for Relaxing and Entertaining!
-
2018-02-26$110,000 385-char remark
Show marketing remark (385 chars)
Great For First Time Buyers or Investors! Nice 3/2/2 with Isolated Master and Spacious Family Room with Brick Fireplace. Kitchen has Abundant Cabinetry and Counter Space. Dining Area in Kitchen. Microwave, Refrigerator, and Stove will Stay. A Great Plus is the Work Bench in Garage! New Garage Door Openers. Large Backyard and Covered Patio are Perfect for Relaxing and Entertaining!
-
2016-04-04soldstatus
-
2016-04-04soldstatus
-
2001-07-03soldstatus
-
1985-08-01soldstatus
-
1983-07-01soldstatus
ⓘ Source: listings_history table (triggers on properties + properties_extension) + one-shot
backfill from property_details.listing_events for pre-trigger history.
Tax reassessment forecast TX · Resets to sale price
- Current annual tax
- $2,692 · $224/mo
- Projected year-2 tax
- $2,692 · $224/mo
- Expected delta
- $0/yr ($0/mo · 0.0%)
ⓘ Screening estimate from a state-policy table — verify with the county assessor before closing.
Climate risk First Street
- Flood 1/10 Low FEMA zone X (unshaded) · 0% chance over 30 yrs
- Wildfire 1/10 Low
- Heat 5/10 Major 7 d/yr ≥99°F today · 21 d/yr by 30 yrs out
- Wind 2/10 Low
- Air quality 2/10 Low 1 unhealthy d/yr today · 1 by 30 yrs out
Nearby sold comps map
Loading sold comps map…
Walkable amenities ~0.75 mi
Loading nearby amenities…
Taxation est. · year 1
- Rental income
- $17,028
- − Mortgage interest
- −$7,268
- − Property taxes
- −$2,692
- − Insurance
- −$649
- − Repairs & maintenance
- −$1,362
- − Management
- −$1,362
- − Depreciation
- −$3,775
- Taxable loss
- −$80
- Est. tax savings @ 24.0%
- +$19
- After-tax cash flow
- $1,966/yr
For passive investors: Depreciation is non-cash, so a rental often shows a tax loss while cash-flowing — sheltering income. Rental losses are passive: they offset passive income freely, and up to $25,000/yr can offset ordinary (W-2) income if you actively participate and your MAGI is under $100k (phasing out to $0 by $150k); unused losses carry forward. On sale, claimed depreciation is recaptured at up to 25%, and gains may owe capital-gains tax (a 1031 exchange can defer both). Figures are a year-1 estimate at your 24.0% rate — not tax advice; consult a CPA.
Schools (NCES district)
- District
- Lubbock ISD
- NCES district ID
- 4828500
- Math proficiency
- 36% ▼ -8.00%
- Reading proficiency
- 39% ▼ -1.00%
- Median HH income
- $39,820
- Composite
- 31.44/100
- National rank
- #5984
- State rank
- #481 of 826 in TX
Livability — Lubbock
- Score
- 80/100
- State rank
- #37
- US rank
- #1749
Category grades
Schools grade is shown separately in the Schools card above.
Census & demographics
- Census place
- Lubbock, TX
- County
- Lubbock County · 293,542 people
- City population
- 283,030
- Metro
- Lubbock, TX
- Population (ZIP)
- 24,000
- Household income
- $61,509
- Rent vs Own
- Severe rent burden
- 1914.0
Population outlook (Lubbock County) Hauer SSP2
- Today (2025)
- 345,960 people
- By 2030
- 371,449 · +7.4%
- By 2040
- 424,539 · +22.7%
- By 2050
- 481,150 · +39.1%
- By 2075
- 633,467 · +83.1%
- By 2100
- 746,853 · +115.9%
Race, ethnicity, and origin ACS 2023
- Neighborhood character
- Diverse neighborhood (Simpson 0.56)
- Race & ethnicity
- White 58% Hispanic / Latino 31% Two or more races 17% Black 4% Asian 3%
- Hispanic origin (detail)
- Mexican 27%
- Common ancestry
- Italian 2% Lithuanian 1% Slovak 1%
- Foreign-born
- 5% · Canada, South Korea, China
- Languages at home
- 83% English-only · Spanish 13% Other Asian/Pacific 1% Chinese 1%
Political lean MEDSL · Lubbock
- 2024 margin
- Solid R (+39.5) · D 29.7% · R 69.2% · Other 1.0%
- 2008→2024 swing
- -2.8pp toward R · 2008: -36.7pp · 2024: -39.5pp
- All cycles
- 2024: R+39.5 2020: R+32.2 2016: R+38.4 2012: R+40.9 2008: R+36.7
Not yet ingested
- Civics
- —
Market trends
- HPI YoY
- ▼ -44.87%
- Current HPI
- 229.9895
- Rent YoY
- ▼ -0.07%
- Metro
- Lubbock, TX
- State GDP YoY
- ▲ 3.95%
- F500 in state
- 110
Industry mix (Fortune 500 HQ in TX)
| Industry | F500 HQs | Revenue |
|---|---|---|
| Energy | 16 | $1,198B |
|
||
| Technology | 5 | $198B |
|
||
| Engineering / Construction | 4 | $72B |
|
||
| Energy Services | 3 | $60B |
|
||
| Utilities | 3 | $41B |
|
||
| Healthcare | 2 | $330B |
|
||
Price history
+18.0% since first listed10 events — show timeline
- 2026-05-27 Pending — LARMLS
- 2026-05-15 Listed $129,750 LARMLS
- 2018-04-18 Sold (Public Records) — Public Records
- 2018-04-18 Sold (MLS) — LARMLS
- 2018-02-26 Listed $110,000 LARMLS
- 2016-04-04 Sold (Public Records) — Public Records
- 2016-04-04 Sold (Public Records) — Public Records
- 2001-07-03 Sold (Public Records) — Public Records
- 1985-08-01 Sold (Public Records) — Public Records
- 1983-07-01 Sold (Public Records) — Public Records
Property tax history
+4.0%/yrLatest (2025): $2,692 · -5.1% YoY. Source: county tax records.
Cash-flow waterfall
monthlySold comps — $/sqft
last 12 mo · ≤1 miLoading sold comps…