95 S Maple St · Andrews, IN
Flood risk 1/10 · Minimal
- FEMA flood zone
- X (unshaded)
- Chance of flooding over 30 yrs
- 0.0%
- Est. flood insurance / yr
- $473 – $860
Fire risk 1/10 · Minimal
- Est. fire insurance / yr
- $717 – $1,331
Heat risk 3/10 · Minor
- Hot days now (above 101°F)
- 7 days/yr
- Hot days in 30 yrs
- 17 days/yr
Wind risk 2/10 · Minimal
- Chance of severe wind over 30 yrs
- —
Air-quality risk 3/10 · Minor
- Unhealthy air days now
- 1 days/yr
- Unhealthy air days in 30 yrs
- 3 days/yr
Risk factors via First Street. Map © Google.
Why this score? — see what drove the C+ grade
The composite is a weighted blend of 9 inputs, each scored 0–100. Each bar is that input's sub-score; the figure is the points it added to the 100-point composite (weight × sub-score).
- Cash flow +26.6/30.0
- DSCR +9.1/10.0
- Appreciation +7.7/10.0
- 1% rule +6.3/10.0
- Livability +3.3/5.0
- Schools +3.1/10.0
- Rent growth +2.5/5.0
- Condition / age +2.5/5.0
- ARV discount +0.0/15.0
$119,000
🖨 Deal sheet (PDF) 📄 Offer letter ✓ Due diligence
Listing remarks MLS
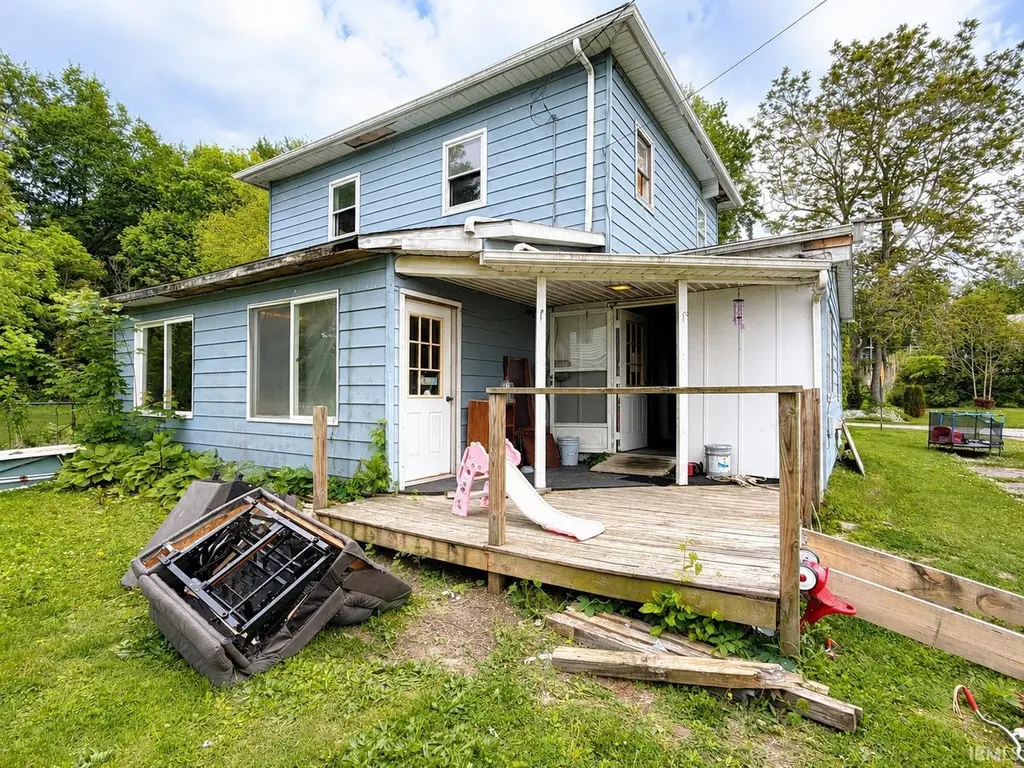
Great Potential in this fixer upper 4 plus bedroom 2 bath home with attached two car garage on a corner lot has a lot of possibilities. Aluminum siding, updated kitchen, and a flexible floor plan. This home needs a handy person that can go through this house and make repairs/corrections as needed to bring it up to standards or someone with vision to take this house to the next level! The home has good bones and it looks like in the this had been a showpiece at one time. The garage is ideal for those mechanics/crafts/ or trades people as this space could be utilized to possibly run a home business or shop. So much potential here! Room sizes and all other information are approximate, Owner has never lived in home has no information on the home/ no disclosures. Sold As/IS, Cash offers only. Listing Agent does seller representation only, please contact the real estate agent of your choice for a showing.
Key facts
- New furnace
- New walls
- Newer roof
Tags
Property features AI
Exterior
- Parking: Attached 2-car garage
- Utilities: Public water; Public sewer
- Home design: Single-family site-built home; Two stories
- Construction: Vinyl siding
- Exterior features: Lot approximately 63 x 132 (0.19 acres)
Interior
- Kitchen: Dishwasher; Refrigerator; Electric cooktop; Double oven
- Bathrooms: Two full bathrooms; One main-level bathroom
- Heating & cooling: Forced air heating; No central air
- Interior features: Partial basement; 7 total rooms
- Laundry & utility: Washer; Dryer; Laundry on main level
Neighborhood map
What this means for you Summary
Snapshot
- This is a 4-bed/1.0-bath single-family listed at $119k.
Deal economics
- At list price, monthly cash flow is $318 ($4k/yr) — positive.
- The deal already cash-flows at list — no discount required.
- Meets the 1% rule at list price ($1k rent vs $119k).
Location & tenants
- Location reads 66/100 on livability (#274 in IN) — a middle-class / working-renter tenant base. Strengths: crime A+, cost of living A+, housing A+; Watch: health & safety C-, employment D+, amenities F.
- Huntington County Community School Corporation (rural): math 34% / reading 39% proficiency, ranked #176 of 301 in IN (top 58%) — families likely to look elsewhere, expect single-tenant / working-renter base with shorter leases.
- Zoned schools: Andrews Elementary School (math 47% / reading 37%, grade F, #434 of 994 statewide, top 48%, 316 students, 45% FRL); Riverview School (math 29% / reading 40%, grade F, #167 of 330 statewide, top 52%, 503 students, 54% FRL); Huntington North High School (math 30% / reading 55%, grade F, #195 of 369 statewide, top 53%, 1,424 students, 42% FRL).
- Market conditions: 9 active listings in the ZIP; 79 units permitted in Huntington County in 2024 (0 in 5+ unit buildings).
Forward outlook
- In year one you build about $7k of equity ($823 loan paydown + $6k appreciation (5.4% local appreciation)).
- Huntington County population projected at -14% by 2050 — secular population decline; favor cash flow + early exit over multi-decade hold.
- At projected returns (5.4% appreciation + 3.0% rent growth), your $33k cash investment doubles in ~3 years — after that, you're playing with house money.
- By year 5, paydown + projected appreciation supports a ~$32k cash-out refi (75% LTV) — recoverable capital for the next deal without selling this one.
Negotiation context
- Only 1 days on market — expect competitive offers; lowballing is unlikely to land.
- 2 sale attempts since 2y ago with the ask held roughly flat each time — persistent listings suggest the price (not the market) is what's stuck; bring a comps-based counter.
- Current owner paid $25k; list at $119k implies a 378% gain — meaningful room to come down on a strong offer.
Risks & watch-outs
- Watch-outs: built in 1939 — expect roof / HVAC / electrical / plumbing capex.
Questions for the listing agent
- Built in 1939 — when were the roof, HVAC, electrical panel, plumbing, and water heater last replaced?
- Is there a deadline driving the sale (1031 exchange, divorce, estate, relocation)? That informs how much negotiation room exists.
- Schools are D-rated, which usually means shorter tenancies and higher turnover. Who's the typical renter profile here, and what's been the actual vacancy rate?
- What's the average days-on-market for RENTAL listings here right now (not sales)? A rising rental-DOM trend means longer vacancies and softer asking-rent achievability than the comps imply.
- What's the recent tenant-quality profile in this submarket — average credit score on applications, eviction rate, late-payment / NSF rate, and stable-employment percentage? A property-management company in the area should have these aggregated.
- How much new for-sale + rental construction is in the pipeline within 1–3 miles? Heavy new supply typically softens prices + rents 12–24 months out; constrained supply supports both.
Investment metrics
- 1% rule
- 1.13% ✓
- Cap rate
- 9.50%
- Cash-on-cash
- 11.46%
- DSCR
- 1.51
- GRM
- 7.4
CMA / ARV
- ARV (on-the-fly)
- $98,230
- Comps found
- 5
Show comp detail 5 sales within ~0.75 mi
| Address | Dist | Beds/Ba | Sqft | Sold | Price | $/sf | Match |
|---|---|---|---|---|---|---|---|
| 95 S Maple St | 0.00mi | 4/2.0 | 2,090 (0%) | 23mo | $24,900 | $12 | 76 |
| 482 E Jefferson St | 0.11mi | 3/2.0 (-1) | 2,026 (-3%) | 11mo | $145,000 | $72 | 72 |
| 330 W Mckeever St | 0.44mi | 3/1.0 (-1) | 2,070 (-1%) | 4mo | $187,500 | $91 | 69 |
| 68 S Jackson St | 0.09mi | 3/2.0 (-1) | 1,920 (-8%) | 16mo | $90,000 | $47 | 60 |
| 885 N Market St | 0.61mi | 4/1.5 | 1,788 (-14%) | 8mo | $30,000 | $17 | 39 |
Match score weights: distance 35% · size 25% · config 20% · recency 20%. Top-matched comps best support the ARV.
Projected returns pro-forma
5.41% appreciation · 3.0% rent growth · sell at horizon
- IRR
- 23.6%
- Equity multiple
- 2.51×
- Total profit
- $50,447
- Equity at exit
- $70,399
- IRR
- 22.7%
- Equity multiple
- 5.01×
- Total profit
- $133,711
- Equity at exit
- $124,024
Cash invested: $33,320 (down + closing). Projections, not guarantees.
Landlord ↔ Tenant lean methodology
- Overall (STATE)
- 90 Strongly Landlord-Friendly
- State Indiana
- 90 Strongly Landlord-Friendly · R+11
- County
- — inherits STATE
- City
- — inherits STATE
ZIP-level market 46702
- Home prices YoY
- 2.4%
- Active inventory
- 9
- Price-to-rent
- 7.4×
Monthly cashflow live
- Estimated rent
- $1,342 medium interval (Pro) →
- Mortgage (P&I)
- −$624
- Tax from tax record
- −$68 /mo · $818/yr
- Insurance
- −$50
- HOA
- −$0
- Vacancy / Maint / Mgmt
- −$282
- Net cashflow
- $318
Break-even live
Sensitivity live
| Price | -10% $386 | -5% $352 | +0% $318 | +5% $284 | +10% $251 |
|---|---|---|---|---|---|
| Rent | -10% $212 | -5% $265 | +0% $318 | +5% $371 | +10% $424 |
| Rate | -1.0pp $378 | -0.5pp $348 | base $318 | +0.5pp $287 | +1.0pp $256 |
UW: 25.0% down · 7.5% · 30yr · 1.5% tax · 5.0% vac · 8.0% maint · 8.0% mgmt
Financing live
Cash to close
- Down payment
- $29,750
- Closing costs
- $3,570
- Reserves months
- —
- Total cash needed
- —
Loan-product check · same deal, 3 products live
Conventional
25% down · 7.5% · 30yr
- Down + closing
- —
- Monthly P&I
- —
- Monthly cashflow
- —
- DSCR
- —
- Eligible?
- —
Personal DTI + credit; lowest rate.
DSCR
20% down · 8.5% · 30yr
- Down + closing
- —
- Monthly P&I
- —
- Monthly cashflow
- —
- DSCR
- —
- Eligible?
- —
No personal income docs; deal must DSCR.
Hard money
10% down · 12.0% · 12mo
- Down + closing
- —
- Monthly P&I
- —
- Monthly cashflow
- —
- DSCR
- —
- Eligible?
- —
Short-term bridge; refi at stabilization.
Listing history 2 events
-
2026-06-05remarks 484-char remark
-
2026-06-05$119,000 Active 1 DOM
ⓘ Source: listings_history table (triggers on properties + properties_extension) + one-shot
backfill from property_details.listing_events for pre-trigger history.
Tax reassessment forecast IN · Partial reset (capped growth)
- Current annual tax
- $818 · $68/mo
- Projected year-2 tax
- $915 · $76/mo
- Expected delta
- +$97/yr (+$8/mo · 11.8%)
ⓘ Screening estimate from a state-policy table — verify with the county assessor before closing.
Climate risk First Street
- Flood 1/10 Low FEMA zone X (unshaded) · 0% chance over 30 yrs
- Wildfire 1/10 Low
- Heat 3/10 Moderate 7 d/yr ≥101°F today · 17 d/yr by 30 yrs out
- Wind 2/10 Low
- Air quality 3/10 Moderate 1 unhealthy d/yr today · 3 by 30 yrs out
Nearby sold comps map
Loading sold comps map…
Walkable amenities ~0.75 mi
Loading nearby amenities…
Taxation est. · year 1
- Rental income
- $16,100
- − Mortgage interest
- −$6,666
- − Property taxes
- −$818
- − Insurance
- −$595
- − Repairs & maintenance
- −$1,288
- − Management
- −$1,288
- − Depreciation
- −$3,462
- Taxable income
- $1,984
- Est. tax owed @ 24.0%
- −$476
- After-tax cash flow
- $3,342/yr
For passive investors: Depreciation is non-cash, so a rental often shows a tax loss while cash-flowing — sheltering income. Rental losses are passive: they offset passive income freely, and up to $25,000/yr can offset ordinary (W-2) income if you actively participate and your MAGI is under $100k (phasing out to $0 by $150k); unused losses carry forward. On sale, claimed depreciation is recaptured at up to 25%, and gains may owe capital-gains tax (a 1031 exchange can defer both). Figures are a year-1 estimate at your 24.0% rate — not tax advice; consult a CPA.
Schools (NCES district)
- District
- Huntington County Community School Corporation
- NCES district ID
- 1804710
- Math proficiency
- 34% ▼ -6.00%
- Reading proficiency
- 39% ▼ -10.00%
- Median HH income
- $47,010
- Composite
- 31.29/100
- National rank
- #6013
- State rank
- #176 of 301 in IN
Livability — Andrews
- Score
- 66/100
- State rank
- #274
- US rank
- #11452
Category grades
Schools grade is shown separately in the Schools card above.
Census & demographics
- Census place
- Andrews, IN
- Population (ZIP)
- 1,955
Population outlook (Huntington County) Hauer SSP2
- Today (2025)
- 35,613 people
- By 2030
- 34,759 · -2.4%
- By 2040
- 32,682 · -8.2%
- By 2050
- 30,495 · -14.4%
- By 2075
- 26,298 · -26.2%
- By 2100
- 22,653 · -36.4%
Race, ethnicity, and origin ACS 2023
- Neighborhood character
- Predominantly White (93%)
- Race & ethnicity
- White 93% Two or more races 5% Hispanic / Latino 4% Native American 1%
- Common ancestry
- Lithuanian 3% Portuguese 1% Slovak 1%
- Foreign-born
- 2% · Canada, South Korea
- Languages at home
- 99% English-only · Korean 1%
Political lean MEDSL · Huntington
- 2024 margin
- Solid R (+48.4) · D 24.9% · R 73.3% · Other 1.8%
- 2008→2024 swing
- -21.2pp toward R · 2008: -27.2pp · 2024: -48.4pp
- All cycles
- 2024: R+48.4 2020: R+49.9 2016: R+51.0 2012: R+39.8 2008: R+27.2
Not yet ingested
- Civics
- —
Market trends
- HPI YoY
- ▲ 5.41%
- Current HPI
- 229.3828
- Rent YoY
- —
- Metro
- —
- State GDP YoY
- ▲ 2.90%
- F500 in state
- 18
Industry mix (Fortune 500 HQ in IN)
| Industry | F500 HQs | Revenue |
|---|---|---|
| Industrial Machinery | 2 | $37B |
|
||
| Healthcare | 1 | $177B |
|
||
| Pharmaceuticals | 1 | $45B |
|
||
| Metals / Steel | 1 | $18B |
|
||
| Agriculture | 1 | $17B |
|
||
| Packaging | 1 | $12B |
|
||
Price history
+147.9% since first listed9 events — show timeline
- 2026-06-04 Listed $119,000 IRMLS
- 2024-07-10 Sold (MLS) $24,900 IRMLS
- 2024-06-20 Pending — IRMLS
- 2024-06-08 Price Changed $24,900 IRMLS
- 2024-05-22 Price Changed $27,500 IRMLS
- 2024-05-12 Price Changed $29,200 IRMLS
- 2024-05-08 Price Changed $33,200 IRMLS
- 2024-04-21 Price Changed $43,200 IRMLS
- 2024-03-12 Listed $48,000 IRMLS
Property tax history
-10.2%/yrLatest (2024): $818 · -49.6% YoY. Source: county tax records.
Cash-flow waterfall
monthlySold comps — $/sqft
last 12 mo · ≤1 miLoading sold comps…