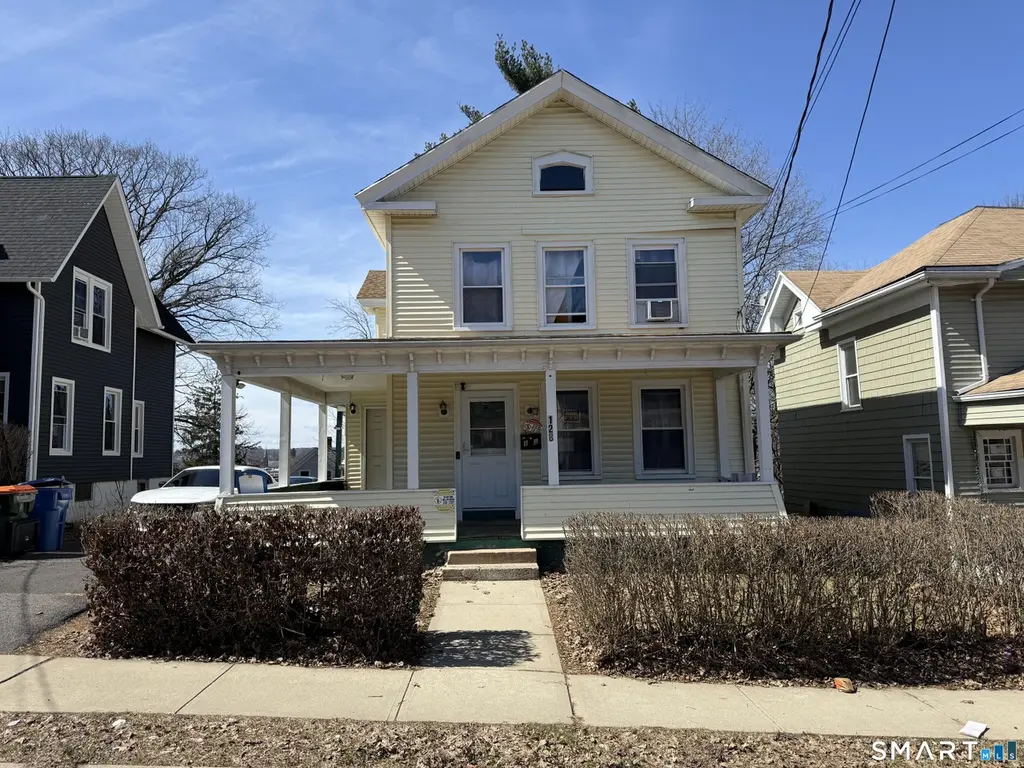
128 Hobart St · Meriden, CT
Flood risk 1/10 · Minimal
- FEMA flood zone
- X (unshaded)
- Chance of flooding over 30 yrs
- 0.0%
- Est. flood insurance / yr
- $473 – $860
Fire risk 1/10 · Minimal
- Est. fire insurance / yr
- $829 – $1,539
Heat risk 6/10 · Moderate
- Hot days now (above 98°F)
- 7 days/yr
- Hot days in 30 yrs
- 17 days/yr
Wind risk 6/10 · Moderate
- Chance of severe wind over 30 yrs
- 27.0%
Air-quality risk 4/10 · Minor
- Unhealthy air days now
- 3 days/yr
- Unhealthy air days in 30 yrs
- 5 days/yr
Risk factors via First Street. Map © Google.
Why this score? — see what drove the D grade
The composite is a weighted blend of 9 inputs, each scored 0–100. Each bar is that input's sub-score; the figure is the points it added to the 100-point composite (weight × sub-score).
- Cash flow +12.7/30.0
- ARV discount +11.1/15.0
- Livability +4.2/5.0
- DSCR +3.8/10.0
- 1% rule +3.4/10.0
- Schools +3.0/10.0
- Rent growth +2.9/5.0
- Condition / age +2.5/5.0
- Appreciation +0.0/10.0
$299,000
🖨 Deal sheet (PDF) 📄 Offer letter ✓ Due diligence
Listing remarks MLS
Bring your vision and unlock the potential in this 4-bedroom, 2 full bathroom Colonial located in a convenient Meriden location. Offering a flexible layout and generous living space, this home is ready for its next owner to make it their own. Whether you're looking for a primary residence or an investment opportunity, there is plenty of upside here for the right buyer. Conveniently situated close to shopping, restaurants, highways, and everyday amenities, this property presents a great opportunity to build equity and create something special.
Key facts
- 6,534 sq ft lot
- Built 1890
- Listed 82 days
Neighborhood map
What this means for you Summary
Snapshot
- This is a 4-bed/2.0-bath single-family listed at $299k.
Deal economics
- At list price, monthly cash flow is $-33 ($-390/yr) — negative.
- To cash-flow at today's rent, offer at most $293k (1.9% below list).
- To meet the 1% rule (rent ≥ 1% of price), the offer needs to be $251k (16.0% below list).
- Recommended offer: $251k (16.0% below list) — sets the bar for 1% rule.
- Cap rate 6.2% vs local median 4.0% in Meriden — top-decile yield for the area; either an underpriced asset or a hidden risk that comps aren't pricing in. Stress-test before assuming the spread holds.
Location & tenants
- Location reads 85/100 on livability (#4 in CT, #505 nationally) — a professional / high-income tenant draw. Strengths: amenities A+, housing A+, health & safety A+.
- Meriden School District (suburban): math 27% / reading 41% proficiency, ranked #116 of 153 in CT (top 76%) — families likely to look elsewhere, expect single-tenant / working-renter base with shorter leases; 61% free/reduced lunch — lower-income household profile, screen leases tightly.
- Zoned schools: Roger Sherman School (math 25% / reading 40%, grade F, #358 of 553 statewide, top 65%, 475 students, 84% FRL); Washington Middle School (math 31% / reading 42%, grade F, #118 of 175 statewide, top 68%, 622 students, 81% FRL); Francis T. Maloney High School (math 20% / reading 45%, grade F, #125 of 194 statewide, top 66%, 1,264 students, 71% FRL) — zoned schools average 78% FRL vs 61% district-wide (18 pts higher); higher-poverty schools than district average — tighter screening recommended.
- Market conditions: Rents rising (+1.6%/yr); 102 active listings in the ZIP; 10 comparable units currently listed for rent nearby; rentals at typical pace (median 26d on market — plan ~3-4 weeks tenant-placement turnaround); 1,059 units permitted in South Central Connecticut Planning Region in 2024 (779 in 5+ unit buildings).
- This rent runs 42% of the median local income ($71k/yr) — at the standard rent-burdened threshold; future hikes will face affordability resistance.
Forward outlook
- Local home prices are declining (-3.0%/yr); year-one equity from $2k of loan paydown is wiped out by about $9k of value loss. Plan a longer hold.
Negotiation context
- It's been on market 82 days — a 6% lower offer ($281k) is reasonable based on typical stale-listing flexibility.
- 7 sale attempts since 23y ago; this cycle's ask has dropped $20k (6%) from the opening price — seller is motivated, your offer sets the floor, not the list.
- Current owner paid $85k; list at $299k implies a 252% gain — meaningful room to come down on a strong offer.
Risks & watch-outs
- Watch-outs: built in 1890 — expect roof / HVAC / electrical / plumbing capex.
- Climate carrying-cost: major wind risk, 27% chance of damaging wind over 30y; extreme-heat days projected 7→17/yr by 2055 (HVAC capex compounding) — expect insurance premiums to compound above CPI over the hold.
Questions for the listing agent
- What do current leases actually rent for vs. the listed asking? Can we see a recent rent roll and the last 12 months of T-12 income?
- It's been on market 82 days. Have you received any prior offers? Is the seller open to a 16% concession, seller financing, or rate buy-down credit?
- Built in 1890 — when were the roof, HVAC, electrical panel, plumbing, and water heater last replaced?
- Why hasn't it sold? Are there any deal-killer items the seller is aware of (foundation, flood, title, zoning, code violations)?
- Is there a deadline driving the sale (1031 exchange, divorce, estate, relocation)? That informs how much negotiation room exists.
- The area grade is low — what's the realistic commute time and amenity access for the typical tenant pool here? Any planned neighborhood developments (good or bad) we should know about?
- What's the average days-on-market for RENTAL listings here right now (not sales)? A rising rental-DOM trend means longer vacancies and softer asking-rent achievability than the comps imply.
- What's the recent tenant-quality profile in this submarket — average credit score on applications, eviction rate, late-payment / NSF rate, and stable-employment percentage? A property-management company in the area should have these aggregated.
- How much new for-sale + rental construction is in the pipeline within 1–3 miles? Heavy new supply typically softens prices + rents 12–24 months out; constrained supply supports both.
Investment metrics
- 1% rule
- 0.84% ✗
- Cap rate
- 6.16%
- Cash-on-cash
- -0.47%
- DSCR
- 0.98
- GRM
- 9.9
CMA / ARV
- ARV (median comp)
- $325,250
- List price
- $299,000
- Delta
- -8.07%
- Verdict
- FAIR
- Comps
- 20 within 1.0 mi
Show comp detail 12 sales within ~0.75 mi
| Address | Dist | Beds/Ba | Sqft | Sold | Price | $/sf | Match |
|---|---|---|---|---|---|---|---|
| 760 Broad St | 0.15mi | 3/1.5 (-1) | 1,664 (-8%) | 5mo | $240,000 | $144 | 68 |
| 15 Collins Pkwy | 0.45mi | 4/2.0 | 1,755 (-3%) | 11mo | $355,500 | $203 | 65 |
| 30 Pearl St | 0.57mi | 3/1.5 (-1) | 1,701 (-6%) | 4mo | $320,000 | $188 | 52 |
| 272 Murray St | 0.59mi | 3/2.0 (-1) | 1,927 (+6%) | 7mo | $370,000 | $192 | 51 |
| 57 Broadview Ter | 0.19mi | 3/1.5 (-1) | 1,559 (-14%) | 16mo | $245,100 | $157 | 48 |
| 192 Converse Ave | 0.70mi | 3/2.0 (-1) | 1,922 (+6%) | 8mo | $275,000 | $143 | 46 |
| 51 Hillcrest Ter | 0.63mi | 4/2.5 | 1,585 (-13%) | 6mo | $408,000 | $257 | 42 |
| 35 Parkside Ter | 0.47mi | 3/1.5 (-1) | 1,602 (-12%) | 13mo | $345,000 | $215 | 40 |
| 32 Cottage St | 0.40mi | 3/1.5 (-1) | 1,545 (-15%) | 13mo | $341,000 | $221 | 39 |
| 29 Putnam St | 0.64mi | 3/2.0 (-1) | 1,660 (-8%) | 14mo | $347,000 | $209 | 39 |
| 48 Clinton St | 0.63mi | 5/3.0 (+1) | 1,688 (-7%) | 14mo | $400,000 | $237 | 38 |
| 60 Putnam St | 0.68mi | 3/1.0 (-1) | 1,680 (-7%) | 16mo | $253,000 | $151 | 34 |
Match score weights: distance 35% · size 25% · config 20% · recency 20%. Top-matched comps best support the ARV.
Projected returns pro-forma
-3.0% appreciation · 1.65% rent growth · sell at horizon
- IRR
- -18.6%
- Equity multiple
- 0.36×
- Total profit
- $-53,881
- Equity at exit
- $44,582
- IRR
- -13.8%
- Equity multiple
- 0.25×
- Total profit
- $-62,996
- Equity at exit
- $25,852
Cash invested: $83,720 (down + closing). Projections, not guarantees.
Landlord ↔ Tenant lean methodology
- Overall (STATE)
- 27 Tenant-Leaning
- State Connecticut
- 27 Tenant-Leaning · D+7
- County
- — inherits STATE
- City
- — inherits STATE
ZIP-level market 06450
- Rents YoY
- 1.6%
- Active inventory
- 102
- Price-to-rent
- 9.9×
Monthly cashflow live
- Estimated rent
- $2,510 high interval (Pro) →
- Mortgage (P&I)
- −$1,568
- Tax from tax record
- −$323 /mo · $3,879/yr
- Insurance
- −$125
- HOA
- −$0
- Lot rent
- −$0
- Vacancy / Maint / Mgmt
- −$527
- Net cashflow
- $-33
Break-even live
Sensitivity live
| Price | -10% $137 | -5% $52 | +0% $-33 | +5% $-117 | +10% $-202 |
|---|---|---|---|---|---|
| Rent | -10% $-231 | -5% $-132 | +0% $-33 | +5% $67 | +10% $166 |
| Rate | -1.0pp $118 | -0.5pp $44 | base $-33 | +0.5pp $-110 | +1.0pp $-189 |
UW: 25.0% down · 7.5% · 30yr · 1.5% tax · 5.0% vac · 8.0% maint · 8.0% mgmt
Financing live
Cash to close
- Down payment
- $74,750
- Closing costs
- $8,970
- Reserves months
- —
- Total cash needed
- —
Loan-product check · same deal, 3 products live
Conventional
25% down · 7.5% · 30yr
- Down + closing
- —
- Monthly P&I
- —
- Monthly cashflow
- —
- DSCR
- —
- Eligible?
- —
Personal DTI + credit; lowest rate.
DSCR
20% down · 8.5% · 30yr
- Down + closing
- —
- Monthly P&I
- —
- Monthly cashflow
- —
- DSCR
- —
- Eligible?
- —
No personal income docs; deal must DSCR.
Hard money
10% down · 12.0% · 12mo
- Down + closing
- —
- Monthly P&I
- —
- Monthly cashflow
- —
- DSCR
- —
- Eligible?
- —
Short-term bridge; refi at stabilization.
Rent comps 10 comps
| Address | Beds | Baths | Sqft | Rent | $/sqft | DOM | Units | Dist |
|---|---|---|---|---|---|---|---|---|
| 55 Liberty St Meriden, CT | 5.0 | 3.0 | 2215 | $2,900 | $1.31 | 5d | 1 | 0.37mi |
| 75 Wilcox Ave Meriden, CT | 4.0 | 1.0 | 1763 | $2,350 | $1.33 | 46d | 1 | 0.69mi |
| 1 Barristers Ct Unit 2nd Flr Meriden, CT | 3.0 | 1.0 | 1512 | $2,200 | $1.46 | 25d | 1 | 0.70mi |
| 120 Wilcox Ave Unit 2 Meriden, CT | 3.0 | 1.0 | 1250 | $2,000 | $1.60 | 13d | 1 | 0.76mi |
| 48 Prospect St Unit 1st floor Meriden, CT | 3.0 | 1.0 | 2292 | $2,000 | $0.87 | 25d | 1 | 0.81mi |
| 39 N Spring St Unit 2 Meriden, CT | 3.0 | 1.0 | 1650 | $2,400 | $1.45 | 46d | 1 | 0.97mi |
| 31 Winthrop St Meriden, CT | 4.0 | 2.0 | 1550 | $2,400 | $1.55 | 5d | 1 | 1.21mi |
| 58 Leonard St #204 Meriden, CT | 4.0 | 3.5 | 2535 | $3,500 | $1.38 | 46d | 1 | 1.30mi |
| 25 Amity St Meriden, CT | 3.0 | 1.5 | 1776 | $2,500 | $1.41 | 25d | 1 | 1.36mi |
| 11 Nutmeg Dr Meriden, CT | 2.0–3.0 | 1.5–2.5 | 1600 | $2,600 | $1.62 | 0d | 4 | 1.44mi |
Listing history 31 events
-
2026-06-22days on market $299,000 Active 82 DOM
-
2026-06-18days on market $299,000 Active 79 DOM
-
2026-06-17days on market $299,000 Active 78 DOM
-
2026-06-16days on market $299,000 Active 77 DOM
-
2026-06-15days on market $299,000 Active 76 DOM
-
2026-06-14days on market $299,000 Active 74 DOM
-
2026-06-10days on market $299,000 Active 71 DOM
-
2026-06-09days on market $299,000 Active 70 DOM
-
2026-06-08days on market $299,000 Active 69 DOM
-
2026-06-07days on market $299,000 Active 68 DOM
-
2026-06-05days on market $299,000 Active 65 DOM
-
2026-06-03days on market $299,000 Active 64 DOM
-
2026-06-03days on market $299,000 Active 63 DOM
-
2026-06-01days on market $299,000 Active 62 DOM
-
2026-05-31days on market $299,000 Active 61 DOM
-
2026-03-31$319,000 Active 548-char remark
Show marketing remark (548 chars)
Bring your vision and unlock the potential in this 4-bedroom, 2 full bathroom Colonial located in a convenient Meriden location. Offering a flexible layout and generous living space, this home is ready for its next owner to make it their own. Whether you're looking for a primary residence or an investment opportunity, there is plenty of upside here for the right buyer. Conveniently situated close to shopping, restaurants, highways, and everyday amenities, this property presents a great opportunity to build equity and create something special.
-
2016-12-30soldstatus $85,000 206-char remark
Show marketing remark (206 chars)
Lovely Colonial with 4 Bedrooms, 2 Full bathroom in great shape! Newer roof, siding, windows, kitchen, baths, boiler. Spacious rooms, high ceilings perfect for owner occupant or investor to rent right away!
-
2016-12-13historical 206-char remark
Show marketing remark (206 chars)
Lovely Colonial with 4 Bedrooms, 2 Full bathroom in great shape! Newer roof, siding, windows, kitchen, baths, boiler. Spacious rooms, high ceilings perfect for owner occupant or investor to rent right away!
-
2016-12-01$79,900 206-char remark
Show marketing remark (206 chars)
Lovely Colonial with 4 Bedrooms, 2 Full bathroom in great shape! Newer roof, siding, windows, kitchen, baths, boiler. Spacious rooms, high ceilings perfect for owner occupant or investor to rent right away!
-
2016-11-12historical
-
2016-07-13$89,900
-
2015-06-12historical
-
2014-08-22$99,900
-
2008-03-31historical
-
2007-11-21$159,900
-
2007-11-06historical
-
2007-07-06$159,900
-
2004-03-01soldstatus $124,000
-
2004-03-01soldstatus $124,000
-
2004-02-27soldstatus $125,000
-
2003-09-23$124,999
ⓘ Source: listings_history table (triggers on properties + properties_extension) + one-shot
backfill from property_details.listing_events for pre-trigger history.
Tax reassessment forecast CT · Partial reset (capped growth)
- Current annual tax
- $3,879 · $323/mo
- Projected year-2 tax
- $5,139 · $428/mo
- Expected delta
- +$1,260/yr (+$105/mo · 32.5%)
ⓘ Screening estimate from a state-policy table — verify with the county assessor before closing.
Climate risk First Street
- Flood 1/10 Low FEMA zone X (unshaded) · 0% chance over 30 yrs
- Wildfire 1/10 Low
- Heat 6/10 Major 7 d/yr ≥98°F today · 17 d/yr by 30 yrs out
- Wind 6/10 Major 27% chance of damaging wind over 30 yrs
- Air quality 4/10 Moderate 3 unhealthy d/yr today · 5 by 30 yrs out
Nearby sold comps map
Loading sold comps map…
Walkable amenities ~0.75 mi
Loading nearby amenities…
Taxation est. · year 1
- Rental income
- $30,126
- − Mortgage interest
- −$16,749
- − Property taxes
- −$3,879
- − Insurance
- −$1,495
- − Repairs & maintenance
- −$2,410
- − Management
- −$2,410
- − Depreciation
- −$8,698
- Taxable loss
- −$5,515
- Est. tax savings @ 24.0%
- +$1,324
- After-tax cash flow
- $933/yr
For passive investors: Depreciation is non-cash, so a rental often shows a tax loss while cash-flowing — sheltering income. Rental losses are passive: they offset passive income freely, and up to $25,000/yr can offset ordinary (W-2) income if you actively participate and your MAGI is under $100k (phasing out to $0 by $150k); unused losses carry forward. On sale, claimed depreciation is recaptured at up to 25%, and gains may owe capital-gains tax (a 1031 exchange can defer both). Figures are a year-1 estimate at your 24.0% rate — not tax advice; consult a CPA.
Schools (NCES district)
- District
- Meriden School District
- NCES district ID
- 0902400
- Math proficiency
- 27% ▼ -8.00%
- Reading proficiency
- 41% ▼ -6.00%
- Median HH income
- $53,883
- Composite
- 29.84/100
- National rank
- #6413
- State rank
- #116 of 153 in CT
Livability — Meriden
- Score
- 85/100
- State rank
- #4
- US rank
- #505
Category grades
Schools grade is shown separately in the Schools card above.
Census & demographics
- Census place
- Meriden, CT
- County
- New Haven County · 688,236 people
- City population
- 60,545
- Metro
- New Haven-Milford, CT
- Population (ZIP)
- 35,694
- Household income
- $71,250
- Rent vs Own
- Severe rent burden
- 1516.0
Population outlook (South Central Connecticut County) Hauer SSP2
- By 2040
- 608,362
Race, ethnicity, and origin ACS 2023
- Neighborhood character
- Diverse neighborhood (Simpson 0.60)
- Race & ethnicity
- White 51% Hispanic / Latino 36% Two or more races 16% Black 7% Asian 3%
- Hispanic origin (detail)
- Mexican 6% Puerto Rican 23% Dominican 3%
- Common ancestry
- Romanian 8% Lithuanian 4% Scotch-Irish 2%
- Foreign-born
- 10% · Canada, China, South Korea
- Languages at home
- 70% English-only · Spanish 25% Russian/Polish/Slavic 1% Other Indo-European 1%
Political lean MEDSL · South Central Connecticut
- 2024 margin
- Strong D (+20.1) · D 59.0% · R 38.9% · Other 2.1%
- All cycles
- 2024: D+20.1
Not yet ingested
- Civics
- —
Market trends
- HPI YoY
- ▼ -154.37%
- Current HPI
- 263.7288
- Rent YoY
- ▲ 1.65%
- Metro
- New Haven-Milford, CT
- State GDP YoY
- ▲ 1.06%
- F500 in state
- 38
Industry mix (Fortune 500 HQ in CT)
| Industry | F500 HQs | Revenue |
|---|---|---|
| Industrial Machinery | 4 | $38B |
|
||
| Insurance | 3 | $71B |
|
||
| Financial Services | 2 | $25B |
|
||
| Transportation / Logistics | 2 | $18B |
|
||
| Healthcare | 1 | $247B |
|
||
| Telecommunications | 1 | $55B |
|
||
Price history
+155.2% since first listed16 events — show timeline
- 2026-03-31 Listed $319,000 Smart MLS
- 2016-12-30 Sold (MLS) $85,000 Smart MLS
- 2016-12-13 Listing Removed — Smart MLS
- 2016-12-01 Listed $79,900 Smart MLS
- 2016-11-12 Listing Removed — Smart MLS
- 2016-07-13 Listed $89,900 Smart MLS
- 2015-06-12 Listing Removed — Smart MLS
- 2014-08-22 Listed $99,900 Smart MLS
- 2008-03-31 Listing Removed — Smart MLS
- 2007-11-21 Listed $159,900 Smart MLS
- 2007-11-06 Listing Removed — Smart MLS
- 2007-07-06 Listed $159,900 Smart MLS
- 2004-03-01 Sold (Public Records) $124,000 Public Records
- 2004-03-01 Sold (Public Records) $124,000 Public Records
- 2004-02-27 Sold (MLS) $125,000 Smart MLS
- 2003-09-23 Listed $124,999 Smart MLS
Property tax history
-1.5%/yrLatest (2023): $3,879 · +6.0% YoY. Source: county tax records.
Cash-flow waterfall
monthlySold comps — $/sqft
last 12 mo · ≤1 miLoading sold comps…