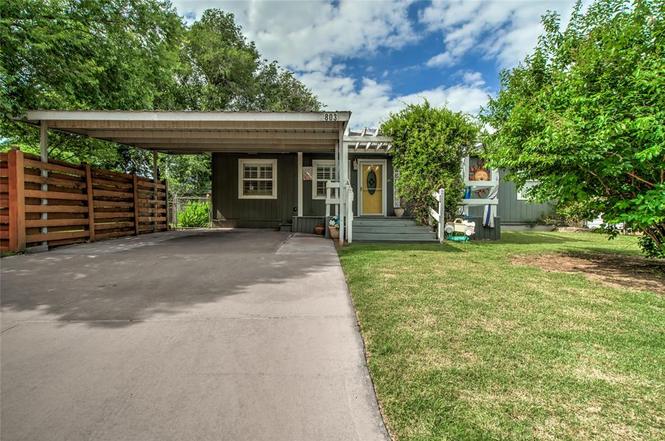
803 E Mosier St · Norman, OK
Flood risk 1/10 · Minimal
- FEMA flood zone
- X (unshaded)
- Chance of flooding over 30 yrs
- 0.0%
- Est. flood insurance / yr
- $507 – $1,088
Fire risk 4/10 · Minor
- Est. fire insurance / yr
- $2,463 – $4,575
Heat risk 6/10 · Moderate
- Hot days now (above 108°F)
- 7 days/yr
- Hot days in 30 yrs
- 19 days/yr
Wind risk 3/10 · Minor
- Chance of severe wind over 30 yrs
- 5.0%
Air-quality risk 2/10 · Minimal
- Unhealthy air days now
- 1 days/yr
- Unhealthy air days in 30 yrs
- 1 days/yr
Risk factors via First Street. Map © Google.
Why this score? — see what drove the D- grade
The composite is a weighted blend of 9 inputs, each scored 0–100. Each bar is that input's sub-score; the figure is the points it added to the 100-point composite (weight × sub-score).
- Cash flow +13.9/30.0
- ARV discount +5.3/15.0
- DSCR +4.2/10.0
- Livability +4.2/5.0
- Rent growth +3.2/5.0
- 1% rule +2.7/10.0
- Schools +2.6/10.0
- Condition / age +2.5/5.0
- Appreciation +0.0/10.0
$175,000
🖨 Deal sheet (PDF) 📄 Offer letter ✓ Due diligence
Listing remarks
This Charming Home is filled with character and a lot of upgraded features! The charm starts as you pull up to the home and see the front porch where you can sit and enjoy a nice cup of coffee! The home has a LARGE living area that has been opened up and a good size dining room with built in pantry and storage areas! The Kitchen features newer cabinet roll outs, under cabinet lighting and subway tile backsplash. The Back Room is a Flexible space with large laundry attached, and a full bathroom with designer tile, and a beautiful clawfoot bathtub! The Master Bedroom has Large Wall Width Closets, and Built In Bookcases and cabinets. Bedroom #2 is large with Ceiling Fan and across the hall fro
Key facts
- Large laundry
- Front porch
- Clawfoot bathtub
Tags
Property features AI
Finance
- Other: Homestead exemption indicated
- Financial info: Listing qualifies for financing; Acceptable listing terms: Cash, Conventional, FHA or VA
- HOA & community: No mandatory association dues
Exterior
- Parking: Concrete parking
- Security: Security system; Smoke alarm
- Utilities: Cable available; Electricity available; Natural gas available; High-speed internet available; Public utilities
- Home design: Single-family residence; One level; South-facing; Residential property; Existing construction
- Construction: Frame construction; Composition roof (replaced/updated 2021); Double-pane windows; Conventional foundation; Built as existing home
- Exterior features: Covered deck; Covered porch; Open deck; Open patio; Outbuildings; Wood fencing; Interior lot
Interior
- Kitchen: Dishwasher; Disposal; Microwave; Electric range/oven; Water heater
- Bedrooms: 3 bedrooms
- Flooring: Carpet; Tile
- Bathrooms: 2 full bathrooms
- Heating & cooling: Other heating; Other cooling
- Interior features: Ceiling fans; Window treatments; In-law / flexible floor plan; Security system; Smoke alarm
- Laundry & utility: Inside utility
Neighborhood map
What this means for you Summary
Snapshot
- This is a 3-bed/1.0-bath single-family listed at $175k.
Deal economics
- At list price, monthly cash flow is $19 ($229/yr) — positive.
- The deal already cash-flows at list — no discount required.
- To meet the 1% rule (rent ≥ 1% of price), the offer needs to be $136k (22.6% below list).
- Recommended offer: $136k (22.6% below list) — sets the bar for 1% rule.
- Cap rate 6.4% vs local median 3.6% in Norman — top-decile yield for the area; either an underpriced asset or a hidden risk that comps aren't pricing in. Stress-test before assuming the spread holds.
Location & tenants
- Location reads 85/100 on livability (#1 in OK, #557 nationally) — a professional / high-income tenant draw. Strengths: amenities A+, commute A+, cost of living A+.
- Norman (suburban): math 27% / reading 32% proficiency, ranked #61 of 270 in OK (top 23%) — low school quality limits family demand, transient renter base, plan for 1-2y turnover.
- Zoned schools: Jefferson Es (math 32% / reading 32%, grade F, #213 of 845 statewide, top 28%, 368 students, 0% FRL); Longfellow Ms (math 18% / reading 27%, grade F, #122 of 345 statewide, top 37%, 709 students, 0% FRL); Norman North Hs (math 45% / reading 57%, grade D+, #2 of 447 statewide, top 0%, 2,401 students, 0% FRL) — zoned schools average 0% FRL vs 39% district-wide (39 pts lower); this property's tenant base skews higher-income than the district average.
- Market conditions: Rents rising (+2.8%/yr); 356 active listings in the ZIP; 38 comparable units currently listed for rent nearby; rentals at typical pace (median 16d on market — plan ~3-4 weeks tenant-placement turnaround); 592 units permitted in Cleveland County in 2024 (12 in 5+ unit buildings).
Forward outlook
- Local home prices are declining (-3.0%/yr); year-one equity from $1k of loan paydown is wiped out by about $5k of value loss. Plan a longer hold.
- Cleveland County population projected at +40% by 2050 — long-run rental-demand tailwind backs the buy-and-hold thesis.
Negotiation context
- Only 2 days on market — expect competitive offers; lowballing is unlikely to land.
Risks & watch-outs
- Watch-outs: built in 1954 — expect roof / HVAC / electrical / plumbing capex.
- Climate carrying-cost: extreme-heat days projected 7→19/yr by 2055 (HVAC capex compounding) — expect insurance premiums to compound above CPI over the hold.
Questions for the listing agent
- Built in 1954 — when were the roof, HVAC, electrical panel, plumbing, and water heater last replaced?
- Is there a deadline driving the sale (1031 exchange, divorce, estate, relocation)? That informs how much negotiation room exists.
- The area grade is low — what's the realistic commute time and amenity access for the typical tenant pool here? Any planned neighborhood developments (good or bad) we should know about?
- What's the average days-on-market for RENTAL listings here right now (not sales)? A rising rental-DOM trend means longer vacancies and softer asking-rent achievability than the comps imply.
- What's the recent tenant-quality profile in this submarket — average credit score on applications, eviction rate, late-payment / NSF rate, and stable-employment percentage? A property-management company in the area should have these aggregated.
- How much new for-sale + rental construction is in the pipeline within 1–3 miles? Heavy new supply typically softens prices + rents 12–24 months out; constrained supply supports both.
Investment metrics
- 1% rule
- 0.77% ✗
- Cap rate
- 6.42%
- Cash-on-cash
- 0.47%
- DSCR
- 1.02
- GRM
- 10.8
CMA / ARV
- ARV (on-the-fly)
- $166,704
- Comps found
- 12
Show comp detail 12 sales within ~0.75 mi
| Address | Dist | Beds/Ba | Sqft | Sold | Price | $/sf | Match |
|---|---|---|---|---|---|---|---|
| 808 N Cockrel Ave | 0.04mi | 3/1.0 | 1,015 (-8%) | 2mo | $153,000 | $151 | 83 |
| 415 E Frank St | 0.43mi | 3/1.0 | 1,088 (-1%) | 1mo | $180,500 | $166 | 77 |
| 109 E Hayes St | 0.63mi | 3/1.0 | 1,091 (-1%) | 1mo | $162,000 | $148 | 68 |
| 212 E Haddock | 0.54mi | 2/1.0 (-1) | 1,116 (+1%) | 2mo | $170,000 | $152 | 66 |
| 821 Oliver St | 0.11mi | 3/1.0 | 952 (-14%) | 9mo | $115,000 | $121 | 65 |
| 809 Oliver St | 0.06mi | 4/2.0 (+1) | 1,260 (+14%) | 2mo | $169,900 | $135 | 62 |
| 1608 N Crawford Ave | 0.63mi | 3/1.5 | 1,098 (-0%) | 8mo | $100,000 | $91 | 61 |
| 100 W Haddock St | 0.72mi | 3/1.5 | 1,206 (+9%) | 0mo | $182,500 | $151 | 49 |
| 213 E Haddock St | 0.56mi | 2/1.0 (-1) | 1,193 (+8%) | 8mo | $170,000 | $142 | 49 |
| 1017 N Peters Ave | 0.58mi | 3/1.0 | 952 (-14%) | 10mo | $176,500 | $185 | 42 |
| 425 E Gray St | 0.59mi | 3/1.0 | 940 (-15%) | 10mo | $65,000 | $69 | 40 |
| 907 E Eufaula St | 0.63mi | 2/2.0 (-1) | 938 (-15%) | 7mo | $150,000 | $160 | 31 |
Match score weights: distance 35% · size 25% · config 20% · recency 20%. Top-matched comps best support the ARV.
Projected returns pro-forma
-3.0% appreciation · 2.8% rent growth · sell at horizon
- IRR
- -15.8%
- Equity multiple
- 0.44×
- Total profit
- $-27,492
- Equity at exit
- $26,093
- IRR
- -7.8%
- Equity multiple
- 0.51×
- Total profit
- $-23,799
- Equity at exit
- $15,131
Cash invested: $49,000 (down + closing). Projections, not guarantees.
Landlord ↔ Tenant lean methodology
- Overall (STATE)
- 83 Strongly Landlord-Friendly
- State Oklahoma
- 83 Strongly Landlord-Friendly · R+20
- County
- — inherits STATE
- City
- — inherits STATE
ZIP-level market 73071
- Rents YoY
- 2.8%
- Active inventory
- 356
- Price-to-rent
- 10.8×
Monthly cashflow live
- Estimated rent
- $1,355 high interval (Pro) →
- Mortgage (P&I)
- −$918
- Tax from tax record
- −$61 /mo · $732/yr
- Insurance
- −$73
- HOA
- −$0
- Vacancy / Maint / Mgmt
- −$285
- Net cashflow
- $19
Break-even live
Sensitivity live
| Price | -10% $118 | -5% $69 | +0% $19 | +5% $-30 | +10% $-80 |
|---|---|---|---|---|---|
| Rent | -10% $-88 | -5% $-34 | +0% $19 | +5% $73 | +10% $126 |
| Rate | -1.0pp $107 | -0.5pp $64 | base $19 | +0.5pp $-26 | +1.0pp $-72 |
UW: 25.0% down · 7.5% · 30yr · 1.5% tax · 5.0% vac · 8.0% maint · 8.0% mgmt
Financing live
Cash to close
- Down payment
- $43,750
- Closing costs
- $5,250
- Reserves months
- —
- Total cash needed
- —
Loan-product check · same deal, 3 products live
Conventional
25% down · 7.5% · 30yr
- Down + closing
- —
- Monthly P&I
- —
- Monthly cashflow
- —
- DSCR
- —
- Eligible?
- —
Personal DTI + credit; lowest rate.
DSCR
20% down · 8.5% · 30yr
- Down + closing
- —
- Monthly P&I
- —
- Monthly cashflow
- —
- DSCR
- —
- Eligible?
- —
No personal income docs; deal must DSCR.
Hard money
10% down · 12.0% · 12mo
- Down + closing
- —
- Monthly P&I
- —
- Monthly cashflow
- —
- DSCR
- —
- Eligible?
- —
Short-term bridge; refi at stabilization.
Rent comps 38 comps
| Address | Beds | Baths | Sqft | Rent | $/sqft | DOM | Units | Dist |
|---|---|---|---|---|---|---|---|---|
| 602 Tiffin Ave Norman, OK | 2.0 | 1.0 | 720 | $1,249 | $1.73 | 12d | 1 | 0.22mi |
| 523 E Main St #1 Norman, OK | 2.0 | 2.0 | 1144 | $1,400 | $1.22 | 12d | 1 | 0.58mi |
| 110 E Dale St Norman, OK | 2.0 | 1.0 | 792 | $950 | $1.20 | 12d | 1 | 0.64mi |
| 101 E Haddock St Norman, OK | 3.0 | 1.0 | 1146 | $1,425 | $1.24 | 16d | 1 | 0.73mi |
| 1413 Buena Vista Cir Norman, OK | 3.0 | 2.0 | 1209 | $1,545 | $1.28 | 25d | 1 | 0.74mi |
| 1640 High Cir Norman, OK | 3.0 | 2.0 | 1215 | $1,200 | $0.99 | 16d | 1 | 0.77mi |
| 203 W Dale St Norman, OK | 3.0 | 2.0 | 997 | $1,395 | $1.40 | 25d | 1 | 0.82mi |
| 213 Skylark Ct Norman, OK | 2.0 | 1.5 | 1000 | $1,050 | $1.05 | 21d | 1 | 0.88mi |
| 316 Falcon Ct Unit 2 Norman, OK | 2.0 | 1.0 | 975 | $875 | $0.90 | 25d | 1 | 0.88mi |
| 211 Skylark Ct #213 Norman, OK | 2.0 | 1.5 | 1050 | $1,050 | $1.00 | 21d | 1 | 0.88mi |
| 227 W Ridge Rd Norman, OK | 3.0 | 2.0 | 1172 | $1,420 | $1.21 | 16d | 1 | 0.93mi |
| 101 Maple Ln Norman, OK | 3.0 | 1.0 | 1164 | $1,700 | $1.46 | 25d | 1 | 1.06mi |
| 1605 Blessing Ct Norman, OK | 4.0 | 1.5 | 1071 | $1,930 | $1.80 | 25d | 1 | 1.14mi |
| 800 Lexington St Norman, OK | 3.0 | 2.0 | 1056 | $1,259 | $1.19 | 3d | 1 | 1.18mi |
| 343 Woodcrest Dr Norman, OK | 3.0 | 2.0 | 1470 | $1,495 | $1.02 | 25d | 1 | 1.21mi |
| 414 Ferrill St #416 Norman, OK | 2.0 | 1.0 | 800 | $875 | $1.09 | 5d | 1 | 1.23mi |
| 222 S University Blvd Norman, OK | 2.0 | 2.0 | 775 | $2,875 | $3.71 | 16d | 1 | 1.27mi |
| 930 Miller Ave Norman, OK | 2.0 | 2.0 | 1050 | $1,545 | $1.47 | 5d | 1 | 1.29mi |
| 418 N Flood Ave Norman, OK | 3.0 | 1.0 | 1200 | $1,600 | $1.33 | 5d | 1 | 1.30mi |
| 241 Emelyn St Norman, OK | 3.0 | 2.0 | 910 | $1,500 | $1.65 | 5d | 1 | 1.31mi |
| 712 Dakota St Norman, OK | 3.0 | 1.0 | 1353 | $1,395 | $1.03 | 5d | 1 | 1.32mi |
| 1104 W Robinson St Norman, OK | 3.0 | 1.0 | 995 | $1,250 | $1.26 | 12d | 1 | 1.33mi |
| 816 Sequoyah Trl Norman, OK | 3.0 | 2.0 | 1367 | $1,525 | $1.12 | 5d | 1 | 1.34mi |
| 751 Iowa St Norman, OK | 3.0 | 1.0 | 1148 | $1,600 | $1.39 | 5d | 1 | 1.34mi |
| 1616 Alameda St Norman, OK | 1.0–2.0 | 1.0–1.5 | 975 | $980 | $1.01 | 25d | 8 | 1.35mi |
| 1616 Alameda St Norman, OK | 2.0 | 1.0–1.5 | 925 | $938 | $1.01 | 12d | 1 | 1.35mi |
| 1616 Cara Jo Dr Norman, OK | 2.0 | 2.5 | 1200 | $1,100 | $0.92 | 25d | 1 | 1.38mi |
| 216 Justin Dr Norman, OK | 2.0 | 2.5 | 1200 | $1,000 | $0.83 | 25d | 1 | 1.39mi |
| 820 Iowa St Norman, OK | 2.0 | 1.0 | 752 | $1,350 | $1.80 | 25d | 1 | 1.39mi |
| 401 12th Ave SE Norman, OK | 1.0–2.0 | 1.0–2.0 | 842 | $949 | $1.13 | 5d | 2 | 1.41mi |
| 1612 Claudia Dr Norman, OK | 3.0 | 2.5 | 1200 | $1,350 | $1.12 | 5d | 1 | 1.42mi |
| 222 McCullough Norman, OK | 3.0 | 2.0 | 1175 | $3,300 | $2.81 | 25d | 1 | 1.42mi |
| 1628 Claudia Dr Norman, OK | 3.0 | 2.5 | 1200 | $1,250 | $1.04 | 25d | 1 | 1.43mi |
| 1626 Glenn Bo Dr Norman, OK | 2.0 | 2.5 | 1320 | $1,150 | $0.87 | 23d | 1 | 1.43mi |
| 375 Triad Village Dr Norman, OK | 3.0 | 2.0–2.5 | 1428 | $1,425 | $1.00 | 25d | 2 | 1.43mi |
| 375 Triad Village Dr Norman, OK | 3.0 | 2.0 | 1428 | $1,425 | $1.00 | 23d | 1 | 1.43mi |
| 1712 Jennifer Cir Norman, OK | 3.0 | 1.5 | 1425 | $1,195 | $0.84 | 23d | 1 | 1.44mi |
| 911 Nebraska St Norman, OK | 2.0 | 1.0 | 750 | $1,095 | $1.46 | 16d | 1 | 1.48mi |
Listing history 4 events
-
2026-06-17status $175,000 Pending 2 DOM
-
2026-06-17days on market $175,000 Active 2 DOM
-
2026-06-16remarks 699-char remark
-
2026-06-16$175,000 Active 1 DOM
ⓘ Source: listings_history table (triggers on properties + properties_extension) + one-shot
backfill from property_details.listing_events for pre-trigger history.
Tax reassessment forecast OK · Resets to sale price
- Current annual tax
- $732 · $61/mo
- Projected year-2 tax
- $1,575 · $131/mo
- Expected delta
- +$843/yr (+$70/mo · 115.2%)
ⓘ Screening estimate from a state-policy table — verify with the county assessor before closing.
Climate risk First Street
- Flood 1/10 Low FEMA zone X (unshaded) · 0% chance over 30 yrs
- Wildfire 4/10 Moderate
- Heat 6/10 Major 7 d/yr ≥108°F today · 19 d/yr by 30 yrs out
- Wind 3/10 Moderate 5% chance of damaging wind over 30 yrs
- Air quality 2/10 Low 1 unhealthy d/yr today · 1 by 30 yrs out
Nearby sold comps map
Loading sold comps map…
Walkable amenities ~0.75 mi
Loading nearby amenities…
Taxation est. · year 1
- Rental income
- $16,264
- − Mortgage interest
- −$9,803
- − Property taxes
- −$732
- − Insurance
- −$875
- − Repairs & maintenance
- −$1,301
- − Management
- −$1,301
- − Depreciation
- −$5,091
- Taxable loss
- −$2,839
- Est. tax savings @ 24.0%
- +$681
- After-tax cash flow
- $910/yr
For passive investors: Depreciation is non-cash, so a rental often shows a tax loss while cash-flowing — sheltering income. Rental losses are passive: they offset passive income freely, and up to $25,000/yr can offset ordinary (W-2) income if you actively participate and your MAGI is under $100k (phasing out to $0 by $150k); unused losses carry forward. On sale, claimed depreciation is recaptured at up to 25%, and gains may owe capital-gains tax (a 1031 exchange can defer both). Figures are a year-1 estimate at your 24.0% rate — not tax advice; consult a CPA.
Schools (NCES district)
- District
- Norman
- NCES district ID
- 4021720
- Math proficiency
- 27% ▼ -9.00%
- Reading proficiency
- 32% ▼ -8.00%
- Median HH income
- $48,940
- Composite
- 25.67/100
- National rank
- #7395
- State rank
- #61 of 270 in OK
Livability — Norman
- Score
- 85/100
- State rank
- #1
- US rank
- #557
Category grades
Schools grade is shown separately in the Schools card above.
Census & demographics
- Census place
- Norman, OK
- County
- Cleveland County · 239,547 people
- City population
- 123,141
- Metro
- Oklahoma City, OK
- Population (ZIP)
- 43,798
- Household income
- $64,007
- Rent vs Own
- Severe rent burden
- 1903.0
Population outlook (Cleveland County) Hauer SSP2
- Today (2025)
- 323,621 people
- By 2030
- 349,070 · +7.9%
- By 2040
- 400,168 · +23.7%
- By 2050
- 454,101 · +40.3%
- By 2075
- 602,926 · +86.3%
- By 2100
- 734,485 · +127.0%
Race, ethnicity, and origin ACS 2023
- Neighborhood character
- Predominantly White (68%)
- Race & ethnicity
- White 68% Two or more races 12% Black 8% Hispanic / Latino 8% Asian 3% Native American 3%
- Hispanic origin (detail)
- Mexican 5%
- Common ancestry
- Italian 3% Serbian 3% Lithuanian 2%
- Foreign-born
- 7% · Canada, China
- Languages at home
- 89% English-only · Spanish 5% Other Indo-European 1% Chinese 1%
Political lean MEDSL · Cleveland
- 2024 margin
- R (+14.9) · D 41.4% · R 56.4% · Other 2.2%
- 2008→2024 swing
- +9.1pp toward D · 2008: -24.0pp · 2024: -14.9pp
- All cycles
- 2024: R+14.9 2020: R+14.1 2016: R+21.7 2012: R+25.9 2008: R+24.0
Not yet ingested
- Civics
- —
Market trends
- HPI YoY
- ▼ -187.04%
- Current HPI
- 249.3797
- Rent YoY
- ▲ 2.80%
- Metro
- Oklahoma City, OK
- State GDP YoY
- ▲ 1.55%
- F500 in state
- 6
Industry mix (Fortune 500 HQ in OK)
| Industry | F500 HQs | Revenue |
|---|---|---|
| Energy | 3 | $48B |
|
||
Price history
1 event — show timeline
- 2026-06-15 Listed $175,000 MLSOK
Property tax history
-0.1%/yrLatest (2024): $732 · -0.1% YoY. Source: county tax records.
Cash-flow waterfall
monthlySold comps — $/sqft
last 12 mo · ≤1 miLoading sold comps…