269 Angel Dr · Lakehills, TX
Flood risk 1/10 · Minimal
- FEMA flood zone
- X (unshaded)
- Chance of flooding over 30 yrs
- 0.0%
- Est. flood insurance / yr
- $507 – $1,088
Fire risk 3/10 · Minor
- Est. fire insurance / yr
- $1,222 – $2,270
Heat risk 7/10 · Major
- Hot days now (above 106°F)
- 7 days/yr
- Hot days in 30 yrs
- 22 days/yr
Wind risk 6/10 · Moderate
- Chance of severe wind over 30 yrs
- 62.0%
Air-quality risk 2/10 · Minimal
- Unhealthy air days now
- 0 days/yr
- Unhealthy air days in 30 yrs
- 1 days/yr
Risk factors via First Street. Map © Google.
Why this score? — see what drove the B- grade
The composite is a weighted blend of 9 inputs, each scored 0–100. Each bar is that input's sub-score; the figure is the points it added to the 100-point composite (weight × sub-score).
- Cash flow +30.0/30.0
- DSCR +10.0/10.0
- 1% rule +9.0/10.0
- ARV discount +7.5/15.0
- Schools +3.1/10.0
- Livability +3.1/5.0
- Rent growth +2.5/5.0
- Condition / age +2.5/5.0
- Appreciation +0.0/10.0
$85,500
🖨 Deal sheet (PDF) 📄 Offer letter ✓ Due diligence
Listing remarks
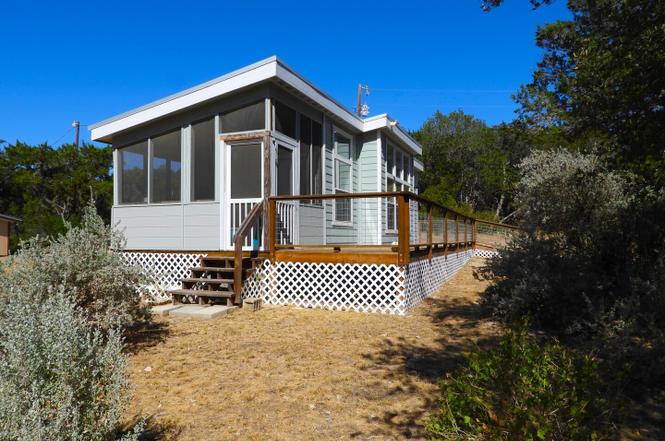
Absolutely charming tiny home! Bright and breezy, this space is filled with natural light from numerous windows. Features include laminate flooring throughout and an efficiency kitchen with a flexible open floor plan. With one bedroom and one bath, it also boasts a cozy screened-in porch. A new well has been installed, and the home is conveniently located near Medina Lake. This is the perfect retreat from the hustle and bustle of city life!
Key facts
- Laminate flooring
- Open floor plan
- New well
Tags
Property features AI
Finance
- Other:
- Financial info: Down payment assistance resources available
- HOA & community: Located in the Avalon subdivision
Exterior
- Parking:
- Security:
- Utilities: Electric service by Bandera Electric; Well on site for water (private well); Private garbage service
- Home design: Pre-owned single-family home; Metal roof; Siding and cement fiber exterior
- Construction: Approximately 7 years old; Metal roof; Siding and cement fiber exterior
- Exterior features: Covered patio; Deck / balcony; Chain link and partial fencing; Double pane windows; Cul-de-sac / dead end lot
Interior
- Kitchen: Refrigerator; Kitchen approximately 13 x 13
- Bedrooms: Master bedroom on lower level with ceiling fan and full bath (12 x 11)
- Flooring: Laminate flooring
- Bathrooms: 1 full bathroom
- Heating & cooling: Central heating (electric); Central air conditioning
- Interior features: Ceiling fans; Open floor plan; Living/dining room combination; Ground level / no steps; Cable TV available; High-speed internet; Some window coverings remain; Private garbage service; Electric water heater; 1 living area
- Laundry & utility: Private garbage service
Neighborhood map
What this means for you Summary
Snapshot
- This is a 1-bed/1.0-bath townhouse listed at $86k.
Deal economics
- At list price, monthly cash flow is $357 ($4k/yr) — positive.
- The deal already cash-flows at list — no discount required.
- Meets the 1% rule at list price ($1k rent vs $86k).
- Recommended offer: $75k (12.0% below list) — sets the bar for market timing.
- Cap rate 11.3% vs local median 2.3% in Lakehills — top-decile yield for the area; either an underpriced asset or a hidden risk that comps aren't pricing in. Stress-test before assuming the spread holds.
Location & tenants
- Location reads 62/100 on livability (#963 in TX) — a middle-class / working-renter tenant base. Strengths: cost of living A+, housing A+, crime B+; Watch: amenities F, commute F, health & safety F.
- Bandera ISD (rural): math 30% / reading 41% proficiency, ranked #500 of 826 in TX (top 60%) — families likely to look elsewhere, expect single-tenant / working-renter base with shorter leases.
- Zoned schools: Hill Country El (math 47% / reading 46%, grade D-, #1,080 of 4,322 statewide, top 25%, 483 students, 62% FRL); Bandera H S (math 22% / reading 46%, grade F, #1,002 of 1,632 statewide, top 62%, 713 students, 48% FRL).
- Market conditions: 271 active listings in the ZIP; 6 units permitted in Bandera County in 2024 (0 in 5+ unit buildings).
Forward outlook
- Local home prices are declining (-3.0%/yr); year-one equity from $591 of loan paydown is wiped out by about $3k of value loss. Plan a longer hold.
- At projected returns (-3.0% appreciation + 3.0% rent growth), your $24k cash investment doubles in ~7 years — after that, you're playing with house money.
Negotiation context
- It's been on market 237 days — a 12% lower offer ($75k) is reasonable based on typical stale-listing flexibility.
- 5 sale attempts since 2y ago; this cycle's ask has dropped $34k (29%) from the opening price — seller is motivated, your offer sets the floor, not the list.
Risks & watch-outs
- Climate carrying-cost: major wind risk, 62% chance of damaging wind over 30y; extreme-heat days projected 7→22/yr by 2055 (HVAC capex compounding) — expect insurance premiums to compound above CPI over the hold.
Questions for the listing agent
- It's been on market 237 days. Have you received any prior offers? Is the seller open to a 12% concession, seller financing, or rate buy-down credit?
- Why hasn't it sold? Are there any deal-killer items the seller is aware of (foundation, flood, title, zoning, code violations)?
- Is there a deadline driving the sale (1031 exchange, divorce, estate, relocation)? That informs how much negotiation room exists.
- Schools are D-rated, which usually means shorter tenancies and higher turnover. Who's the typical renter profile here, and what's been the actual vacancy rate?
- What's the average days-on-market for RENTAL listings here right now (not sales)? A rising rental-DOM trend means longer vacancies and softer asking-rent achievability than the comps imply.
- What's the recent tenant-quality profile in this submarket — average credit score on applications, eviction rate, late-payment / NSF rate, and stable-employment percentage? A property-management company in the area should have these aggregated.
- How much new for-sale + rental construction is in the pipeline within 1–3 miles? Heavy new supply typically softens prices + rents 12–24 months out; constrained supply supports both.
Investment metrics
- 1% rule
- 1.40% ✓
- Cap rate
- 11.30%
- Cash-on-cash
- 17.89%
- DSCR
- 1.80
- GRM
- 5.9
CMA / ARV
No comps found within radius.
Projected returns pro-forma
-3.0% appreciation · 3.0% rent growth · sell at horizon
- IRR
- 9.4%
- Equity multiple
- 1.37×
- Total profit
- $8,892
- Equity at exit
- $12,748
- IRR
- 18.6%
- Equity multiple
- 2.55×
- Total profit
- $37,083
- Equity at exit
- $7,392
Cash invested: $23,940 (down + closing). Projections, not guarantees.
Landlord ↔ Tenant lean methodology
- Overall (STATE)
- 87 Strongly Landlord-Friendly
- State Texas
- 87 Strongly Landlord-Friendly · R+5
- County
- — inherits STATE
- City
- — inherits STATE
ZIP-level market 78063
- Home prices YoY
- -31.6%
- Active inventory
- 271
- Price-to-rent
- 5.9×
Monthly cashflow live
- Estimated rent
- $1,200 medium interval (Pro) →
- Mortgage (P&I)
- −$448
- Tax est. 1.5%
- −$107 /mo · $1,282/yr
- Insurance
- −$36
- HOA
- −$0
- Vacancy / Maint / Mgmt
- −$252
- Net cashflow
- $357
Break-even live
Sensitivity live
| Price | -10% $416 | -5% $386 | +0% $357 | +5% $327 | +10% $298 |
|---|---|---|---|---|---|
| Rent | -10% $262 | -5% $309 | +0% $357 | +5% $404 | +10% $452 |
| Rate | -1.0pp $400 | -0.5pp $379 | base $357 | +0.5pp $335 | +1.0pp $312 |
UW: 25.0% down · 7.5% · 30yr · 1.5% tax · 5.0% vac · 8.0% maint · 8.0% mgmt
Financing live
Cash to close
- Down payment
- $21,375
- Closing costs
- $2,565
- Reserves months
- —
- Total cash needed
- —
Loan-product check · same deal, 3 products live
Conventional
25% down · 7.5% · 30yr
- Down + closing
- —
- Monthly P&I
- —
- Monthly cashflow
- —
- DSCR
- —
- Eligible?
- —
Personal DTI + credit; lowest rate.
DSCR
20% down · 8.5% · 30yr
- Down + closing
- —
- Monthly P&I
- —
- Monthly cashflow
- —
- DSCR
- —
- Eligible?
- —
No personal income docs; deal must DSCR.
Hard money
10% down · 12.0% · 12mo
- Down + closing
- —
- Monthly P&I
- —
- Monthly cashflow
- —
- DSCR
- —
- Eligible?
- —
Short-term bridge; refi at stabilization.
Listing history 22 events
-
2026-05-25soldstatus Sold
-
2026-05-06status Pending
-
2026-04-27historical Active Option
-
2026-03-18price $85,500
-
2026-03-18status Back on Market
-
2025-11-24historical
-
2025-11-19price $95,500
-
2025-09-30price $99,750
-
2025-08-28price $112,500
-
2025-08-22price $115,000
-
2025-05-20$120,000 New
-
2025-04-14historical
-
2025-03-21price $125,000
-
2025-01-12price $130,000
-
2024-10-28$139,000 New
-
2024-10-02historical
-
2024-08-02$149,500 New
-
2024-08-01historical
-
2024-07-26price $149,500
-
2024-05-10price $179,000
-
2024-03-04$185,000 New
-
2016-04-29soldstatus
ⓘ Source: listings_history table (triggers on properties + properties_extension) + one-shot
backfill from property_details.listing_events for pre-trigger history.
Climate risk First Street
- Flood 1/10 Low FEMA zone X (unshaded) · 0% chance over 30 yrs
- Wildfire 3/10 Moderate
- Heat 7/10 Severe 7 d/yr ≥106°F today · 22 d/yr by 30 yrs out
- Wind 6/10 Major 62% chance of damaging wind over 30 yrs
- Air quality 2/10 Low 0 unhealthy d/yr today · 1 by 30 yrs out
Nearby sold comps map
Loading sold comps map…
Walkable amenities ~0.75 mi
Loading nearby amenities…
Taxation est. · year 1
- Rental income
- $14,396
- − Mortgage interest
- −$4,789
- − Property taxes
- −$1,282
- − Insurance
- −$428
- − Repairs & maintenance
- −$1,152
- − Management
- −$1,152
- − Depreciation
- −$2,487
- Taxable income
- $3,106
- Est. tax owed @ 24.0%
- −$745
- After-tax cash flow
- $3,537/yr
For passive investors: Depreciation is non-cash, so a rental often shows a tax loss while cash-flowing — sheltering income. Rental losses are passive: they offset passive income freely, and up to $25,000/yr can offset ordinary (W-2) income if you actively participate and your MAGI is under $100k (phasing out to $0 by $150k); unused losses carry forward. On sale, claimed depreciation is recaptured at up to 25%, and gains may owe capital-gains tax (a 1031 exchange can defer both). Figures are a year-1 estimate at your 24.0% rate — not tax advice; consult a CPA.
Schools (NCES district)
- District
- Bandera ISD
- NCES district ID
- 4809360
- Math proficiency
- 30% ▼ -7.00%
- Reading proficiency
- 41% ▼ -3.00%
- Median HH income
- $48,771
- Composite
- 30.61/100
- National rank
- #6194
- State rank
- #500 of 826 in TX
Livability — Lakehills
- Score
- 62/100
- State rank
- #963
- US rank
- #17024
Category grades
Schools grade is shown separately in the Schools card above.
Census & demographics
- Census place
- Lakehills, TX
- City population
- 10,594
- Population (ZIP)
- 10,594
Population outlook (Bandera County) Hauer SSP2
- Today (2025)
- 22,614 people
- By 2030
- 23,102 · +2.2%
- By 2040
- 23,489 · +3.9%
- By 2050
- 23,264 · +2.9%
- By 2075
- 23,607 · +4.4%
- By 2100
- 22,265 · -1.5%
Race, ethnicity, and origin ACS 2023
- Neighborhood character
- Predominantly White (76%)
- Race & ethnicity
- White 76% Hispanic / Latino 18% Two or more races 15%
- Hispanic origin (detail)
- Mexican 15%
- Common ancestry
- Slovak 5% Romanian 3% Serbian 2%
- Foreign-born
- 5% · Canada
- Languages at home
- 88% English-only · Spanish 9% German/W. Germanic 2%
Political lean MEDSL · Bandera
- 2024 margin
- Solid R (+61.9) · D 18.6% · R 80.5%
- 2008→2024 swing
- -11.5pp toward R · 2008: -50.4pp · 2024: -61.9pp
- All cycles
- 2024: R+61.9 2020: R+59.4 2016: R+63.0 2012: R+59.0 2008: R+50.4
Not yet ingested
- Civics
- —
Market trends
- HPI YoY
- ▼ -87.38%
- Current HPI
- 189.1086
- Rent YoY
- —
- Metro
- —
- State GDP YoY
- ▲ 3.95%
- F500 in state
- 110
Industry mix (Fortune 500 HQ in TX)
| Industry | F500 HQs | Revenue |
|---|---|---|
| Energy | 16 | $1,198B |
|
||
| Technology | 5 | $198B |
|
||
| Engineering / Construction | 4 | $72B |
|
||
| Energy Services | 3 | $60B |
|
||
| Utilities | 3 | $41B |
|
||
| Healthcare | 2 | $330B |
|
||
Price history
-53.8% since first listed22 events — show timeline
- 2026-05-25 Sold (MLS) — LERA
- 2026-05-06 Pending — LERA
- 2026-04-27 Contingent — LERA
- 2026-03-18 Price Changed $85,500 LERA
- 2026-03-18 Relisted — LERA
- 2025-11-24 Listing Removed — LERA
- 2025-11-19 Price Changed $95,500 LERA
- 2025-09-30 Price Changed $99,750 LERA
- 2025-08-28 Price Changed $112,500 LERA
- 2025-08-22 Price Changed $115,000 LERA
- 2025-05-20 Listed $120,000 LERA
- 2025-04-14 Listing Removed — LERA
- 2025-03-21 Price Changed $125,000 LERA
- 2025-01-12 Price Changed $130,000 LERA
- 2024-10-28 Listed $139,000 LERA
- 2024-10-02 Listing Removed — LERA
- 2024-08-02 Listed $149,500 LERA
- 2024-08-01 Listing Removed — LERA
- 2024-07-26 Price Changed $149,500 LERA
- 2024-05-10 Price Changed $179,000 LERA
- 2024-03-04 Listed $185,000 LERA
- 2016-04-29 Sold (Public Records) — Public Records
Property tax history
-4.8%/yrLatest (2025): $154 · +1.0% YoY. Source: county tax records.
Cash-flow waterfall
monthlySold comps — $/sqft
last 12 mo · ≤1 miLoading sold comps…